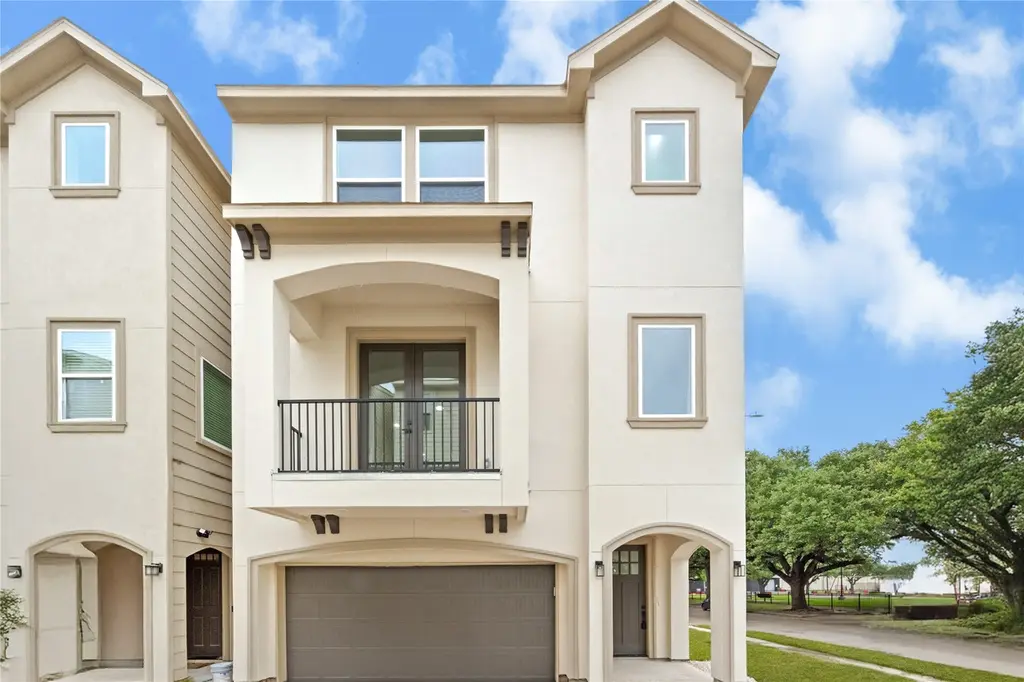
3335 Kilgore St · Houston, TX
Flood risk 4/10 · Minor
- FEMA flood zone
- X (unshaded)
- Chance of flooding over 30 yrs
- 0.22%
- Est. flood insurance / yr
- $507 – $1,088
Fire risk 1/10 · Minimal
- Est. fire insurance / yr
- $1,222 – $2,270
Heat risk 9/10 · Severe
- Hot days now (above 109°F)
- 7 days/yr
- Hot days in 30 yrs
- 25 days/yr
Wind risk 9/10 · Severe
- Chance of severe wind over 30 yrs
- 99.0%
Air-quality risk 2/10 · Minimal
- Unhealthy air days now
- 2 days/yr
- Unhealthy air days in 30 yrs
- 2 days/yr
Risk factors via First Street. Map © Google.
Why this score? — see what drove the C+ grade
The composite is a weighted blend of 9 inputs, each scored 0–100. Each bar is that input's sub-score; the figure is the points it added to the 100-point composite (weight × sub-score).
- Cash flow +22.5/30.0
- ARV discount +15.0/15.0
- DSCR +7.2/10.0
- 1% rule +4.8/10.0
- Livability +3.7/5.0
- Rent growth +3.0/5.0
- Schools +2.7/10.0
- Condition / age +2.5/5.0
- Appreciation +0.0/10.0
$395,000
🖨 Deal sheet 📄 Offer letter ✓ Due diligence
Listing remarks MLS
GREAT location for a new development. New construction sold and under construction on the same street. new Commercial construction close by. Located minutes from the freeway (no sitting in traffic). A VERY short drive to the medical center, downtown Houston and much more. Re-plated for 6 townhouse.
Key facts
- Quartz countertops
- Large island
- Stucco exterior
Tags
Property features AI
Finance
- Other: Total building area approximately 2,822; Lot about 1,920 sq ft (0.0441 acres)
Exterior
- Parking: Attached garage; 2 garage spaces
- Utilities: Public water; Public sewer
- Home design: Residential property; Slab foundation
- Construction: Cement siding; Stucco exterior; Composition roof; Built in 2025
- Exterior features: Corner lot; Concrete road surface
Interior
- Kitchen: Dishwasher; Disposal; Gas oven; Gas range; Microwave
- Bedrooms: 3 bedrooms
- Flooring: Laminate; Tile
- Bathrooms: 3 full bathrooms; 1 half bathroom
- Heating & cooling: Central heating (gas); Central air conditioning (gas)
- Interior features: Breakfast bar; Double vanity; Entrance foyer; Kitchen island; Pantry; Soaking tub; Separate shower; Tub with shower; Ceiling fans; Kitchen/dining combo; Living/dining room
- Laundry & utility: Washer hookup; Gas dryer hookup
Neighborhood map
What this means for you Summary
Snapshot
- This is a 3-bed/3.5-bath single-family listed at $395k.
Deal economics
- At list price, monthly cash flow is $667 ($8k/yr) — positive.
- The deal already cash-flows at list — no discount required.
- To meet the 1% rule (rent ≥ 1% of price), the offer needs to be $388k (1.8% below list).
- Recommended offer: $388k (1.8% below list) — sets the bar for 1% rule.
- Cap rate 8.3% vs local median 3.2% in Houston — top-decile yield for the area; either an underpriced asset or a hidden risk that comps aren't pricing in. Stress-test before assuming the spread holds.
Location & tenants
- Location reads 74/100 on livability (#184 in TX, #4,771 nationally) — a middle-class / working-renter tenant base. Strengths: amenities A+, cost of living A+, housing A+; Watch: crime F.
- Houston ISD (urban): math 27% / reading 35% proficiency, ranked #593 of 826 in TX (top 72%) — families likely to look elsewhere, expect single-tenant / working-renter base with shorter leases; 71% free/reduced lunch — lower-income household profile, screen leases tightly.
- Zoned schools: Cullen Middle (math 6% / reading 14%, grade F, #1,641 of 1,662 statewide, top 99%, 324 students, 100% FRL); Yates H S (math 12% / reading 23%, grade F, #1,451 of 1,632 statewide, top 89%, 851 students, 96% FRL) — zoned schools average 98% FRL vs 71% district-wide (27 pts higher); higher-poverty schools than district average — tighter screening recommended.
- Zoned-school proficiency averages 14% at this address vs 31% district-wide (-17 pts) — the specific schools serving this property underperform the Houston ISD average; the district grade overstates school quality for this exact location.
- Market conditions: Rents rising (+2.2%/yr); 467 active listings in the ZIP; 24 comparable units currently listed for rent nearby; rentals at typical pace (median 25d on market — plan ~3-4 weeks tenant-placement turnaround); 46% of comp listings sitting > 30 days — soft ceiling on asking rent; 29,883 units permitted in Harris County in 2024 (8,621 in 5+ unit buildings).
- At $3,878/mo this rent would consume 102% of the median local household income ($46k/yr) (locally 2532% of renters already pay >50% of income on rent) — very limited rent-growth headroom before tenants either downsize or default.
Forward outlook
- Local home prices are declining (-3.0%/yr); year-one equity from $3k of loan paydown is wiped out by about $12k of value loss. Plan a longer hold.
- Harris County population projected at +47% by 2050 — long-run rental-demand tailwind backs the buy-and-hold thesis.
Negotiation context
- It's been on market 19 days — a 2% lower offer ($389k) is reasonable based on typical stale-listing flexibility.
- 3 sale attempts since 8y ago with the ask held roughly flat each time — persistent listings suggest the price (not the market) is what's stuck; bring a comps-based counter.
Risks & watch-outs
- Climate carrying-cost: severe wind risk, 99% chance of damaging wind over 30y; extreme-heat days projected 7→25/yr by 2055 (HVAC capex compounding) — expect insurance premiums to compound above CPI over the hold.
Questions for the listing agent
- Is there a deadline driving the sale (1031 exchange, divorce, estate, relocation)? That informs how much negotiation room exists.
- Schools are D-rated, which usually means shorter tenancies and higher turnover. Who's the typical renter profile here, and what's been the actual vacancy rate?
- Crime grade is F in this area — have there been break-ins, vandalism, or insurance claims at this property in the last 3 years? What carrier currently insures it and at what premium?
- What's the average days-on-market for RENTAL listings here right now (not sales)? A rising rental-DOM trend means longer vacancies and softer asking-rent achievability than the comps imply.
- What's the recent tenant-quality profile in this submarket — average credit score on applications, eviction rate, late-payment / NSF rate, and stable-employment percentage? A property-management company in the area should have these aggregated.
- How much new for-sale + rental construction is in the pipeline within 1–3 miles? Heavy new supply typically softens prices + rents 12–24 months out; constrained supply supports both.
Investment metrics
- 1% rule
- 0.98% ✗
- Cap rate
- 8.32%
- Cash-on-cash
- 7.24%
- DSCR
- 1.32
- GRM
- 8.5
CMA / ARV
- ARV (on-the-fly)
- $595,442
- Comps found
- 12
Show comp detail 12 sales within ~0.75 mi
| Address | Dist | Beds/Ba | Sqft | Sold | Price | $/sf | Match |
|---|---|---|---|---|---|---|---|
| 6403 Bowling Green St | 0.09mi | 3/3.5 | 2,689 (-5%) | 1mo | $455,000 | $169 | 87 |
| 3417 Charleston St | 0.40mi | 3/2.0 | 2,768 (-2%) | 7mo | $450,000 | $163 | 66 |
| 3215 Milburn St | 0.35mi | 4/2.5 (+1) | 2,991 (+6%) | 1mo | $425,000 | $142 | 64 |
| 3375 Tampa St | 0.19mi | 4/4.0 (+1) | 3,005 (+6%) | 13mo | $875,000 | $291 | 62 |
| 3217 Parkwood Dr | 0.42mi | 3/3.5 | 2,461 (-13%) | 1mo | $699,000 | $284 | 58 |
| 6343 E Mystic Mdw | 0.55mi | 3/3.5 | 2,703 (-4%) | 12mo | $575,000 | $213 | 58 |
| 2414 Charleston St Unit C | 0.67mi | 3/3.5 | 2,559 (-9%) | 1mo | $415,000 | $162 | 52 |
| 3209 Binz St | 0.72mi | 4/4.5 (+1) | 2,745 (-3%) | 2mo | $715,000 | $260 | 51 |
| 5502 Lunia Ln | 0.67mi | 3/3.5 | 2,475 (-12%) | 2mo | $399,000 | $161 | 46 |
| 6314 W Mystic Mdw | 0.67mi | 3/2.5 | 2,669 (-5%) | 14mo | $569,000 | $213 | 44 |
| 2438 S Mystic Mdw | 0.55mi | 4/3.5 (+1) | 3,076 (+9%) | 14mo | $649,999 | $211 | 42 |
| 3202 Binz St | 0.71mi | 4/3.5 (+1) | 2,519 (-11%) | 10mo | $466,000 | $185 | 36 |
Match score weights: distance 35% · size 25% · config 20% · recency 20%. Top-matched comps best support the ARV.
Projected returns pro-forma
-3.0% appreciation · 2.17% rent growth · sell at horizon
- IRR
- -6.1%
- Equity multiple
- 0.78×
- Total profit
- $-24,867
- Equity at exit
- $58,896
- IRR
- 2.6%
- Equity multiple
- 1.18×
- Total profit
- $19,514
- Equity at exit
- $34,152
Cash invested: $110,600 (down + closing). Projections, not guarantees.
Landlord ↔ Tenant lean methodology
- Overall (STATE)
- 87 Strongly Landlord-Friendly
- State Texas
- 87 Strongly Landlord-Friendly · R+5
- County
- — inherits STATE
- City
- — inherits STATE
ZIP-level market 77021
- Home prices YoY
- -23.6%
- Rents YoY
- 2.2%
- Active inventory
- 467
- Price-to-rent
- 8.5×
Monthly cashflow live
- Estimated rent
- $3,878 high interval (Pro) →
- Mortgage (P&I)
- −$2,071
- Tax from tax record
- −$160 /mo · $1,920/yr
- Insurance
- −$165
- HOA
- −$0
- Vacancy / Maint / Mgmt
- −$814
- Net cashflow
- $667
Break-even live
UW: 25.0% down · 7.5% · 30yr · 1.5% tax · 5.0% vac · 8.0% maint · 8.0% mgmt
Financing live
Cash to close
- Down payment
- $98,750
- Closing costs
- $11,850
- Reserves months
- —
- Total cash needed
- —
Loan-product check · same deal, 3 products live
Conventional
25% down · 7.5% · 30yr
- Down + closing
- —
- Monthly P&I
- —
- Monthly cashflow
- —
- DSCR
- —
- Eligible?
- —
Personal DTI + credit; lowest rate.
DSCR
20% down · 8.5% · 30yr
- Down + closing
- —
- Monthly P&I
- —
- Monthly cashflow
- —
- DSCR
- —
- Eligible?
- —
No personal income docs; deal must DSCR.
Hard money
10% down · 12.0% · 12mo
- Down + closing
- —
- Monthly P&I
- —
- Monthly cashflow
- —
- DSCR
- —
- Eligible?
- —
Short-term bridge; refi at stabilization.
Rent comps 24 comps
| Address | Beds | Baths | Sqft | Rent | $/sqft | DOM | Units | Dist |
|---|---|---|---|---|---|---|---|---|
| 6318 Grand Blvd Houston, TX | 3.0 | 3.5 | 2325 | $2,999 | $1.29 | 4d | 1 | 0.61mi |
| 3731 Alsace St Unit 1560804P Houston, TX | 3.0 | 2.0 | 2002 | $3,387 | $1.69 | 3d | 1 | 0.65mi |
| 3024 Charline Ave Houston, TX | 3.0 | 3.5 | 1995 | $2,950 | $1.48 | 44d | 1 | 0.66mi |
| 6125 Gehring St Houston, TX | 2.0 | 2.0 | 2041 | $2,500 | $1.22 | 44d | 1 | 0.69mi |
| 5505 Zoemark Ln Houston, TX | 3.0 | 3.5 | 2477 | $2,850 | $1.15 | 44d | 1 | 0.69mi |
| 5927 Almeda Rd Unit AHP3 Houston, TX | 4.0 | 4.5 | 3055 | $7,635 | $2.50 | 4d | 1 | 0.97mi |
| 5933 Almeda Rd Unit 2-1405 Houston, TX | 4.0 | 4.0 | 3055 | $7,442 | $2.44 | 44d | 1 | 0.98mi |
| 5927 Almeda Rd Houston, TX | 2.0–4.0 | 2.5–4.0 | 3055 | $5,768 | $1.89 | 13d | 2 | 0.98mi |
| 5927 Almeda Rd Houston, TX | 2.0–4.0 | 2.5–4.0 | 3055 | $4,788 | $1.57 | 2d | 3 | 0.98mi |
| 5927 Almeda Rd Houston, TX | 4.0 | 4.0 | 3055 | $7,635 | $2.50 | 24d | 1 | 0.98mi |
| 5927 Almeda Rd Houston, TX | 4.0 | 4.0 | 3055 | $7,635 | $2.50 | 44d | 1 | 0.98mi |
| 3615 Dreyfus St Houston, TX | 3.0 | 3.0 | 2011 | $2,800 | $1.39 | 44d | 1 | 1.00mi |
| 4135 DuPont St Houston, TX | 3.0 | 4.0 | 2395 | $2,499 | $1.04 | 44d | 1 | 1.13mi |
| 7507 Springhill St Houston, TX | 3.0 | 3.5 | 2000 | $4,500 | $2.25 | 44d | 1 | 1.16mi |
| 2802 Palm St Houston, TX | 2.0 | 1.0 | 3990 | $1,650 | $0.41 | 44d | 1 | 1.19mi |
| 1904 Lauderdale St Houston, TX | 3.0 | 3.5 | 2223 | $3,000 | $1.35 | 21d | 1 | 1.23mi |
| 7447 Cambridge St Houston, TX | 2.0 | 3.0 | 2256 | $3,350 | $1.48 | 44d | 1 | 1.24mi |
| 7016 Staffordshire Blvd Unit B Houston, TX | 3.0 | 3.5 | 2527 | $4,295 | $1.70 | 5d | 1 | 1.30mi |
| 3535 Wentworth St Houston, TX | 4.0 | 3.0 | 2600 | $2,650 | $1.02 | 22d | 1 | 1.32mi |
| 1699 Hermann Dr Houston, TX | 2.0 | 1.0–2.5 | 1331 | $7,118 | $5.35 | 2d | 10 | 1.33mi |
| 2703 Blodgett St Unit 1047952P Houston, TX | 1.0–5.0 | 1.5–5.5 | 2497 | $11,718 | $4.69 | 2d | 2 | 1.43mi |
| 2403 Arbor St Houston, TX | 3.0 | 2.5 | 2344 | $2,800 | $1.19 | 44d | 1 | 1.43mi |
| 1910 Oakdale St Unit A Houston, TX | 3.0 | 3.5 | 2452 | $3,890 | $1.59 | 12d | 1 | 1.44mi |
| 1818 Prospect St Houston, TX | 3.0 | 2.0 | 2923 | $3,400 | $1.16 | 4d | 1 | 1.46mi |
Listing history 12 events
-
2026-06-18days on market $395,000 Active 19 DOM
-
2026-06-17days on market $395,000 Active 18 DOM
-
2026-06-16days on market $395,000 Active 17 DOM
-
2026-06-15days on market $395,000 Active 16 DOM
-
2026-06-13days on market $395,000 Active 14 DOM
-
2026-06-09days on market $395,000 Active 10 DOM
-
2026-06-08days on market $395,000 Active 9 DOM
-
2026-06-07days on market $395,000 Active 8 DOM
-
2026-06-04days on market $395,000 Active 5 DOM
-
2026-06-03days on market $395,000 Active 4 DOM
-
2026-06-02days on market $395,000 Active 3 DOM
-
2026-06-01days on market $395,000 Active 2 DOM
ⓘ Source: listings_history table (triggers on properties + properties_extension) + one-shot
backfill from property_details.listing_events for pre-trigger history.
Tax reassessment forecast TX · Resets to sale price
- Current annual tax
- $1,920 · $160/mo
- Projected year-2 tax
- $7,228 · $602/mo
- Expected delta
- +$5,309/yr (+$442/mo · 276.5%)
ⓘ Screening estimate from a state-policy table — verify with the county assessor before closing.
Climate risk First Street
- Flood 4/10 Moderate FEMA zone X (unshaded) · 22% chance over 30 yrs
- Wildfire 1/10 Low
- Heat 9/10 Extreme 7 d/yr ≥109°F today · 25 d/yr by 30 yrs out
- Wind 9/10 Extreme 99% chance of damaging wind over 30 yrs
- Air quality 2/10 Low 2 unhealthy d/yr today · 2 by 30 yrs out
Nearby sold comps map
Loading sold comps map…
Walkable amenities ~0.75 mi
Loading nearby amenities…
Taxation est. · year 1
- Rental income
- $46,531
- − Mortgage interest
- −$22,126
- − Property taxes
- −$1,920
- − Insurance
- −$1,975
- − Repairs & maintenance
- −$3,722
- − Management
- −$3,722
- − Depreciation
- −$11,491
- Taxable income
- $1,574
- Est. tax owed @ 24.0%
- −$378
- After-tax cash flow
- $7,630/yr
For passive investors: Depreciation is non-cash, so a rental often shows a tax loss while cash-flowing — sheltering income. Rental losses are passive: they offset passive income freely, and up to $25,000/yr can offset ordinary (W-2) income if you actively participate and your MAGI is under $100k (phasing out to $0 by $150k); unused losses carry forward. On sale, claimed depreciation is recaptured at up to 25%, and gains may owe capital-gains tax (a 1031 exchange can defer both). Figures are a year-1 estimate at your 24.0% rate — not tax advice; consult a CPA.
Schools (NCES district)
- District
- Houston ISD
- NCES district ID
- 4823640
- Math proficiency
- 27% ▼ -18.00%
- Reading proficiency
- 35% ▼ -6.00%
- Median HH income
- $46,054
- Composite
- 26.63/100
- National rank
- #7173
- State rank
- #593 of 826 in TX
Livability — Houston
- Score
- 74/100
- State rank
- #184
- US rank
- #4771
Category grades
Schools grade is shown separately in the Schools card above.
Census & demographics
- Census place
- Houston, TX
- County
- Harris County · 4,702,590 people
- City population
- 3,226,434
- Metro
- Houston-The Woodlands-Sugar Land, TX
- Population (ZIP)
- 26,153
- Household income
- $45,574
- Rent vs Own
- Severe rent burden
- 2532.0
Population outlook (Harris County) Hauer SSP2
- Today (2025)
- 5,571,493 people
- By 2030
- 6,089,821 · +9.3%
- By 2040
- 7,142,806 · +28.2%
- By 2050
- 8,185,864 · +46.9%
- By 2075
- 10,574,329 · +89.8%
- By 2100
- 12,109,958 · +117.4%
Race, ethnicity, and origin ACS 2023
- Neighborhood character
- Diverse neighborhood (Simpson 0.55)
- Race & ethnicity
- Black 62% Hispanic / Latino 22% Two or more races 12% White 10% Asian 2%
- Hispanic origin (detail)
- Mexican 15%
- Common ancestry
- Italian 1% Romanian 1% Lithuanian 1%
- Foreign-born
- 11% · Canada
- Languages at home
- 77% English-only · Spanish 19% French/Haitian/Cajun 1% Other Indo-European 1%
Political lean MEDSL · Harris
- 2024 margin
- Lean D (+5.5) · D 52.0% · R 46.4% · Other 1.6%
- 2008→2024 swing
- +3.9pp toward D · 2008: 1.6pp · 2024: 5.5pp
- All cycles
- 2024: D+5.5 2020: D+13.3 2016: D+12.4 2012: D+0.1 2008: D+1.6
Not yet ingested
- Civics
- —
Market trends
- HPI YoY
- ▼ -71.22%
- Current HPI
- 230.2869
- Rent YoY
- ▲ 2.17%
- Metro
- Houston-The Woodlands-Sugar Land, TX
- State GDP YoY
- ▲ 3.95%
- F500 in state
- 110
Industry mix (Fortune 500 HQ in TX)
| Industry | F500 HQs | Revenue |
|---|---|---|
| Energy | 16 | $1,198B |
|
||
| Technology | 5 | $198B |
|
||
| Engineering / Construction | 4 | $72B |
|
||
| Energy Services | 3 | $60B |
|
||
| Utilities | 3 | $41B |
|
||
| Healthcare | 2 | $330B |
|
||
Price history
+58.0% since first listed5 events — show timeline
- 2026-05-29 Listed $395,000 HARMLS
- 2018-12-03 Sold (MLS) — HARMLS
- 2018-11-27 Listed $520,000 HARMLS
- 2018-11-23 Listing Removed — HARMLS
- 2018-05-21 Listed $250,000 HARMLS
Property tax history
+1.7%/yrLatest (2025): $1,920 · -11.7% YoY. Source: county tax records.
Cash-flow waterfall
monthlySold comps — $/sqft
last 12 mo · ≤1 miLoading sold comps…