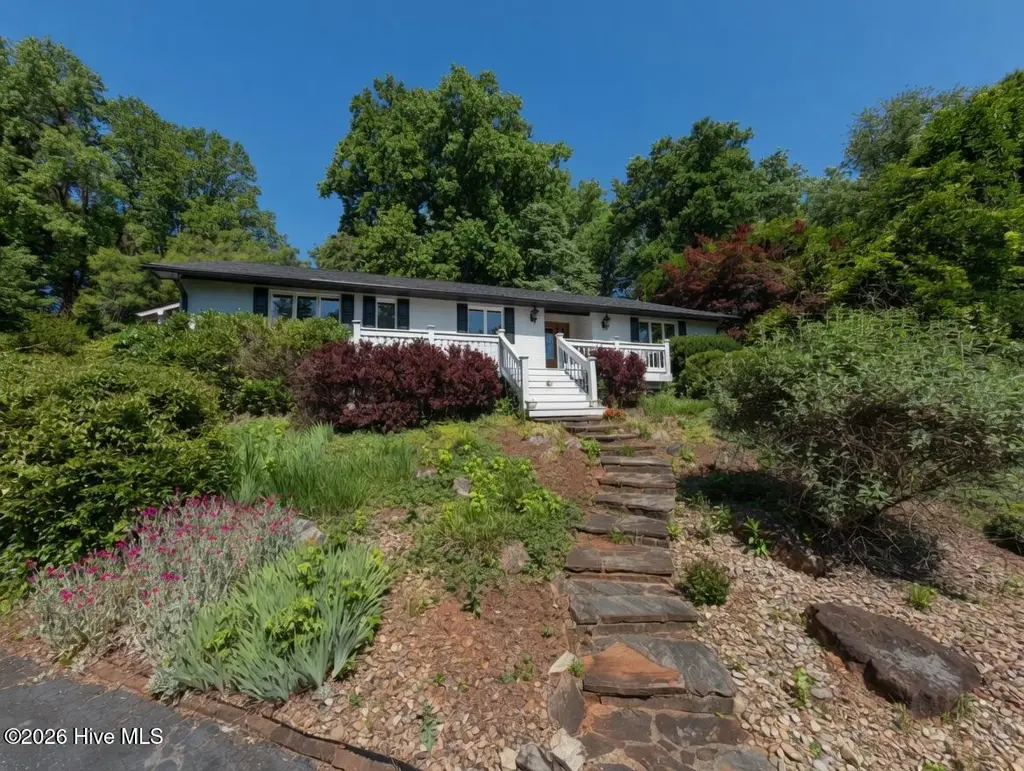
334 Case St · Columbus, NC
Flood risk 1/10 · Minimal
- FEMA flood zone
- X (unshaded)
- Chance of flooding over 30 yrs
- 0.0%
- Est. flood insurance / yr
- $507 – $1,088
Fire risk 3/10 · Minor
- Est. fire insurance / yr
- $906 – $1,684
Heat risk 5/10 · Moderate
- Hot days now (above 105°F)
- 7 days/yr
- Hot days in 30 yrs
- 17 days/yr
Wind risk 2/10 · Minimal
- Chance of severe wind over 30 yrs
- —
Air-quality risk 4/10 · Minor
- Unhealthy air days now
- 4 days/yr
- Unhealthy air days in 30 yrs
- 4 days/yr
Risk factors via First Street. Map © Google.
Why this score? — see what drove the D+ grade
The composite is a weighted blend of 9 inputs, each scored 0–100. Each bar is that input's sub-score; the figure is the points it added to the 100-point composite (weight × sub-score).
- ARV discount +15.0/15.0
- Appreciation +10.0/10.0
- Cash flow +6.6/30.0
- Schools +5.1/10.0
- Livability +3.7/5.0
- Rent growth +2.5/5.0
- Condition / age +2.5/5.0
- 1% rule +0.9/10.0
- DSCR +0.9/10.0
$389,900
🖨 Deal sheet 📄 Offer letter ✓ Due diligence
Listing remarks
Move-in ready and beautifully updated, this 3 bedroom, 3 bath brick ranch offers easy single-level living in one of Columbus's most charming, established neighborhoods on a spacious three-quarter acre lot. Recent renovations include refreshed bathrooms throughout, newer flooring, and updated systems, giving you modern comfort with classic curb appeal. Inside, you'll love the vaulted great room with exposed beams and a cozy wood-burning fireplace, an eat-in kitchen plus formal dining room, and two sets of patio doors that invite you out to the private backyard for seamless indoor-outdoor living. A 2-car detached garage provides excellent storage or workshop potential, and the level yard offe
Key facts
- Formal dining room
- Vaulted great room
- Refreshed bathrooms
Tags
Property features AI
Exterior
- Parking: Detached garage that faces the front; 2 garage spaces (detached); Additional on-site parking; Gravel parking; Garage door opener; On-site storage
- Utilities: Public water; Public sewer; Water and sewer connected
- Home design: Single-family residence; One story; Entry level: 1
- Construction: Built with block, brick veneer and frame construction; Shingle roof
- Exterior features: Deck; Patio; Landscaped yard; Storage building; Workshop; Has a view
Interior
- Kitchen: Electric cooktop; Electric range; Microwave; Dishwasher
- Bedrooms: Primary bedroom on the main level
- Flooring: Carpet; Wood
- Bathrooms: Three full bathrooms; Accessible full bathroom
- Heating & cooling: Electric heating; Heat pump; Central air conditioning
- Interior features: Main-level primary suite; Walk-in closets; Vaulted and high ceilings; Built-in bookcases; Ceiling fans
- Laundry & utility: Crawl-space foundation
Neighborhood map
What this means for you Summary
Snapshot
- This is a 3-bed/3.0-bath single-family listed at $390k.
Deal economics
- At list price, monthly cash flow is $-637 ($-8k/yr) — negative.
- To cash-flow at today's rent, offer at most $277k (28.9% below list).
- To meet the 1% rule (rent ≥ 1% of price), the offer needs to be $230k (41.0% below list).
- Recommended offer: $230k (41.0% below list) — sets the bar for 1% rule.
- Cap rate 4.3% vs local median 3.2% in Columbus — top-decile yield for the area; either an underpriced asset or a hidden risk that comps aren't pricing in. Stress-test before assuming the spread holds.
Location & tenants
- Location reads 74/100 on livability (#53 in NC, #4,439 nationally) — a middle-class / working-renter tenant base. Strengths: crime A+, cost of living A+, health & safety A+; Watch: employment D+, amenities F, commute F.
- Polk County Schools (rural): math 58% / reading 62% proficiency, ranked #32 of 178 in NC (top 18%) — acceptable for families but not a draw, mixed tenant base, ~2y average lease.
- Zoned schools: Tryon Elementary School (math 67% / reading 62%, grade B, #147 of 1,410 statewide, top 11%, 407 students, 99% FRL); Polk County Middle School (math 46% / reading 59%, grade C+, #94 of 475 statewide, top 20%, 475 students, 56% FRL); Polk County High School (math 72% / reading 67%, grade B, #121 of 535 statewide, top 24%, 579 students, 52% FRL) — zoned schools average 69% FRL vs 50% district-wide (19 pts higher); higher-poverty schools than district average — tighter screening recommended.
- Market conditions: 129 active listings in the ZIP; 1 comparable units currently listed for rent nearby; 143 units permitted in Polk County in 2024 (0 in 5+ unit buildings).
Forward outlook
- In year one you build about $42k of equity ($3k loan paydown + $39k appreciation (10.0% local appreciation)).
- Polk County population projected at -12% by 2050 — secular population decline; favor cash flow + early exit over multi-decade hold.
- By year 2, paydown + projected appreciation supports a ~$67k cash-out refi (75% LTV) — recoverable capital for the next deal without selling this one.
Negotiation context
- It's been on market 18 days — a 2% lower offer ($384k) is reasonable based on typical stale-listing flexibility.
- 6 sale attempts since 4y ago; this cycle's ask has dropped $25k (6%) from the opening price — seller is motivated, your offer sets the floor, not the list.
- Current owner paid $320k; 22% above their basis — modest negotiation headroom, anchor on the comps not their cost.
Risks & watch-outs
- Climate carrying-cost: extreme-heat days projected 7→17/yr by 2055 (HVAC capex compounding) — expect insurance premiums to compound above CPI over the hold.
Questions for the listing agent
- What do current leases actually rent for vs. the listed asking? Can we see a recent rent roll and the last 12 months of T-12 income?
- Built in 1978 — when were the roof, HVAC, electrical panel, plumbing, and water heater last replaced?
- Is there a deadline driving the sale (1031 exchange, divorce, estate, relocation)? That informs how much negotiation room exists.
- Schools are D-rated, which usually means shorter tenancies and higher turnover. Who's the typical renter profile here, and what's been the actual vacancy rate?
- The area grade is low — what's the realistic commute time and amenity access for the typical tenant pool here? Any planned neighborhood developments (good or bad) we should know about?
- What's the average days-on-market for RENTAL listings here right now (not sales)? A rising rental-DOM trend means longer vacancies and softer asking-rent achievability than the comps imply.
- What's the recent tenant-quality profile in this submarket — average credit score on applications, eviction rate, late-payment / NSF rate, and stable-employment percentage? A property-management company in the area should have these aggregated.
- How much new for-sale + rental construction is in the pipeline within 1–3 miles? Heavy new supply typically softens prices + rents 12–24 months out; constrained supply supports both.
Investment metrics
- 1% rule
- 0.59% ✗
- Cap rate
- 4.33%
- Cash-on-cash
- -7.01%
- DSCR
- 0.69
- GRM
- 14.1
CMA / ARV
- ARV (on-the-fly)
- $576,621
- Comps found
- 3
Show comp detail 3 sales within ~0.75 mi
| Address | Dist | Beds/Ba | Sqft | Sold | Price | $/sf | Match |
|---|---|---|---|---|---|---|---|
| 59 Barber St | 0.46mi | 3/2.5 | 2,401 (-1%) | 15mo | $315,000 | $131 | 62 |
| 106 Mallard Dr | 0.49mi | 3/3.0 | 2,785 (+14%) | 23mo | $660,000 | $237 | 34 |
| 565 Mountain Laurel Dr | 0.75mi | 3/2.0 | 2,118 (-13%) | 22mo | $525,000 | $248 | 22 |
Match score weights: distance 35% · size 25% · config 20% · recency 20%. Top-matched comps best support the ARV.
Projected returns pro-forma
10.0% appreciation · 3.0% rent growth · sell at horizon
- IRR
- 19.3%
- Equity multiple
- 2.57×
- Total profit
- $171,647
- Equity at exit
- $351,253
- IRR
- 17.8%
- Equity multiple
- 5.92×
- Total profit
- $537,167
- Equity at exit
- $757,490
Cash invested: $109,172 (down + closing). Projections, not guarantees.
Landlord ↔ Tenant lean methodology
- Overall (STATE)
- 85 Strongly Landlord-Friendly
- State North Carolina
- 85 Strongly Landlord-Friendly · R+3
- County
- — inherits STATE
- City
- — inherits STATE
ZIP-level market 28722
- Home prices YoY
- 9.0%
- Active inventory
- 129
- Price-to-rent
- 14.1×
Monthly cashflow live
- Estimated rent
- $2,300 medium interval (Pro) →
- Mortgage (P&I)
- −$2,045
- Tax from tax record
- −$247 /mo · $2,966/yr
- Insurance
- −$162
- HOA
- −$0
- Vacancy / Maint / Mgmt
- −$483
- Net cashflow
- $-637
Break-even live
UW: 25.0% down · 7.5% · 30yr · 1.5% tax · 5.0% vac · 8.0% maint · 8.0% mgmt
Financing live
Cash to close
- Down payment
- $97,475
- Closing costs
- $11,697
- Reserves months
- —
- Total cash needed
- —
Loan-product check · same deal, 3 products live
Conventional
25% down · 7.5% · 30yr
- Down + closing
- —
- Monthly P&I
- —
- Monthly cashflow
- —
- DSCR
- —
- Eligible?
- —
Personal DTI + credit; lowest rate.
DSCR
20% down · 8.5% · 30yr
- Down + closing
- —
- Monthly P&I
- —
- Monthly cashflow
- —
- DSCR
- —
- Eligible?
- —
No personal income docs; deal must DSCR.
Hard money
10% down · 12.0% · 12mo
- Down + closing
- —
- Monthly P&I
- —
- Monthly cashflow
- —
- DSCR
- —
- Eligible?
- —
Short-term bridge; refi at stabilization.
Rent comps 1 comps
| Address | Beds | Baths | Sqft | Rent | $/sqft | DOM | Units | Dist |
|---|---|---|---|---|---|---|---|---|
| 84 Whispering Wind Ln Columbus, NC | 3.0 | 2.0 | 2050 | $2,300 | $1.12 | 11d | 1 | 0.63mi |
Listing history 14 events
-
2026-06-18days on market $389,900 Active 18 DOM
-
2026-06-18price $389,900 Active 17 DOM
-
2026-06-17days on market $399,900 Active 17 DOM
-
2026-06-16days on market $399,900 Active 16 DOM
-
2026-06-15days on market $399,900 Active 15 DOM
-
2026-06-14pricedays on market $399,900 Active 13 DOM
-
2026-06-10days on market $415,000 Active 10 DOM
-
2026-06-09days on market $415,000 Active 9 DOM
-
2026-06-08days on market $415,000 Active 8 DOM
-
2026-06-07days on market $415,000 Active 7 DOM
-
2026-06-03days on market $415,000 Active 3 DOM
-
2026-06-02days on market $415,000 Active 2 DOM
-
2026-06-01remarks 699-char remark
-
2026-06-01$415,000 Active 1 DOM
ⓘ Source: listings_history table (triggers on properties + properties_extension) + one-shot
backfill from property_details.listing_events for pre-trigger history.
Tax reassessment forecast NC · Resets to sale price
- Current annual tax
- $2,966 · $247/mo
- Projected year-2 tax
- $3,197 · $266/mo
- Expected delta
- +$231/yr (+$19/mo · 7.8%)
ⓘ Screening estimate from a state-policy table — verify with the county assessor before closing.
Climate risk First Street
- Flood 1/10 Low FEMA zone X (unshaded) · 0% chance over 30 yrs
- Wildfire 3/10 Moderate
- Heat 5/10 Major 7 d/yr ≥105°F today · 17 d/yr by 30 yrs out
- Wind 2/10 Low
- Air quality 4/10 Moderate 4 unhealthy d/yr today · 4 by 30 yrs out
Nearby sold comps map
Loading sold comps map…
Walkable amenities ~0.75 mi
Loading nearby amenities…
Taxation est. · year 1
- Rental income
- $27,600
- − Mortgage interest
- −$21,840
- − Property taxes
- −$2,966
- − Insurance
- −$1,950
- − Repairs & maintenance
- −$2,208
- − Management
- −$2,208
- − Depreciation
- −$11,343
- Taxable loss
- −$14,914
- Est. tax savings @ 24.0%
- +$3,579
- After-tax cash flow
- $-4,068/yr
For passive investors: Depreciation is non-cash, so a rental often shows a tax loss while cash-flowing — sheltering income. Rental losses are passive: they offset passive income freely, and up to $25,000/yr can offset ordinary (W-2) income if you actively participate and your MAGI is under $100k (phasing out to $0 by $150k); unused losses carry forward. On sale, claimed depreciation is recaptured at up to 25%, and gains may owe capital-gains tax (a 1031 exchange can defer both). Figures are a year-1 estimate at your 24.0% rate — not tax advice; consult a CPA.
Schools (NCES district)
- District
- Polk County Schools
- NCES district ID
- 3703720
- Math proficiency
- 58% ▬ 0.00%
- Reading proficiency
- 62% ▬ 0.00%
- Median HH income
- $44,641
- Composite
- 50.56/100
- National rank
- #1847
- State rank
- #32 of 178 in NC
Livability — Columbus
- Score
- 74/100
- State rank
- #53
- US rank
- #4439
Category grades
Schools grade is shown separately in the Schools card above.
Census & demographics
- Census place
- Columbus, NC
- Population (ZIP)
- 5,998
Population outlook (Polk County) Hauer SSP2
- Today (2025)
- 20,043 people
- By 2030
- 19,764 · -1.4%
- By 2040
- 18,836 · -6.0%
- By 2050
- 17,529 · -12.5%
- By 2075
- 14,741 · -26.5%
- By 2100
- 11,461 · -42.8%
Race, ethnicity, and origin ACS 2023
- Neighborhood character
- Predominantly White (91%)
- Race & ethnicity
- White 91% Two or more races 4% Hispanic / Latino 4% Black 3%
- Common ancestry
- Iranian 4% Slovak 4% Italian 4%
- Foreign-born
- 4% · Canada
- Languages at home
- 93% English-only · German/W. Germanic 3% Spanish 3%
Political lean MEDSL · Polk
- 2024 margin
- Strong R (+25.2) · D 37.0% · R 62.2%
- 2008→2024 swing
- -10.1pp toward R · 2008: -15.1pp · 2024: -25.2pp
- All cycles
- 2024: R+25.2 2020: R+25.7 2016: R+28.2 2012: R+21.5 2008: R+15.1
Not yet ingested
- Civics
- —
Market trends
- HPI YoY
- ▲ 27.76%
- Current HPI
- 336.4252
- Rent YoY
- —
- Metro
- —
- State GDP YoY
- ▲ 3.28%
- F500 in state
- 26
Industry mix (Fortune 500 HQ in NC)
| Industry | F500 HQs | Revenue |
|---|---|---|
| Financial Services | 2 | $213B |
|
||
| Retail | 2 | $95B |
|
||
| Industrial Conglomerate | 1 | $38B |
|
||
| Metals / Steel | 1 | $35B |
|
||
| Utilities | 1 | $30B |
|
||
| Industrial Machinery | 1 | $19B |
|
||
Price history
+33.9% since first listed15 events — show timeline
- 2026-06-01 Listed $415,000 Hive MLS
- 2026-03-23 Price Changed $420,000 CANOPYMLS as Distributed by MLS Grid
- 2025-12-16 Price Changed $435,000 CANOPYMLS as Distributed by MLS Grid
- 2025-10-20 Listed $450,000 CANOPYMLS as Distributed by MLS Grid
- 2022-11-03 Price Changed $450,000 CANOPYMLS as Distributed by MLS Grid
- 2022-10-28 Relisted — CANOPYMLS as Distributed by MLS Grid
- 2022-10-28 Price Changed $459,000 CANOPYMLS as Distributed by MLS Grid
- 2022-10-07 Price Changed $485,000 CANOPYMLS as Distributed by MLS Grid
- 2022-09-20 Price Changed $499,900 CANOPYMLS as Distributed by MLS Grid
- 2022-09-09 Listed $525,000 CANOPYMLS as Distributed by MLS Grid
- 2022-07-01 Sold (MLS) $320,000 CANOPYMLS as Distributed by MLS Grid
- 2022-04-14 Pending — CANOPYMLS as Distributed by MLS Grid
- 2022-04-12 Relisted — CANOPYMLS as Distributed by MLS Grid
- 2022-03-18 Contingent — CANOPYMLS as Distributed by MLS Grid
- 2022-03-10 Listed $310,000 CANOPYMLS as Distributed by MLS Grid
Property tax history
+4.2%/yrLatest (2025): $2,966 · +12.9% YoY. Source: county tax records.
Cash-flow waterfall
monthlySold comps — $/sqft
last 12 mo · ≤1 miLoading sold comps…