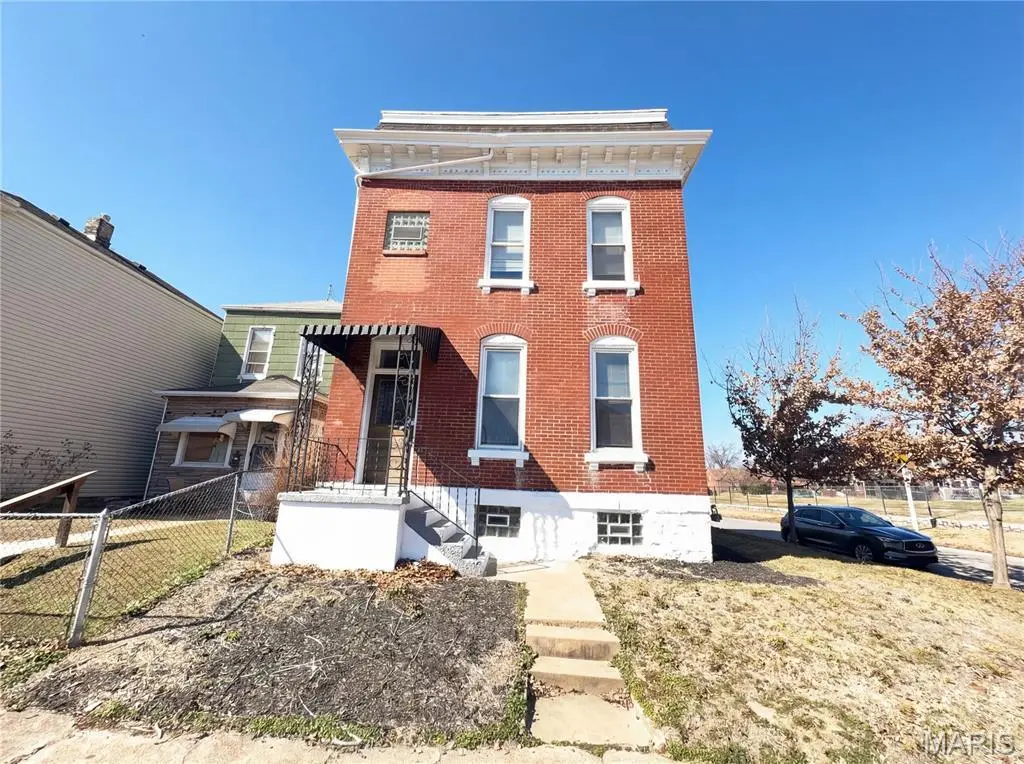
7101 Virginia Ave · St. Louis, MO
Flood risk 4/10 · Minor
- FEMA flood zone
- X (unshaded)
- Chance of flooding over 30 yrs
- 0.22%
- Est. flood insurance / yr
- $473 – $860
Fire risk 1/10 · Minimal
- Est. fire insurance / yr
- $1,054 – $1,958
Heat risk 5/10 · Moderate
- Hot days now (above 109°F)
- 7 days/yr
- Hot days in 30 yrs
- 21 days/yr
Wind risk 2/10 · Minimal
- Chance of severe wind over 30 yrs
- 1.0%
Air-quality risk 3/10 · Minor
- Unhealthy air days now
- 3 days/yr
- Unhealthy air days in 30 yrs
- 4 days/yr
Risk factors via First Street. Map © Google.
Why this score? — see what drove the D+ grade
The composite is a weighted blend of 9 inputs, each scored 0–100. Each bar is that input's sub-score; the figure is the points it added to the 100-point composite (weight × sub-score).
- Cash flow +17.6/30.0
- ARV discount +9.0/15.0
- DSCR +5.5/10.0
- 1% rule +3.7/10.0
- Rent growth +3.3/5.0
- Livability +2.5/5.0
- Condition / age +2.5/5.0
- Schools +1.2/10.0
- Appreciation +0.0/10.0
$166,000
🖨 Deal sheet (PDF) 📄 Offer letter ✓ Due diligence
Listing remarks MLS
Welcome to 7101 Virginia Ave, a property that exudes elegance and comfort. The kitchen is a chef's dream, boasting all stainless steel appliances that gleam under the soft lighting. The living room is a cozy retreat, featuring a beautiful fireplace that adds warmth and charm to the space. Step outside to the patio, a perfect spot for relaxation or entertaining, gives protection from the elements while still allowing you to enjoy the outdoors. This property is a perfect blend of style and functionality, making it a must-see for anyone seeking a new home. Don't miss out on this unique opportunity to own a piece of tranquility. Included 100-Day Home Warranty with buyer activation
Key facts
- Beautiful fireplace
- Covered patio
- 3,990 sq ft lot
Tags
Neighborhood map
What this means for you Summary
Snapshot
- This is a 3-bed/1.0-bath single-family listed at $166k.
Deal economics
- At list price, monthly cash flow is $130 ($2k/yr) — positive.
- The deal already cash-flows at list — no discount required.
- To meet the 1% rule (rent ≥ 1% of price), the offer needs to be $145k (12.9% below list).
- Recommended offer: $145k (12.9% below list) — sets the bar for 1% rule.
- Cap rate 7.2% vs local median 5.0% in St. Louis — top-decile yield for the area; either an underpriced asset or a hidden risk that comps aren't pricing in. Stress-test before assuming the spread holds.
Location & tenants
- Location reads: area grade D — affects rentability + tenant quality, not the cash-flow math above.
- St. Louis City (urban): math 10% / reading 18% proficiency, ranked #312 of 324 in MO (top 96%) — low school quality limits family demand, transient renter base, plan for 1-2y turnover; 80% free/reduced lunch — lower-income household profile, screen leases tightly.
- Zoned schools: Woerner Elem. (math 8% / reading 17%, grade F, #1,007 of 1,115 statewide, top 91%, 362 students, 99% FRL); Gateway Middle (math 0% / reading 8%, grade F, #389 of 391 statewide, top 100%, 506 students, 99% FRL); Roosevelt High (math 2% / reading 8%, grade F, #517 of 521 statewide, top 100%, 460 students, 99% FRL) — zoned schools average 99% FRL vs 80% district-wide (19 pts higher); higher-poverty schools than district average — tighter screening recommended.
- Market conditions: Rents rising (+3.3%/yr); 125 active listings in the ZIP; 10 comparable units currently listed for rent nearby; rentals leasing fast (median 4d on market — plan ~1-2 weeks tenant-placement turnaround); 294 units permitted in St. Louis city in 2024 (227 in 5+ unit buildings).
- This rent runs 37% of the median local income ($47k/yr) — at the standard rent-burdened threshold; future hikes will face affordability resistance.
Forward outlook
- Local home prices are declining (-3.0%/yr); year-one equity from $1k of loan paydown is wiped out by about $5k of value loss. Plan a longer hold.
- St. Louis County population projected to shrink 6% by 2050 — rents likely to lag national; underwrite the cash flow, not the appreciation.
Negotiation context
- It's been on market 114 days — a 9% lower offer ($151k) is reasonable based on typical stale-listing flexibility.
- 2 sale attempts; this cycle's ask has dropped $30k (15%) from the opening price — seller is motivated, your offer sets the floor, not the list.
- Current owner paid $40k; list at $166k implies a 315% gain — meaningful room to come down on a strong offer.
Risks & watch-outs
- Watch-outs: built in 1890 — expect roof / HVAC / electrical / plumbing capex.
- Climate carrying-cost: extreme-heat days projected 7→21/yr by 2055 (HVAC capex compounding) — expect insurance premiums to compound above CPI over the hold.
Questions for the listing agent
- It's been on market 114 days. Have you received any prior offers? Is the seller open to a 13% concession, seller financing, or rate buy-down credit?
- Built in 1890 — when were the roof, HVAC, electrical panel, plumbing, and water heater last replaced?
- Why hasn't it sold? Are there any deal-killer items the seller is aware of (foundation, flood, title, zoning, code violations)?
- Is there a deadline driving the sale (1031 exchange, divorce, estate, relocation)? That informs how much negotiation room exists.
- The area grade is low — what's the realistic commute time and amenity access for the typical tenant pool here? Any planned neighborhood developments (good or bad) we should know about?
- What's the average days-on-market for RENTAL listings here right now (not sales)? A rising rental-DOM trend means longer vacancies and softer asking-rent achievability than the comps imply.
- What's the recent tenant-quality profile in this submarket — average credit score on applications, eviction rate, late-payment / NSF rate, and stable-employment percentage? A property-management company in the area should have these aggregated.
- How much new for-sale + rental construction is in the pipeline within 1–3 miles? Heavy new supply typically softens prices + rents 12–24 months out; constrained supply supports both.
Investment metrics
- 1% rule
- 0.87% ✗
- Cap rate
- 7.23%
- Cash-on-cash
- 3.36%
- DSCR
- 1.15
- GRM
- 9.6
CMA / ARV
- ARV (median comp)
- $171,562
- List price
- $166,000
- Delta
- -3.24%
- Verdict
- FAIR
- Comps
- 20 within 1.0 mi
Show comp detail 12 sales within ~0.75 mi
| Address | Dist | Beds/Ba | Sqft | Sold | Price | $/sf | Match |
|---|---|---|---|---|---|---|---|
| 7226 Virginia Ave | 0.13mi | 3/1.5 | 1,860 (+4%) | 5mo | $64,900 | $35 | 81 |
| 7223 Pennsylvania Ave | 0.23mi | 3/2.0 | 1,856 (+4%) | 8mo | $44,900 | $24 | 72 |
| 7505 Pennsylvania Ave | 0.34mi | 4/1.5 (+1) | 1,788 (-0%) | 7mo | $135,000 | $76 | 71 |
| 7027 Michigan Ave | 0.06mi | 4/2.5 (+1) | 2,000 (+12%) | 6mo | $104,900 | $52 | 61 |
| 7721 Michigan Ave | 0.45mi | 3/2.0 | 1,658 (-7%) | 3mo | $169,900 | $102 | 60 |
| 122 W Courtois St | 0.53mi | 3/2.0 | 1,625 (-9%) | 3mo | $125,000 | $77 | 54 |
| 3651 Germania St | 0.67mi | 3/1.0 | 1,894 (+6%) | 7mo | $185,000 | $98 | 54 |
| 6321 Alaska Ave | 0.55mi | 3/2.0 | 1,613 (-10%) | 4mo | $235,000 | $146 | 51 |
| 3670 Loughborough Ave | 0.54mi | 3/1.5 | 1,979 (+11%) | 6mo | $300,000 | $152 | 50 |
| 6111 Idaho Ave | 0.66mi | 3/2.0 | 1,600 (-11%) | 4mo | $299,900 | $187 | 44 |
| 3674 Blow St | 0.55mi | 2/2.0 (-1) | 1,588 (-11%) | 7mo | $230,000 | $145 | 41 |
| 6169 Tennessee Ave | 0.66mi | 4/2.0 (+1) | 1,593 (-11%) | 7mo | $278,000 | $175 | 36 |
Match score weights: distance 35% · size 25% · config 20% · recency 20%. Top-matched comps best support the ARV.
Projected returns pro-forma
-3.0% appreciation · 3.27% rent growth · sell at horizon
- IRR
- -10.8%
- Equity multiple
- 0.61×
- Total profit
- $-18,290
- Equity at exit
- $24,751
- IRR
- -1.2%
- Equity multiple
- 0.92×
- Total profit
- $-3,894
- Equity at exit
- $14,353
Cash invested: $46,480 (down + closing). Projections, not guarantees.
Landlord ↔ Tenant lean methodology
- Overall (STATE)
- 81 Strongly Landlord-Friendly
- State Missouri
- 81 Strongly Landlord-Friendly · R+10
- County
- — inherits STATE
- City
- — inherits STATE
ZIP-level market 63111
- Rents YoY
- 3.3%
- Active inventory
- 125
- Price-to-rent
- 9.6×
Monthly cashflow live
- Estimated rent
- $1,445 high interval (Pro) →
- Mortgage (P&I)
- −$871
- Tax from tax record
- −$72 /mo · $865/yr
- Insurance
- −$69
- HOA
- −$0
- Vacancy / Maint / Mgmt
- −$303
- Net cashflow
- $130
Break-even live
Sensitivity live
| Price | -10% $224 | -5% $177 | +0% $130 | +5% $83 | +10% $36 |
|---|---|---|---|---|---|
| Rent | -10% $16 | -5% $73 | +0% $130 | +5% $187 | +10% $244 |
| Rate | -1.0pp $214 | -0.5pp $172 | base $130 | +0.5pp $87 | +1.0pp $43 |
UW: 25.0% down · 7.5% · 30yr · 1.5% tax · 5.0% vac · 8.0% maint · 8.0% mgmt
Financing live
Cash to close
- Down payment
- $41,500
- Closing costs
- $4,980
- Reserves months
- —
- Total cash needed
- —
Loan-product check · same deal, 3 products live
Conventional
25% down · 7.5% · 30yr
- Down + closing
- —
- Monthly P&I
- —
- Monthly cashflow
- —
- DSCR
- —
- Eligible?
- —
Personal DTI + credit; lowest rate.
DSCR
20% down · 8.5% · 30yr
- Down + closing
- —
- Monthly P&I
- —
- Monthly cashflow
- —
- DSCR
- —
- Eligible?
- —
No personal income docs; deal must DSCR.
Hard money
10% down · 12.0% · 12mo
- Down + closing
- —
- Monthly P&I
- —
- Monthly cashflow
- —
- DSCR
- —
- Eligible?
- —
Short-term bridge; refi at stabilization.
Rent comps 10 comps
| Address | Beds | Baths | Sqft | Rent | $/sqft | DOM | Units | Dist |
|---|---|---|---|---|---|---|---|---|
| 6915 Alabama Ave Unit 1st Floor St. Louis, MO | 2.0 | 1.0 | 1248 | $1,200 | $0.96 | 45d | 1 | 0.12mi |
| 6730 Vermont Ave Saint Louis, MO | 3.0 | 2.0 | 1534 | $1,600 | $1.04 | 16d | 1 | 0.17mi |
| 6800 Virginia Ave Unit 1 St. Louis, MO | 3.0 | 1.0 | 1500 | $1,475 | $0.98 | 19d | 1 | 0.19mi |
| 7417 Vermont Ave St. Louis, MO | 1.0–2.0 | 1.0–2.0 | 1144 | $1,600 | $1.40 | 0d | 8 | 0.25mi |
| 7924 Michigan Ave Unit 2F St. Louis, MO | 3.0 | 2.0 | 1250 | $1,195 | $0.96 | 4d | 1 | 0.60mi |
| 3857 Boulevard Heights Ct Saint Louis, MO | 3.0 | 2.5 | 1697 | $2,250 | $1.33 | 3d | 1 | 0.81mi |
| 4114 Alma Ave Saint Louis, MO | 3.0 | 1.5 | 1269 | $2,065 | $1.63 | 0d | 1 | 1.26mi |
| 4114 Alma Ave Saint Louis, MO | 3.0 | 1.5 | 1269 | $2,065 | $1.63 | 3d | 1 | 1.26mi |
| 4000 Schiller Pl Saint Louis, MO | 2.0 | 2.5 | 1448 | $1,600 | $1.10 | 0d | 1 | 1.45mi |
| 229 Horn Ave Saint Louis, MO | 2.0 | 1.5 | 1301 | $1,871 | $1.44 | 0d | 1 | 1.47mi |
Listing history 30 events
-
2026-06-21days on market $166,000 Active 114 DOM
-
2026-06-18days on market $166,000 Active 111 DOM
-
2026-06-17days on market $166,000 Active 110 DOM
-
2026-06-16days on market $166,000 Active 109 DOM
-
2026-06-15days on market $166,000 Active 108 DOM
-
2026-06-13days on market $166,000 Active 106 DOM
-
2026-06-09days on market $166,000 Active 102 DOM
-
2026-06-08days on market $166,000 Active 101 DOM
-
2026-06-08days on market $166,000 Active 100 DOM
-
2026-06-05pricedays on market $166,000 Active 97 DOM
-
2026-06-03days on market $170,000 Active 96 DOM
-
2026-06-02days on market $170,000 Active 95 DOM
-
2026-06-01days on market $170,000 Active 94 DOM
-
2026-05-31days on market $170,000 Active 93 DOM
-
2026-05-14price $170,000 685-char remark
Show marketing remark (685 chars)
Welcome to 7101 Virginia Ave, a property that exudes elegance and comfort. The kitchen is a chef's dream, boasting all stainless steel appliances that gleam under the soft lighting. The living room is a cozy retreat, featuring a beautiful fireplace that adds warmth and charm to the space. Step outside to the patio, a perfect spot for relaxation or entertaining, gives protection from the elements while still allowing you to enjoy the outdoors. This property is a perfect blend of style and functionality, making it a must-see for anyone seeking a new home. Don't miss out on this unique opportunity to own a piece of tranquility. Included 100-Day Home Warranty with buyer activation
-
2026-04-30price $178,000 685-char remark
Show marketing remark (685 chars)
Welcome to 7101 Virginia Ave, a property that exudes elegance and comfort. The kitchen is a chef's dream, boasting all stainless steel appliances that gleam under the soft lighting. The living room is a cozy retreat, featuring a beautiful fireplace that adds warmth and charm to the space. Step outside to the patio, a perfect spot for relaxation or entertaining, gives protection from the elements while still allowing you to enjoy the outdoors. This property is a perfect blend of style and functionality, making it a must-see for anyone seeking a new home. Don't miss out on this unique opportunity to own a piece of tranquility. Included 100-Day Home Warranty with buyer activation
-
2026-04-16price $184,000 685-char remark
Show marketing remark (685 chars)
Welcome to 7101 Virginia Ave, a property that exudes elegance and comfort. The kitchen is a chef's dream, boasting all stainless steel appliances that gleam under the soft lighting. The living room is a cozy retreat, featuring a beautiful fireplace that adds warmth and charm to the space. Step outside to the patio, a perfect spot for relaxation or entertaining, gives protection from the elements while still allowing you to enjoy the outdoors. This property is a perfect blend of style and functionality, making it a must-see for anyone seeking a new home. Don't miss out on this unique opportunity to own a piece of tranquility. Included 100-Day Home Warranty with buyer activation
-
2026-04-02price $190,000 685-char remark
Show marketing remark (685 chars)
Welcome to 7101 Virginia Ave, a property that exudes elegance and comfort. The kitchen is a chef's dream, boasting all stainless steel appliances that gleam under the soft lighting. The living room is a cozy retreat, featuring a beautiful fireplace that adds warmth and charm to the space. Step outside to the patio, a perfect spot for relaxation or entertaining, gives protection from the elements while still allowing you to enjoy the outdoors. This property is a perfect blend of style and functionality, making it a must-see for anyone seeking a new home. Don't miss out on this unique opportunity to own a piece of tranquility. Included 100-Day Home Warranty with buyer activation
-
2026-03-19price $193,000 685-char remark
Show marketing remark (685 chars)
Welcome to 7101 Virginia Ave, a property that exudes elegance and comfort. The kitchen is a chef's dream, boasting all stainless steel appliances that gleam under the soft lighting. The living room is a cozy retreat, featuring a beautiful fireplace that adds warmth and charm to the space. Step outside to the patio, a perfect spot for relaxation or entertaining, gives protection from the elements while still allowing you to enjoy the outdoors. This property is a perfect blend of style and functionality, making it a must-see for anyone seeking a new home. Don't miss out on this unique opportunity to own a piece of tranquility. Included 100-Day Home Warranty with buyer activation
-
2026-02-27$196,000 Active 685-char remark
Show marketing remark (685 chars)
Welcome to 7101 Virginia Ave, a property that exudes elegance and comfort. The kitchen is a chef's dream, boasting all stainless steel appliances that gleam under the soft lighting. The living room is a cozy retreat, featuring a beautiful fireplace that adds warmth and charm to the space. Step outside to the patio, a perfect spot for relaxation or entertaining, gives protection from the elements while still allowing you to enjoy the outdoors. This property is a perfect blend of style and functionality, making it a must-see for anyone seeking a new home. Don't miss out on this unique opportunity to own a piece of tranquility. Included 100-Day Home Warranty with buyer activation
-
2025-12-03price $200,000
-
2025-10-01price $175,000
-
2025-09-11price $199,900
-
2025-08-28price $209,900
-
2025-07-31price $214,900
-
2025-06-19$225,000 Active
-
2025-06-17historical
-
2024-12-04soldstatus $40,000
-
2016-01-04price $33,000
-
1994-12-09soldstatus
ⓘ Source: listings_history table (triggers on properties + properties_extension) + one-shot
backfill from property_details.listing_events for pre-trigger history.
Tax reassessment forecast MO · Resets to sale price
- Current annual tax
- $865 · $72/mo
- Projected year-2 tax
- $1,610 · $134/mo
- Expected delta
- +$746/yr (+$62/mo · 86.3%)
ⓘ Screening estimate from a state-policy table — verify with the county assessor before closing.
Climate risk First Street
- Flood 4/10 Moderate FEMA zone X (unshaded) · 22% chance over 30 yrs
- Wildfire 1/10 Low
- Heat 5/10 Major 7 d/yr ≥109°F today · 21 d/yr by 30 yrs out
- Wind 2/10 Low 100% chance of damaging wind over 30 yrs
- Air quality 3/10 Moderate 3 unhealthy d/yr today · 4 by 30 yrs out
Nearby sold comps map
Loading sold comps map…
Walkable amenities ~0.75 mi
Loading nearby amenities…
Taxation est. · year 1
- Rental income
- $17,342
- − Mortgage interest
- −$9,299
- − Property taxes
- −$865
- − Insurance
- −$830
- − Repairs & maintenance
- −$1,387
- − Management
- −$1,387
- − Depreciation
- −$4,829
- Taxable loss
- −$1,255
- Est. tax savings @ 24.0%
- +$301
- After-tax cash flow
- $1,861/yr
For passive investors: Depreciation is non-cash, so a rental often shows a tax loss while cash-flowing — sheltering income. Rental losses are passive: they offset passive income freely, and up to $25,000/yr can offset ordinary (W-2) income if you actively participate and your MAGI is under $100k (phasing out to $0 by $150k); unused losses carry forward. On sale, claimed depreciation is recaptured at up to 25%, and gains may owe capital-gains tax (a 1031 exchange can defer both). Figures are a year-1 estimate at your 24.0% rate — not tax advice; consult a CPA.
Schools (NCES district)
- District
- St. Louis City
- NCES district ID
- 2929280
- Math proficiency
- 10% ▼ -6.00%
- Reading proficiency
- 18% ▼ -3.00%
- Median HH income
- $35,685
- Composite
- 11.54/100
- National rank
- #9699
- State rank
- #312 of 324 in MO
Livability — St. Louis
No livability data for this city. (Only ~50 U.S. cities are tracked.)
Census & demographics
- Census place
- St. Louis, MO
- County
- Saint Louis City · 254,015 people
- City population
- 283,259
- Metro
- St. Louis, MO-IL
- Population (ZIP)
- 18,851
- Household income
- $47,039
- Rent vs Own
- Severe rent burden
- 1364.0
Population outlook (St. Louis County) Hauer SSP2
- Today (2025)
- 315,737 people
- By 2030
- 313,865 · -0.6%
- By 2040
- 305,439 · -3.3%
- By 2050
- 296,529 · -6.1%
- By 2075
- 271,028 · -14.2%
- By 2100
- 255,359 · -19.1%
Race, ethnicity, and origin ACS 2023
- Neighborhood character
- Diverse neighborhood (Simpson 0.65)
- Race & ethnicity
- Black 42% White 41% Two or more races 11% Hispanic / Latino 9% Asian 1%
- Hispanic origin (detail)
- Mexican 6%
- Common ancestry
- Lithuanian 3% Slovak 1% Romanian 1%
- Foreign-born
- 7% · Canada, India
- Languages at home
- 90% English-only · Spanish 7% Other Indo-European 1%
Political lean MEDSL · St. Louis
- 2024 margin
- Solid D (+64.7) · D 81.4% · R 16.7% · Other 2.0%
- 2008→2024 swing
- -3.5pp toward R · 2008: 68.2pp · 2024: 64.7pp
- All cycles
- 2024: D+64.7 2020: D+66.2 2016: D+63.7 2012: D+66.6 2008: D+68.2
Not yet ingested
- Civics
- —
Market trends
- HPI YoY
- ▼ -92.80%
- Current HPI
- 169.4644
- Rent YoY
- ▲ 3.27%
- Metro
- St. Louis, MO-IL
- State GDP YoY
- ▲ 1.84%
- F500 in state
- 20
Industry mix (Fortune 500 HQ in MO)
| Industry | F500 HQs | Revenue |
|---|---|---|
| Healthcare | 1 | $163B |
|
||
| Insurance | 1 | $21B |
|
||
| Industrial Technology | 1 | $17B |
|
||
| Retail | 1 | $16B |
|
||
| Industrial Distribution | 1 | $10B |
|
||
| Utilities | 1 | $9B |
|
||
Price history
+415.2% since first listed16 events — show timeline
- 2026-05-14 Price Changed $170,000 MARIS as Distributed by MLS Grid
- 2026-04-30 Price Changed $178,000 MARIS as Distributed by MLS Grid
- 2026-04-16 Price Changed $184,000 MARIS as Distributed by MLS Grid
- 2026-04-02 Price Changed $190,000 MARIS as Distributed by MLS Grid
- 2026-03-19 Price Changed $193,000 MARIS as Distributed by MLS Grid
- 2026-02-27 Listed $196,000 MARIS as Distributed by MLS Grid
- 2025-12-03 Price Changed $200,000 MARIS as Distributed by MLS Grid
- 2025-10-01 Price Changed $175,000 MARIS as Distributed by MLS Grid
- 2025-09-11 Price Changed $199,900 MARIS as Distributed by MLS Grid
- 2025-08-28 Price Changed $209,900 MARIS as Distributed by MLS Grid
- 2025-07-31 Price Changed $214,900 MARIS as Distributed by MLS Grid
- 2025-06-19 Listed $225,000 MARIS as Distributed by MLS Grid
- 2025-06-17 Coming Soon — MARIS as Distributed by MLS Grid
- 2024-12-04 Sold (Public Records) $40,000 Public Records
- 2016-01-04 Price Changed $33,000 MARIS as Distributed by MLS Grid
- 1994-12-09 Sold (Public Records) — Public Records
Property tax history
+2.0%/yrLatest (2023): $865 · +5.6% YoY. Source: county tax records.
Cash-flow waterfall
monthlySold comps — $/sqft
last 12 mo · ≤1 miLoading sold comps…