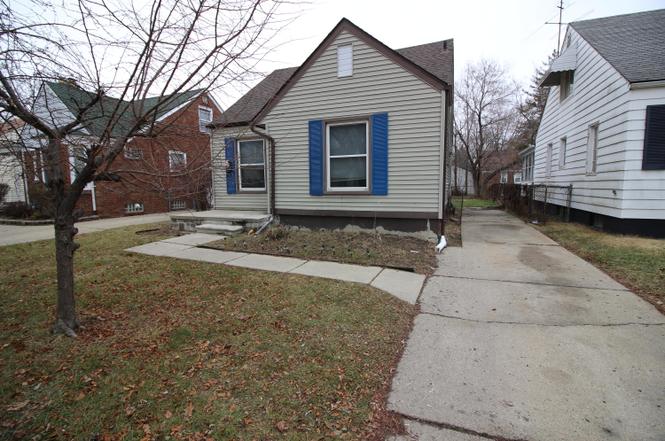
20253 Washtenaw St · Harper Woods, MI
Flood risk 1/10 · Minimal
- FEMA flood zone
- X (unshaded)
- Chance of flooding over 30 yrs
- 0.0%
- Est. flood insurance / yr
- $473 – $860
Fire risk 1/10 · Minimal
- Est. fire insurance / yr
- $784 – $1,456
Heat risk 3/10 · Minor
- Hot days now (above 96°F)
- 7 days/yr
- Hot days in 30 yrs
- 15 days/yr
Wind risk 2/10 · Minimal
- Chance of severe wind over 30 yrs
- —
Air-quality risk 3/10 · Minor
- Unhealthy air days now
- 3 days/yr
- Unhealthy air days in 30 yrs
- 4 days/yr
Risk factors via First Street. Map © Google.
Why this score? — see what drove the C+ grade
The composite is a weighted blend of 9 inputs, each scored 0–100. Each bar is that input's sub-score; the figure is the points it added to the 100-point composite (weight × sub-score).
- Cash flow +27.8/30.0
- DSCR +9.8/10.0
- 1% rule +7.6/10.0
- ARV discount +7.5/15.0
- Rent growth +3.8/5.0
- Livability +3.7/5.0
- Condition / age +2.5/5.0
- Schools +0.9/10.0
- Appreciation +0.0/10.0
$109,900
🖨 Deal sheet (PDF) 📄 Offer letter ✓ Due diligence
Listing remarks MLS
INVESTMENT PROPERTY! TENANT OCCUPIED HOME. This is a beautifully updated 3 bedroom, 1 bath Bungalow with a full basement, shed in the back completely updated kitchen.
Key facts
- Full basement
- Updated kitchen
- 4,792 sq ft lot
Tags
Property features AI
Exterior
- Utilities: Public water
- Home design: Single-family residence; Residential property
- Construction: Built in 1940; Vinyl siding; Shingle roof; Approximately 996 total building area
- Exterior features: Lot of about 0.11 acres; Public water
Interior
- Bathrooms: 1 full bathroom; 1 half bathroom
- Heating & cooling: Forced air heating
- Interior features: 6 total rooms; Full basement
Neighborhood map
What this means for you Summary
Snapshot
- This is a 3-bed/1.0-bath single-family listed at $110k.
Deal economics
- At list price, monthly cash flow is $334 ($4k/yr) — positive.
- The deal already cash-flows at list — no discount required.
- Meets the 1% rule at list price ($1k rent vs $110k).
- Recommended offer: $97k (12.0% below list) — sets the bar for market timing.
- Cap rate 9.9% vs local median 7.7% in Harper Woods — meaningfully above typical; check what's discounted (condition, days-on-market, listing class) to confirm the premium yield is real.
Location & tenants
- Location reads 73/100 on livability (#199 in MI) — a middle-class / working-renter tenant base. Strengths: commute A+, cost of living A+, housing A+; Watch: employment D+, health & safety D+, crime F.
- Harper Woods School District (suburban): math 4% / reading 15% proficiency, ranked #524 of 540 in MI (top 97%) — low school quality limits family demand, transient renter base, plan for 1-2y turnover; 69% free/reduced lunch — lower-income household profile, screen leases tightly.
- Zoned schools: Beacon Elementary School (338 students, 84% FRL); Harper Woods Middle School (math 4% / reading 19%, grade F, #469 of 493 statewide, top 95%, 313 students, 82% FRL).
- Market conditions: Rents rising fast (+5.1%/yr); 134 active listings in the ZIP; 40 comparable units currently listed for rent nearby; rentals at typical pace (median 19d on market — plan ~3-4 weeks tenant-placement turnaround); 2,639 units permitted in Wayne County in 2024 (1,216 in 5+ unit buildings).
Forward outlook
- Local home prices are declining (-3.0%/yr); year-one equity from $760 of loan paydown is wiped out by about $3k of value loss. Plan a longer hold.
- Wayne County population projected at -17% by 2050 — secular population decline; favor cash flow + early exit over multi-decade hold.
- At projected returns (-3.0% appreciation + 5.1% rent growth), your $31k cash investment doubles in ~8 years — after that, you're playing with house money.
Negotiation context
- It's been on market 568 days — a 12% lower offer ($97k) is reasonable based on typical stale-listing flexibility.
- 17 sale attempts since 31y ago with the ask held roughly flat each time — persistent listings suggest the price (not the market) is what's stuck; bring a comps-based counter.
- Current owner paid $875; list at $110k implies a 12460% gain — meaningful room to come down on a strong offer.
Risks & watch-outs
- Watch-outs: built in 1940 — expect roof / HVAC / electrical / plumbing capex.
Questions for the listing agent
- It's been on market 568 days. Have you received any prior offers? Is the seller open to a 12% concession, seller financing, or rate buy-down credit?
- Built in 1940 — when were the roof, HVAC, electrical panel, plumbing, and water heater last replaced?
- Why hasn't it sold? Are there any deal-killer items the seller is aware of (foundation, flood, title, zoning, code violations)?
- Is there a deadline driving the sale (1031 exchange, divorce, estate, relocation)? That informs how much negotiation room exists.
- Schools are D-rated, which usually means shorter tenancies and higher turnover. Who's the typical renter profile here, and what's been the actual vacancy rate?
- Crime grade is F in this area — have there been break-ins, vandalism, or insurance claims at this property in the last 3 years? What carrier currently insures it and at what premium?
- What's the average days-on-market for RENTAL listings here right now (not sales)? A rising rental-DOM trend means longer vacancies and softer asking-rent achievability than the comps imply.
- What's the recent tenant-quality profile in this submarket — average credit score on applications, eviction rate, late-payment / NSF rate, and stable-employment percentage? A property-management company in the area should have these aggregated.
- How much new for-sale + rental construction is in the pipeline within 1–3 miles? Heavy new supply typically softens prices + rents 12–24 months out; constrained supply supports both.
Investment metrics
- 1% rule
- 1.26% ✓
- Cap rate
- 9.94%
- Cash-on-cash
- 13.02%
- DSCR
- 1.58
- GRM
- 6.6
CMA / ARV
- ARV (on-the-fly)
- $62,288
- Comps found
- 12
Show comp detail 12 sales within ~0.75 mi
| Address | Dist | Beds/Ba | Sqft | Sold | Price | $/sf | Match |
|---|---|---|---|---|---|---|---|
| 20300 Mccormick St | 0.14mi | 3/1.0 | 940 (+3%) | 1mo | $60,000 | $64 | 88 |
| 20244 Mccormick St | 0.14mi | 3/1.0 | 1,000 (+9%) | 1mo | $75,000 | $75 | 77 |
| 10945 Peerless St | 0.35mi | 3/1.0 | 964 (+5%) | 2mo | $54,000 | $56 | 74 |
| 11017 Worden St | 0.39mi | 3/1.0 | 961 (+5%) | 0mo | $47,500 | $49 | 73 |
| 19974 Mccormick St | 0.21mi | 3/1.0 | 1,000 (+9%) | 4mo | $74,000 | $74 | 71 |
| 11035 Worden St | 0.37mi | 3/1.0 | 834 (-9%) | 3mo | $55,000 | $66 | 65 |
| 19381 Kenosha St | 0.52mi | 2/1.0 (-1) | 892 (-3%) | 2mo | $104,000 | $117 | 65 |
| 11640 Somerset Ave | 0.37mi | 3/2.0 | 1,028 (+12%) | 0mo | $70,000 | $68 | 58 |
| 11617 Nottingham Rd | 0.52mi | 3/1.0 | 1,002 (+9%) | 4mo | $52,000 | $52 | 57 |
| 19100 Kingsville St | 0.71mi | 3/1.0 | 972 (+6%) | 2mo | $110,000 | $113 | 55 |
| 12075 Rossiter St | 0.68mi | 3/1.0 | 851 (-7%) | 4mo | $45,000 | $53 | 53 |
| 11566 Somerset Ave | 0.42mi | 3/2.0 | 1,039 (+13%) | 3mo | $123,000 | $118 | 51 |
Match score weights: distance 35% · size 25% · config 20% · recency 20%. Top-matched comps best support the ARV.
Projected returns pro-forma
-3.0% appreciation · 5.1% rent growth · sell at horizon
- IRR
- 5.3%
- Equity multiple
- 1.21×
- Total profit
- $6,445
- Equity at exit
- $16,386
- IRR
- 16.5%
- Equity multiple
- 2.49×
- Total profit
- $45,810
- Equity at exit
- $9,502
Cash invested: $30,772 (down + closing). Projections, not guarantees.
Landlord ↔ Tenant lean methodology
- Overall (STATE)
- 62 Landlord-Friendly
- State Michigan
- 62 Landlord-Friendly · EVEN
- County
- — inherits STATE
- City
- — inherits STATE
ZIP-level market 48225
- Rents YoY
- 5.1%
- Active inventory
- 134
- Price-to-rent
- 6.6×
Monthly cashflow live
- Estimated rent
- $1,380 high interval (Pro) →
- Mortgage (P&I)
- −$576
- Tax from tax record
- −$134 /mo · $1,608/yr
- Insurance
- −$46
- HOA
- −$0
- Vacancy / Maint / Mgmt
- −$290
- Net cashflow
- $334
Break-even live
Sensitivity live
| Price | -10% $396 | -5% $365 | +0% $334 | +5% $303 | +10% $272 |
|---|---|---|---|---|---|
| Rent | -10% $225 | -5% $279 | +0% $334 | +5% $388 | +10% $443 |
| Rate | -1.0pp $389 | -0.5pp $362 | base $334 | +0.5pp $305 | +1.0pp $276 |
UW: 25.0% down · 7.5% · 30yr · 1.5% tax · 5.0% vac · 8.0% maint · 8.0% mgmt
Financing live
Cash to close
- Down payment
- $27,475
- Closing costs
- $3,297
- Reserves months
- —
- Total cash needed
- —
Loan-product check · same deal, 3 products live
Conventional
25% down · 7.5% · 30yr
- Down + closing
- —
- Monthly P&I
- —
- Monthly cashflow
- —
- DSCR
- —
- Eligible?
- —
Personal DTI + credit; lowest rate.
DSCR
20% down · 8.5% · 30yr
- Down + closing
- —
- Monthly P&I
- —
- Monthly cashflow
- —
- DSCR
- —
- Eligible?
- —
No personal income docs; deal must DSCR.
Hard money
10% down · 12.0% · 12mo
- Down + closing
- —
- Monthly P&I
- —
- Monthly cashflow
- —
- DSCR
- —
- Eligible?
- —
Short-term bridge; refi at stabilization.
Rent comps 40 comps
| Address | Beds | Baths | Sqft | Rent | $/sqft | DOM | Units | Dist |
|---|---|---|---|---|---|---|---|---|
| 20461 Kingsville St Harper Woods, MI | 4.0 | 1.0 | 1100 | $1,399 | $1.27 | 16d | 1 | 0.14mi |
| 19982 McCormick St Detroit, MI | 3.0 | 1.0 | 866 | $1,200 | $1.39 | 5d | 1 | 0.18mi |
| 10985 Peerless St Detroit, MI | 3.0 | 1.0 | 1000 | $1,364 | $1.36 | 6d | 1 | 0.28mi |
| 19661 Kenosha St Harper Woods, MI | 3.0 | 2.0 | 1000 | $1,400 | $1.40 | 26d | 1 | 0.35mi |
| 19639 Moross Rd Unit 1 Detroit, MI | 2.0 | 1.0 | 900 | $1,100 | $1.22 | 45d | 1 | 0.39mi |
| 10542 Lanark St Detroit, MI | 3.0 | 1.0 | 1023 | $1,250 | $1.22 | 45d | 1 | 0.44mi |
| 19442 Kingsville St Harper Woods, MI | 3.0 | 1.0 | 1000 | $1,500 | $1.50 | 19d | 1 | 0.46mi |
| 19203 Edgefield St Harper Woods, MI | 2.0 | 1.0 | 1100 | $1,100 | $1.00 | 26d | 1 | 0.49mi |
| 19365 Kingsville St Harper Woods, MI | 4.0 | 1.5 | 996 | $1,650 | $1.66 | 16d | 1 | 0.53mi |
| 10692 Meuse St Detroit, MI | 3.0 | 1.0 | 955 | $1,250 | $1.31 | 14d | 1 | 0.65mi |
| 17720 Chester St Detroit, MI | 2.0 | 1.0 | 986 | $1,250 | $1.27 | 45d | 1 | 0.65mi |
| 17710 Chester St Detroit, MI | 2.0 | 1.0 | 984 | $1,250 | $1.27 | 45d | 1 | 0.65mi |
| 12075 Rossiter St Detroit, MI | 3.0 | 1.0 | 1100 | $1,245 | $1.13 | 45d | 1 | 0.67mi |
| 12075 Rossiter St Detroit, MI | 3.0 | 1.0 | 1100 | $1,245 | $1.13 | 16d | 1 | 0.67mi |
| 19144 Moross Rd Detroit, MI | 2.0 | 1.0 | 900 | $1,050 | $1.17 | 45d | 1 | 0.70mi |
| 19152 Woodside St Harper Woods, MI | 3.0 | 1.0 | 916 | $1,500 | $1.64 | 19d | 1 | 0.70mi |
| 21401 Kingsville St Harper Woods, MI | 2.0 | 1.0 | 944 | $1,200 | $1.27 | 26d | 1 | 0.70mi |
| 6301 Lodewyck St Detroit, MI | 3.0 | 1.0 | 1084 | $1,300 | $1.20 | 14d | 1 | 0.73mi |
| 6301 Lodewyck St Detroit, MI | 3.0 | 1.0 | 1084 | $1,300 | $1.20 | 0d | 1 | 0.73mi |
| 11529 Roxbury St Detroit, MI | 2.0 | 1.0 | 720 | $1,200 | $1.67 | 14d | 1 | 0.74mi |
| 10370 Britain St Detroit, MI | 3.0 | 1.0 | 1100 | $1,100 | $1.00 | 45d | 1 | 0.76mi |
| 10400 Britain St Detroit, MI | 3.0 | 1.0 | 890 | $1,100 | $1.24 | 45d | 1 | 0.76mi |
| 6325 Neff Ave Detroit, MI | 3.0 | 1.0 | 1000 | $1,500 | $1.50 | 4d | 1 | 0.77mi |
| 11776 Rossiter St Detroit, MI | 3.0 | 1.0 | 964 | $1,150 | $1.19 | 13d | 1 | 0.78mi |
| 6175 Marseilles St Detroit, MI | 3.0 | 1.0 | 1100 | $1,100 | $1.00 | 45d | 1 | 0.79mi |
| 6181 Neff Ave Detroit, MI | 3.0 | 1.0 | 1102 | $1,299 | $1.18 | 19d | 1 | 0.83mi |
| 11611 Morang Ave Detroit, MI | 1.0–2.0 | 1.0 | 709 | $1,040 | $1.47 | 45d | 1 | 0.84mi |
| 6304 Bluehill St Detroit, MI | 3.0 | 1.0 | 1088 | $1,500 | $1.38 | 45d | 1 | 0.85mi |
| 10177 Boleyn St Detroit, MI | 3.0 | 1.0 | 767 | $1,250 | $1.63 | 45d | 1 | 0.90mi |
| 11235 Roxbury St Detroit, MI | 3.0 | 1.0 | 1062 | $1,325 | $1.25 | 19d | 1 | 0.94mi |
| 20015 Lochmoor St Harper Woods, MI | 3.0 | 1.0 | 1006 | $1,500 | $1.49 | 18d | 1 | 0.95mi |
| 10037 Grayton St Detroit, MI | 3.0 | 1.0 | 1000 | $1,400 | $1.40 | 5d | 1 | 0.95mi |
| 5915 Farmbrook St Detroit, MI | 3.0 | 1.5 | 1000 | $1,250 | $1.25 | 26d | 1 | 0.97mi |
| 12716 Riad St Detroit, MI | 3.0 | 1.0 | 974 | $1,275 | $1.31 | 19d | 1 | 1.01mi |
| 5955 Guilford St Detroit, MI | 3.0 | 1.0 | 802 | $1,400 | $1.75 | 19d | 1 | 1.01mi |
| 5786 Neff Ave Detroit, MI | 3.0 | 1.5 | 1100 | $1,225 | $1.11 | 18d | 1 | 1.05mi |
| 12201 Morang Ave Unit 8 Detroit, MI | 2.0 | 1.0 | 610 | $875 | $1.43 | 45d | 1 | 1.06mi |
| 16212 Maddelein St Detroit, MI | 2.0 | 1.0 | 800 | $1,200 | $1.50 | 14d | 1 | 1.14mi |
| 10404 Somerset Ave Detroit, MI | 3.0 | 1.0 | 1108 | $1,475 | $1.33 | 5d | 1 | 1.15mi |
| 22144 Moross Rd Grosse Pointe, MI | 2.0 | 1.0 | 819 | $1,350 | $1.65 | 4d | 1 | 1.21mi |
Listing history 50 events
-
2026-06-21days on market $109,900 Active 568 DOM
-
2026-06-18days on market $109,900 Active 565 DOM
-
2026-06-17days on market $109,900 Active 564 DOM
-
2026-06-16days on market $109,900 Active 563 DOM
-
2026-06-15days on market $109,900 Active 562 DOM
-
2026-06-13days on market $109,900 Active 560 DOM
-
2026-06-13days on market $109,900 Active 559 DOM
-
2026-06-09days on market $109,900 Active 556 DOM
-
2026-06-08days on market $109,900 Active 555 DOM
-
2026-06-07days on market $109,900 Active 554 DOM
-
2026-06-04days on market $109,900 Active 551 DOM
-
2026-06-03days on market $109,900 Active 550 DOM
-
2026-06-02days on market $109,900 Active 549 DOM
-
2026-06-01days on market $109,900 Active 548 DOM
-
2026-05-31days on market $109,900 Active 547 DOM
-
2025-11-19status Active 166-char remark
Show marketing remark (166 chars)
INVESTMENT PROPERTY! TENANT OCCUPIED HOME. This is a beautifully updated 3 bedroom, 1 bath Bungalow with a full basement, shed in the back completely updated kitchen.
-
2025-11-19status Active 166-char remark
Show marketing remark (166 chars)
INVESTMENT PROPERTY! TENANT OCCUPIED HOME. This is a beautifully updated 3 bedroom, 1 bath Bungalow with a full basement, shed in the back completely updated kitchen.
-
2025-11-19status Active
Show marketing remark (166 chars)
INVESTMENT PROPERTY! TENANT OCCUPIED HOME. This is a beautifully updated 3 bedroom, 1 bath Bungalow with a full basement, shed in the back completely updated kitchen.
-
2025-10-31status Pending 166-char remark
Show marketing remark (166 chars)
INVESTMENT PROPERTY! TENANT OCCUPIED HOME. This is a beautifully updated 3 bedroom, 1 bath Bungalow with a full basement, shed in the back completely updated kitchen.
-
2025-10-31status Pending 166-char remark
Show marketing remark (166 chars)
INVESTMENT PROPERTY! TENANT OCCUPIED HOME. This is a beautifully updated 3 bedroom, 1 bath Bungalow with a full basement, shed in the back completely updated kitchen.
-
2025-10-31status Pending
Show marketing remark (166 chars)
INVESTMENT PROPERTY! TENANT OCCUPIED HOME. This is a beautifully updated 3 bedroom, 1 bath Bungalow with a full basement, shed in the back completely updated kitchen.
-
2024-11-11$109,900 Active 166-char remark
Show marketing remark (166 chars)
INVESTMENT PROPERTY! TENANT OCCUPIED HOME. This is a beautifully updated 3 bedroom, 1 bath Bungalow with a full basement, shed in the back completely updated kitchen.
-
2024-11-11$109,900 Active 166-char remark
Show marketing remark (166 chars)
INVESTMENT PROPERTY! TENANT OCCUPIED HOME. This is a beautifully updated 3 bedroom, 1 bath Bungalow with a full basement, shed in the back completely updated kitchen.
-
2024-11-11$109,900 Active
Show marketing remark (166 chars)
INVESTMENT PROPERTY! TENANT OCCUPIED HOME. This is a beautifully updated 3 bedroom, 1 bath Bungalow with a full basement, shed in the back completely updated kitchen.
-
2024-11-11historical
Show marketing remark (166 chars)
INVESTMENT PROPERTY! TENANT OCCUPIED HOME. This is a beautifully updated 3 bedroom, 1 bath Bungalow with a full basement, shed in the back completely updated kitchen.
-
2024-11-11historical
Show marketing remark (166 chars)
INVESTMENT PROPERTY! TENANT OCCUPIED HOME. This is a beautifully updated 3 bedroom, 1 bath Bungalow with a full basement, shed in the back completely updated kitchen.
-
2024-10-02price $114,500
-
2024-10-02price $114,500
-
2024-10-02price $114,500
-
2024-09-16price $119,900
-
2024-09-16price $119,900
-
2024-09-16price $119,900
-
2024-09-12price $125,500
-
2024-09-11price $125,500
-
2024-09-11price $125,500
-
2024-08-21price $128,500
-
2024-08-20price $128,500
-
2024-08-20price $128,500
-
2024-06-05price $132,500
-
2024-06-05price $132,500
-
2024-06-05price $132,500
-
2024-05-29status Active
-
2024-05-29status Active
-
2024-05-29status Pending
-
2024-05-29$135,000
-
2024-05-29historical
-
2024-05-29$135,000 Active
-
2015-08-05soldstatus $875
-
2015-07-21historical
-
2015-06-22$875
ⓘ Source: listings_history table (triggers on properties + properties_extension) + one-shot
backfill from property_details.listing_events for pre-trigger history.
Tax reassessment forecast MI · Partial reset (capped growth)
- Current annual tax
- $1,608 · $134/mo
- Projected year-2 tax
- $1,650 · $138/mo
- Expected delta
- +$42/yr (+$4/mo · 2.6%)
ⓘ Screening estimate from a state-policy table — verify with the county assessor before closing.
Climate risk First Street
- Flood 1/10 Low FEMA zone X (unshaded) · 0% chance over 30 yrs
- Wildfire 1/10 Low
- Heat 3/10 Moderate 7 d/yr ≥96°F today · 15 d/yr by 30 yrs out
- Wind 2/10 Low
- Air quality 3/10 Moderate 3 unhealthy d/yr today · 4 by 30 yrs out
Nearby sold comps map
Loading sold comps map…
Walkable amenities ~0.75 mi
Loading nearby amenities…
Taxation est. · year 1
- Rental income
- $16,555
- − Mortgage interest
- −$6,156
- − Property taxes
- −$1,608
- − Insurance
- −$550
- − Repairs & maintenance
- −$1,324
- − Management
- −$1,324
- − Depreciation
- −$3,197
- Taxable income
- $2,396
- Est. tax owed @ 24.0%
- −$575
- After-tax cash flow
- $3,430/yr
For passive investors: Depreciation is non-cash, so a rental often shows a tax loss while cash-flowing — sheltering income. Rental losses are passive: they offset passive income freely, and up to $25,000/yr can offset ordinary (W-2) income if you actively participate and your MAGI is under $100k (phasing out to $0 by $150k); unused losses carry forward. On sale, claimed depreciation is recaptured at up to 25%, and gains may owe capital-gains tax (a 1031 exchange can defer both). Figures are a year-1 estimate at your 24.0% rate — not tax advice; consult a CPA.
Schools (NCES district)
- District
- Harper Woods School District
- NCES district ID
- 2617760
- Math proficiency
- 4% ▼ -7.00%
- Reading proficiency
- 15% ▼ -9.00%
- Median HH income
- $46,155
- Composite
- 8.8/100
- National rank
- #9892
- State rank
- #524 of 540 in MI
Livability — Harper Woods
- Score
- 73/100
- State rank
- #199
- US rank
- #5054
Category grades
Schools grade is shown separately in the Schools card above.
Census & demographics
- Census place
- Harper Woods, MI
- County
- Wayne County · 1,562,939 people
- City population
- 16,098
- Metro
- Detroit-Warren-Dearborn, MI
- Population (ZIP)
- 16,098
- Household income
- $61,750
- Rent vs Own
- Severe rent burden
- 410.0
Population outlook (Wayne County) Hauer SSP2
- Today (2025)
- 1,675,273 people
- By 2030
- 1,620,300 · -3.3%
- By 2040
- 1,502,341 · -10.3%
- By 2050
- 1,384,039 · -17.4%
- By 2075
- 1,124,592 · -32.9%
- By 2100
- 881,193 · -47.4%
Race, ethnicity, and origin ACS 2023
- Neighborhood character
- Predominantly Black (65%)
- Race & ethnicity
- Black 65% White 28% Two or more races 4% Hispanic / Latino 1%
- Common ancestry
- Romanian 4% Lithuanian 1% German 1%
- Foreign-born
- 2% · Canada
- Languages at home
- 95% English-only · Arabic 2% Spanish 1%
Political lean MEDSL · Wayne
- 2024 margin
- Strong D (+29.0) · D 62.7% · R 33.7% · Other 3.6%
- 2008→2024 swing
- -20.5pp toward R · 2008: 49.5pp · 2024: 29.0pp
- All cycles
- 2024: D+29.0 2020: D+38.1 2016: D+37.3 2012: D+46.9 2008: D+49.5
Not yet ingested
- Civics
- —
Market trends
- HPI YoY
- ▼ -150.40%
- Current HPI
- 181.4961
- Rent YoY
- ▲ 5.10%
- Metro
- Detroit-Warren-Dearborn, MI
- State GDP YoY
- ▲ 1.37%
- F500 in state
- 28
Industry mix (Fortune 500 HQ in MI)
| Industry | F500 HQs | Revenue |
|---|---|---|
| Automotive Parts | 3 | $48B |
|
||
| Automotive | 2 | $372B |
|
||
| Chemicals | 1 | $45B |
|
||
| Automotive Retail | 1 | $29B |
|
||
| Healthcare / Medical Devices | 1 | $23B |
|
||
| Automotive Technology | 1 | $20B |
|
||
Price history
+96.6% since first listed53 events — show timeline
- 2025-11-19 Relisted — REALCOMP
- 2025-11-19 Relisted — MiRealSource-MiMLS
- 2025-11-19 Relisted — SW Michigan MLS
- 2025-10-31 Pending — REALCOMP
- 2025-10-31 Pending — MiRealSource-MiMLS
- 2025-10-31 Pending — SW Michigan MLS
- 2024-11-11 Listing Removed — MiRealSource-MiMLS
- 2024-11-11 Listing Removed — REALCOMP
- 2024-11-11 Listed $109,900 SW Michigan MLS
- 2024-11-11 Listed $109,900 MiRealSource-MiMLS
- 2024-11-11 Listed $109,900 REALCOMP
- 2024-10-02 Price Changed $114,500 MiRealSource-MiMLS
- 2024-10-02 Price Changed $114,500 REALCOMP
- 2024-10-02 Price Changed $114,500 SW Michigan MLS
- 2024-09-16 Price Changed $119,900 MiRealSource-MiMLS
- 2024-09-16 Price Changed $119,900 REALCOMP
- 2024-09-16 Price Changed $119,900 SW Michigan MLS
- 2024-09-12 Price Changed $125,500 MiRealSource-MiMLS
- 2024-09-11 Price Changed $125,500 REALCOMP
- 2024-09-11 Price Changed $125,500 SW Michigan MLS
- 2024-08-21 Price Changed $128,500 MiRealSource-MiMLS
- 2024-08-20 Price Changed $128,500 REALCOMP
- 2024-08-20 Price Changed $128,500 SW Michigan MLS
- 2024-06-05 Price Changed $132,500 MiRealSource-MiMLS
- 2024-06-05 Price Changed $132,500 REALCOMP
- 2024-06-05 Price Changed $132,500 SW Michigan MLS
- 2024-05-29 Relisted — REALCOMP
- 2024-05-29 Relisted — MiRealSource-MiMLS
- 2024-05-29 Pending — MiRealSource-MiMLS
- 2024-05-29 Listed $135,000 MiRealSource-MiMLS
- 2024-05-29 Listing Removed — REALCOMP
- 2024-05-29 Listed $135,000 REALCOMP
- 2015-08-05 Sold (MLS) $875 MiRealSource-MiMLS
- 2015-07-21 Listing Removed — MiRealSource-MiMLS
- 2015-06-22 Listed $875 MiRealSource-MiMLS
- 2014-06-26 Sold (MLS) $800 MiRealSource-MiMLS
- 2014-06-09 Listing Removed — MiRealSource-MiMLS
- 2014-05-27 Listed $800 MiRealSource-MiMLS
- 2014-02-28 Sold (MLS) $30,000 REALCOMP
- 2014-02-28 Sold (MLS) $30,000 MiRealSource-MiMLS
- 2014-02-14 Listing Removed — MiRealSource-MiMLS
- 2014-01-22 Listed $35,500 REALCOMP
- 2014-01-22 Listed $35,500 MiRealSource-MiMLS
- 2007-10-29 Sold (Public Records) $85,000 Public Records
- 2007-10-05 Sold (MLS) $85,000 REALCOMP
- 2007-10-05 Sold (MLS) $85,000 MiRealSource-MiMLS
- 2007-09-26 Listing Removed — MiRealSource-MiMLS
- 2007-08-21 Listed $84,900 REALCOMP
- 2007-08-20 Listed $84,900 MiRealSource-MiMLS
- 1995-10-27 Sold (MLS) $54,900 MiRealSource-MiMLS
- 1995-10-16 Sold (Public Records) $54,900 Public Records
- 1995-07-21 Listing Removed — MiRealSource-MiMLS
- 1995-07-05 Listed $55,900 MiRealSource-MiMLS
Property tax history
+0.1%/yrLatest (2025): $1,608 · -46.7% YoY. Source: county tax records.
Cash-flow waterfall
monthlySold comps — $/sqft
last 12 mo · ≤1 miLoading sold comps…