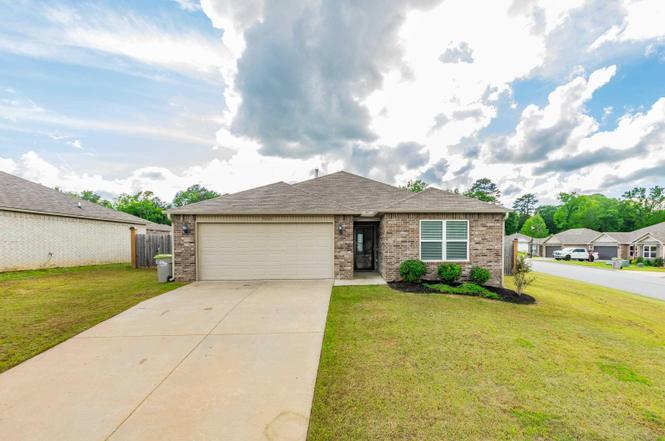
5001 Woodstream Dr · Alexander, AR
Flood risk No data
- FEMA flood zone
- —
- Chance of flooding over 30 yrs
- —
- Est. flood insurance / yr
- —
Fire risk No data
- Est. fire insurance / yr
- —
Heat risk No data
- Hot days now (above threshold)
- —
- Hot days in 30 yrs
- —
Wind risk No data
- Chance of severe wind over 30 yrs
- —
Air-quality risk No data
- Unhealthy air days now
- —
- Unhealthy air days in 30 yrs
- —
Risk factors via First Street. Map © Google.
Why this score? — see what drove the D grade
The composite is a weighted blend of 9 inputs, each scored 0–100. Each bar is that input's sub-score; the figure is the points it added to the 100-point composite (weight × sub-score).
- Cash flow +12.3/30.0
- ARV discount +11.6/15.0
- Schools +4.2/10.0
- DSCR +3.6/10.0
- Livability +3.2/5.0
- 1% rule +2.5/10.0
- Rent growth +2.5/5.0
- Condition / age +2.5/5.0
- Appreciation +0.0/10.0
$225,000
🖨 Deal sheet 📄 Offer letter ✓ Due diligence
Listing remarks
CORNER LOT!! Charming Home- 3 bedroom/ 2 bath/ 2 car garage home nestled in a serene neighborhood, offering spacious living areas. Well maintained property, with functionality kitchen, sliding patio doors, split floor plan, vinyl plank flooring, mud room, fenced back yard.
Key facts
- <corner lot>
- <split floor plan>
- 7,840 sq ft lot
Tags
Neighborhood map
What this means for you Summary
Snapshot
- This is a 3-bed/2.0-bath single-family listed at $225k.
Deal economics
- At list price, monthly cash flow is $-43 ($-514/yr) — negative.
- To cash-flow at today's rent, offer at most $217k (3.4% below list).
- To meet the 1% rule (rent ≥ 1% of price), the offer needs to be $170k (24.6% below list).
- Recommended offer: $170k (24.6% below list) — sets the bar for 1% rule.
Location & tenants
- Location reads 63/100 on livability (#194 in AR) — a middle-class / working-renter tenant base. Strengths: cost of living A+, housing A+; Watch: employment D, crime F, amenities F.
- Bryant School District (suburban): math 49% / reading 48% proficiency, ranked #16 of 238 in AR (top 7%) — families likely to look elsewhere, expect single-tenant / working-renter base with shorter leases.
- Market conditions: 184 active listings in the ZIP; 4 comparable units currently listed for rent nearby; rentals at typical pace (median 22d on market — plan ~3-4 weeks tenant-placement turnaround); 446 units permitted in Saline County in 2024 (0 in 5+ unit buildings).
Forward outlook
- Local home prices are declining (-3.0%/yr); year-one equity from $2k of loan paydown is wiped out by about $7k of value loss. Plan a longer hold.
- Saline County population projected at +39% by 2050 — long-run rental-demand tailwind backs the buy-and-hold thesis.
Negotiation context
- It's been on market 178 days — a 12% lower offer ($198k) is reasonable based on typical stale-listing flexibility.
- 3 sale attempts since 2y ago; this cycle's ask has dropped $15k (6%) from the opening price — seller is motivated, your offer sets the floor, not the list.
Questions for the listing agent
- What do current leases actually rent for vs. the listed asking? Can we see a recent rent roll and the last 12 months of T-12 income?
- It's been on market 178 days. Have you received any prior offers? Is the seller open to a 25% concession, seller financing, or rate buy-down credit?
- What does the HOA fee cover, when was the last increase, and are there any pending special assessments or reserve-fund shortfalls?
- Why hasn't it sold? Are there any deal-killer items the seller is aware of (foundation, flood, title, zoning, code violations)?
- Is there a deadline driving the sale (1031 exchange, divorce, estate, relocation)? That informs how much negotiation room exists.
- Crime grade is F in this area — have there been break-ins, vandalism, or insurance claims at this property in the last 3 years? What carrier currently insures it and at what premium?
- The area grade is low — what's the realistic commute time and amenity access for the typical tenant pool here? Any planned neighborhood developments (good or bad) we should know about?
- What's the average days-on-market for RENTAL listings here right now (not sales)? A rising rental-DOM trend means longer vacancies and softer asking-rent achievability than the comps imply.
- What's the recent tenant-quality profile in this submarket — average credit score on applications, eviction rate, late-payment / NSF rate, and stable-employment percentage? A property-management company in the area should have these aggregated.
- How much new for-sale + rental construction is in the pipeline within 1–3 miles? Heavy new supply typically softens prices + rents 12–24 months out; constrained supply supports both.
Investment metrics
- 1% rule
- 0.75% ✗
- Cap rate
- 6.06%
- Cash-on-cash
- -0.82%
- DSCR
- 0.96
- GRM
- 11.0
CMA / ARV
- ARV (on-the-fly)
- $247,800
- Comps found
- 12
Show comp detail 12 sales within ~0.75 mi
| Address | Dist | Beds/Ba | Sqft | Sold | Price | $/sf | Match |
|---|---|---|---|---|---|---|---|
| 5032 Woodstream Dr | 0.05mi | 3/2.0 | 1,636 (-1%) | 2mo | $229,900 | $141 | 94 |
| 1178 Meadows Edge Dr | 0.25mi | 3/2.0 | 1,636 (-1%) | 2mo | $235,000 | $144 | 85 |
| 7146 Woodsgate Cv | 0.22mi | 3/2.0 | 1,569 (-5%) | 4mo | $234,900 | $150 | 78 |
| 6089 Saddle Hl | 0.06mi | 3/2.0 | 1,508 (-9%) | 6mo | $226,000 | $150 | 78 |
| 2193 Fern Valley Dr | 0.04mi | 3/2.0 | 1,463 (-11%) | 2mo | $198,000 | $135 | 78 |
| 7017 Woodsgate Cv | 0.30mi | 4/2.0 (+1) | 1,724 (+4%) | 7mo | $238,000 | $138 | 68 |
| 3137 Sage Grass Ln | 0.28mi | 3/2.0 | 1,428 (-14%) | 8mo | $220,000 | $154 | 57 |
| 14556 Skyline Dr | 0.73mi | 4/2.0 (+1) | 1,631 (-1%) | 3mo | $233,000 | $143 | 56 |
| 3011 Greenfield Dr | 0.75mi | 3/2.0 | 1,550 (-6%) | 1mo | $249,000 | $161 | 54 |
| 3304 Lacross Dr | 0.74mi | 3/2.0 | 1,530 (-7%) | 1mo | $249,900 | $163 | 53 |
| 2411 Shadowcreek Dr | 0.74mi | 3/2.0 | 1,570 (-5%) | 8mo | $235,900 | $150 | 51 |
| 3113 Longmeadow Dr | 0.67mi | 3/2.5 | 1,470 (-11%) | 1mo | $230,000 | $156 | 47 |
Match score weights: distance 35% · size 25% · config 20% · recency 20%. Top-matched comps best support the ARV.
Projected returns pro-forma
-3.0% appreciation · 3.0% rent growth · sell at horizon
- IRR
- -17.7%
- Equity multiple
- 0.38×
- Total profit
- $-39,266
- Equity at exit
- $33,548
- IRR
- -9.9%
- Equity multiple
- 0.40×
- Total profit
- $-38,028
- Equity at exit
- $19,454
Cash invested: $63,000 (down + closing). Projections, not guarantees.
Landlord ↔ Tenant lean methodology
- Overall (STATE)
- 92 Strongly Landlord-Friendly
- State Arkansas
- 92 Strongly Landlord-Friendly · R+14
- County
- — inherits STATE
- City
- — inherits STATE
ZIP-level market 72002
- Home prices YoY
- -11.0%
- Active inventory
- 184
- Price-to-rent
- 11.0×
Monthly cashflow live
- Estimated rent
- $1,697 medium interval (Pro) →
- Mortgage (P&I)
- −$1,180
- Tax from tax record
- −$102 /mo · $1,222/yr
- Insurance
- −$94
- HOA
- −$8
- Vacancy / Maint / Mgmt
- −$356
- Net cashflow
- $-43
Break-even live
UW: 25.0% down · 7.5% · 30yr · 1.5% tax · 5.0% vac · 8.0% maint · 8.0% mgmt
Financing live
Cash to close
- Down payment
- $56,250
- Closing costs
- $6,750
- Reserves months
- —
- Total cash needed
- —
Loan-product check · same deal, 3 products live
Conventional
25% down · 7.5% · 30yr
- Down + closing
- —
- Monthly P&I
- —
- Monthly cashflow
- —
- DSCR
- —
- Eligible?
- —
Personal DTI + credit; lowest rate.
DSCR
20% down · 8.5% · 30yr
- Down + closing
- —
- Monthly P&I
- —
- Monthly cashflow
- —
- DSCR
- —
- Eligible?
- —
No personal income docs; deal must DSCR.
Hard money
10% down · 12.0% · 12mo
- Down + closing
- —
- Monthly P&I
- —
- Monthly cashflow
- —
- DSCR
- —
- Eligible?
- —
Short-term bridge; refi at stabilization.
Rent comps 4 comps
| Address | Beds | Baths | Sqft | Rent | $/sqft | DOM | Units | Dist |
|---|---|---|---|---|---|---|---|---|
| 2310 Kellybrook Bryant, AR | 3.0 | 2.0 | 1592 | $1,595 | $1.00 | 21d | 1 | 0.86mi |
| 2311 Mystic Pt Bryant, AR | 3.0 | 2.0 | 1516 | $1,650 | $1.09 | 23d | 1 | 0.87mi |
| 9112 Pleasant Valley Dr Alexander, AR | 3.0 | 2.0 | 1340 | $1,700 | $1.27 | 21d | 1 | 1.15mi |
| 3420 Garden Club Dr Bryant, AR | 3.0 | 2.0 | 1497 | $1,950 | $1.30 | 14d | 1 | 1.41mi |
HOA detail
- Monthly dues
- $8 · $96/yr
Listing history 13 events
-
2024-12-12soldstatus $225,000
-
2024-10-31status Under Contract
-
2024-10-01price $225,000
-
2024-08-30price $230,000
-
2024-08-30price $225,000
-
2024-07-13status Price Change
-
2024-07-09price $240,000
-
2024-07-09historical
-
2024-06-21status Back on Market
-
2024-05-25historical Take Backups
-
2024-05-20price $230,000
-
2024-05-03$240,000 New Listing
-
2019-03-21soldstatus $162,085
ⓘ Source: listings_history table (triggers on properties + properties_extension) + one-shot
backfill from property_details.listing_events for pre-trigger history.
Tax reassessment forecast AR · Resets to sale price
- Current annual tax
- $1,222 · $102/mo
- Projected year-2 tax
- $1,440 · $120/mo
- Expected delta
- +$218/yr (+$18/mo · 17.9%)
ⓘ Screening estimate from a state-policy table — verify with the county assessor before closing.
Nearby sold comps map
Loading sold comps map…
Walkable amenities ~0.75 mi
Loading nearby amenities…
Taxation est. · year 1
- Rental income
- $20,364
- − Mortgage interest
- −$12,603
- − Property taxes
- −$1,222
- − Insurance
- −$1,125
- − Repairs & maintenance
- −$1,629
- − Management
- −$1,629
- − HOA
- −$96
- − Depreciation
- −$6,545
- Taxable loss
- −$4,485
- Est. tax savings @ 24.0%
- +$1,077
- After-tax cash flow
- $563/yr
For passive investors: Depreciation is non-cash, so a rental often shows a tax loss while cash-flowing — sheltering income. Rental losses are passive: they offset passive income freely, and up to $25,000/yr can offset ordinary (W-2) income if you actively participate and your MAGI is under $100k (phasing out to $0 by $150k); unused losses carry forward. On sale, claimed depreciation is recaptured at up to 25%, and gains may owe capital-gains tax (a 1031 exchange can defer both). Figures are a year-1 estimate at your 24.0% rate — not tax advice; consult a CPA.
Schools (NCES district)
- District
- Bryant School District
- NCES district ID
- 0503690
- Math proficiency
- 49% ▼ -13.00%
- Reading proficiency
- 48% ▼ -8.00%
- Median HH income
- $57,578
- Composite
- 42.28/100
- National rank
- #3266
- State rank
- #16 of 238 in AR
Livability — Alexander
- Score
- 63/100
- State rank
- #194
- US rank
- #15376
Category grades
Schools grade is shown separately in the Schools card above.
Census & demographics
- Census place
- Alexander, AR
- Population (ZIP)
- 21,386
Population outlook (Saline County) Hauer SSP2
- Today (2025)
- 140,141 people
- By 2030
- 151,233 · +7.9%
- By 2040
- 173,100 · +23.5%
- By 2050
- 194,368 · +38.7%
- By 2075
- 245,295 · +75.0%
- By 2100
- 279,117 · +99.2%
Race, ethnicity, and origin ACS 2023
- Neighborhood character
- Majority White (65%)
- Race & ethnicity
- White 65% Black 20% Hispanic / Latino 10% Two or more races 7%
- Hispanic origin (detail)
- Mexican 5%
- Common ancestry
- Slovak 3% Lithuanian 2% Serbian 1%
- Foreign-born
- 6% · Canada
- Languages at home
- 91% English-only · Spanish 8%
Political lean MEDSL · Saline
- 2024 margin
- Solid R (+40.1) · D 28.8% · R 69.0% · Other 2.2%
- 2008→2024 swing
- +0.8pp no change · 2008: -41.0pp · 2024: -40.1pp
- All cycles
- 2024: R+40.1 2020: R+41.2 2016: R+43.5 2012: R+42.7 2008: R+41.0
Not yet ingested
- Civics
- —
Market trends
- HPI YoY
- ▼ -27.89%
- Current HPI
- 226.2889
- Rent YoY
- —
- Metro
- —
- State GDP YoY
- ▲ 3.80%
- F500 in state
- 10
Industry mix (Fortune 500 HQ in AR)
| Industry | F500 HQs | Revenue |
|---|---|---|
| Retail | 1 | $681B |
|
||
| Food / Agriculture | 1 | $53B |
|
||
| Retail / Energy | 1 | $22B |
|
||
| Transportation / Logistics | 1 | $12B |
|
||
| Energy | 1 | $4B |
|
||
Price history
+38.8% since first listed13 events — show timeline
- 2024-12-12 Sold (Public Records) $225,000 Public Records
- 2024-10-31 Pending — CARMLS
- 2024-10-01 Price Changed $225,000 CARMLS
- 2024-08-30 Price Changed $230,000 CARMLS
- 2024-08-30 Price Changed $225,000 CARMLS
- 2024-07-13 Relisted — CARMLS
- 2024-07-09 Price Changed $240,000 CARMLS
- 2024-07-09 Listing Removed — CARMLS
- 2024-06-21 Relisted — CARMLS
- 2024-05-25 Contingent — CARMLS
- 2024-05-20 Price Changed $230,000 CARMLS
- 2024-05-03 Listed $240,000 CARMLS
- 2019-03-21 Sold (Public Records) $162,085 Public Records
Property tax history
+28.6%/yrLatest (2025): $1,222 · -7.6% YoY. Source: county tax records.
Cash-flow waterfall
monthlySold comps — $/sqft
last 12 mo · ≤1 miLoading sold comps…