240 Oak Dr · Cashtown, PA
Flood risk 1/10 · Minimal
- FEMA flood zone
- X (unshaded)
- Chance of flooding over 30 yrs
- 0.0%
- Est. flood insurance / yr
- $507 – $1,088
Fire risk 4/10 · Minor
- Est. fire insurance / yr
- $511 – $949
Heat risk 3/10 · Minor
- Hot days now (above 96°F)
- 7 days/yr
- Hot days in 30 yrs
- 15 days/yr
Wind risk 2/10 · Minimal
- Chance of severe wind over 30 yrs
- 3.0%
Air-quality risk 2/10 · Minimal
- Unhealthy air days now
- 1 days/yr
- Unhealthy air days in 30 yrs
- 2 days/yr
Risk factors via First Street. Map © Google.
Why this score? — see what drove the F grade
The composite is a weighted blend of 9 inputs, each scored 0–100. Each bar is that input's sub-score; the figure is the points it added to the 100-point composite (weight × sub-score).
- Appreciation +10.0/10.0
- ARV discount +7.5/15.0
- Schools +4.6/10.0
- Livability +3.1/5.0
- Cash flow +2.7/30.0
- Rent growth +2.5/5.0
- Condition / age +2.5/5.0
- 1% rule +0.0/10.0
- DSCR +0.0/10.0
$374,850
🖨 Deal sheet (PDF) 📄 Offer letter ✓ Due diligence
Listing remarks MLS
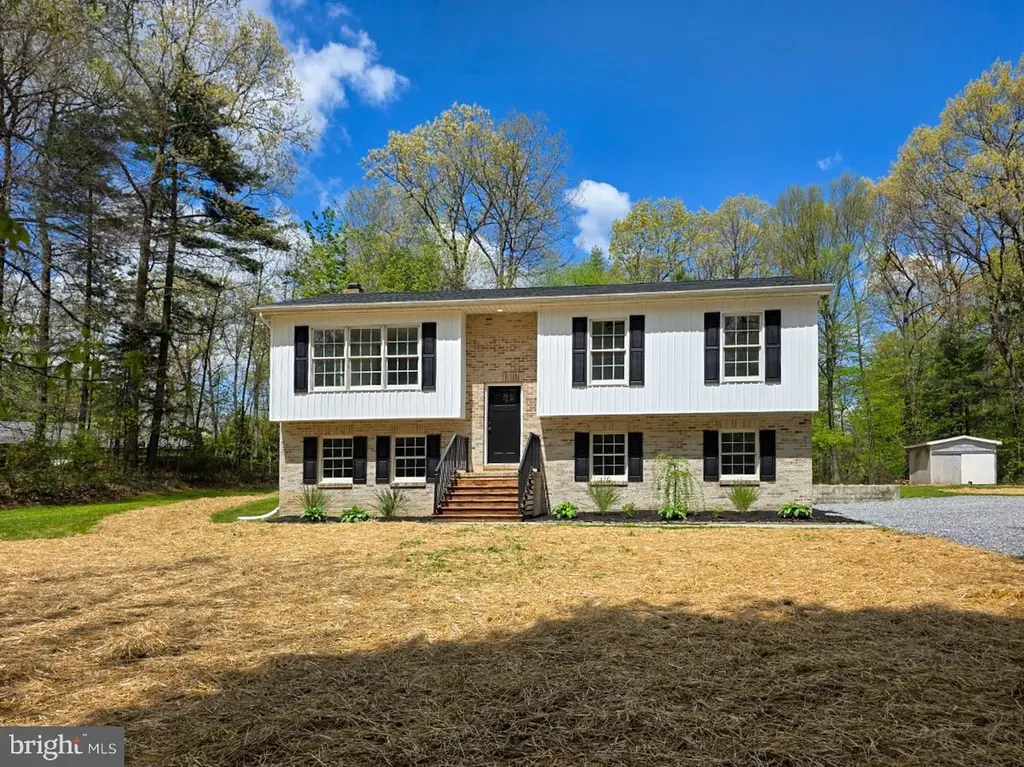
Built in 1993, this split level home offers approximately 1132 finished square feet, three bedrooms, one full and one half bath, partially finished basement and sits on an approximate 43996 sqft lot. This home is in need of repairs.
Key facts
- 1.01 acre lot
- Built 1993
- Listed 47 days
Property features AI
Finance
- Other: Fee simple ownership
- HOA & community: HOA fee $150 annually
Exterior
- Parking: Driveway
- Utilities: Well water; On-site septic
- Home design: Detached structure; Excellent condition; Finished above-grade area (estimated 2,312 sq ft)
- Construction: Brick and vinyl siding exterior; Slab foundation; Built year per assessor
- Exterior features: Detached single-family home; Not in a federal flood zone
Interior
- Bedrooms: Three bedrooms on the main level; One bedroom on the lower level
- Flooring: Laminate plank
- Bathrooms: Two full bathrooms on the main level; One full bathroom on the lower level (three full baths total)
- Heating & cooling: Forced air heating (electric); Central air conditioning; 200+ amp electrical service
- Interior features: Laminate plank flooring; Full basement
Neighborhood map
What this means for you Summary
Snapshot
- This is a 3-bed/2.5-bath other listed at $375k.
Deal economics
- At list price, monthly cash flow is $-1k ($-15k/yr) — negative.
- To cash-flow at today's rent, offer at most $151k (59.8% below list).
- To meet the 1% rule (rent ≥ 1% of price), the offer needs to be $143k (62.0% below list).
- Recommended offer: $143k (62.0% below list) — sets the bar for 1% rule.
Location & tenants
- Location reads 62/100 on livability (#1,329 in PA) — a middle-class / working-renter tenant base. Strengths: crime A-, cost of living A-, housing B+; Watch: amenities F, commute F, health & safety F.
- Gettysburg Area SD (rural): math 46% / reading 60% proficiency, ranked #132 of 539 in PA (top 24%) — acceptable for families but not a draw, mixed tenant base, ~2y average lease.
- Zoned schools: Gettysburg Area Hs (math 80% / reading 24%, grade C-, #112 of 437 statewide, top 26%, 1,024 students, 37% FRL) — zoned schools at 37% FRL track the district average.
- Market conditions: 20 active listings in the ZIP; 403 units permitted in Adams County in 2024 (0 in 5+ unit buildings).
Forward outlook
- In year one you build about $40k of equity ($3k loan paydown + $37k appreciation (10.0% local appreciation)).
- Adams County population projected at -10% by 2050 — secular population decline; favor cash flow + early exit over multi-decade hold.
- By year 2, paydown + projected appreciation supports a ~$64k cash-out refi (75% LTV) — recoverable capital for the next deal without selling this one.
Negotiation context
- It's been on market 47 days — a 3% lower offer ($364k) is reasonable based on typical stale-listing flexibility.
- 4 sale attempts since 2y ago; this cycle's ask has dropped $35k (9%) from the opening price — seller is motivated, your offer sets the floor, not the list.
- Current owner paid $160k; list at $375k implies a 134% gain — meaningful room to come down on a strong offer.
Questions for the listing agent
- What do current leases actually rent for vs. the listed asking? Can we see a recent rent roll and the last 12 months of T-12 income?
- It's been on market 47 days. Have you received any prior offers? Is the seller open to a 62% concession, seller financing, or rate buy-down credit?
- What does the HOA fee cover, when was the last increase, and are there any pending special assessments or reserve-fund shortfalls?
- Is there a deadline driving the sale (1031 exchange, divorce, estate, relocation)? That informs how much negotiation room exists.
- Schools are A-rated — typically a magnet for longer-tenancy family renters. What's the average tenant stay here, and is there a school-zone premium baked into asking?
- The area grade is low — what's the realistic commute time and amenity access for the typical tenant pool here? Any planned neighborhood developments (good or bad) we should know about?
- What's the average days-on-market for RENTAL listings here right now (not sales)? A rising rental-DOM trend means longer vacancies and softer asking-rent achievability than the comps imply.
- What's the recent tenant-quality profile in this submarket — average credit score on applications, eviction rate, late-payment / NSF rate, and stable-employment percentage? A property-management company in the area should have these aggregated.
- How much new for-sale + rental construction is in the pipeline within 1–3 miles? Heavy new supply typically softens prices + rents 12–24 months out; constrained supply supports both.
Investment metrics
- 1% rule
- 0.38% ✗
- Cap rate
- 2.23%
- Cash-on-cash
- -14.50%
- DSCR
- 0.35
- GRM
- 21.9
CMA / ARV
No comps found within radius.
Projected returns pro-forma
10.0% appreciation · 3.0% rent growth · sell at horizon
- IRR
- 14.2%
- Equity multiple
- 2.17×
- Total profit
- $123,265
- Equity at exit
- $337,695
- IRR
- 14.1%
- Equity multiple
- 5.06×
- Total profit
- $426,331
- Equity at exit
- $728,251
Cash invested: $104,958 (down + closing). Projections, not guarantees.
Landlord ↔ Tenant lean methodology
- Overall (STATE)
- 62 Landlord-Friendly
- State Pennsylvania
- 62 Landlord-Friendly · EVEN
- County
- — inherits STATE
- City
- — inherits STATE
ZIP-level market 17353
- Home prices YoY
- 5.2%
- Active inventory
- 20
- Price-to-rent
- 21.9×
Monthly cashflow live
- Estimated rent
- $1,425 medium interval (Pro) →
- Mortgage (P&I)
- −$1,966
- Tax from tax record
- −$259 /mo · $3,113/yr
- Insurance
- −$156
- HOA
- −$13
- Vacancy / Maint / Mgmt
- −$299
- Net cashflow
- $-1,268
Break-even live
Sensitivity live
| Price | -10% $-1,056 | -5% $-1,162 | +0% $-1,268 | +5% $-1,375 | +10% $-1,481 |
|---|---|---|---|---|---|
| Rent | -10% $-1,381 | -5% $-1,325 | +0% $-1,268 | +5% $-1,212 | +10% $-1,156 |
| Rate | -1.0pp $-1,080 | -0.5pp $-1,173 | base $-1,268 | +0.5pp $-1,366 | +1.0pp $-1,464 |
UW: 25.0% down · 7.5% · 30yr · 1.5% tax · 5.0% vac · 8.0% maint · 8.0% mgmt
Financing live
Cash to close
- Down payment
- $93,712
- Closing costs
- $11,246
- Reserves months
- —
- Total cash needed
- —
Loan-product check · same deal, 3 products live
Conventional
25% down · 7.5% · 30yr
- Down + closing
- —
- Monthly P&I
- —
- Monthly cashflow
- —
- DSCR
- —
- Eligible?
- —
Personal DTI + credit; lowest rate.
DSCR
20% down · 8.5% · 30yr
- Down + closing
- —
- Monthly P&I
- —
- Monthly cashflow
- —
- DSCR
- —
- Eligible?
- —
No personal income docs; deal must DSCR.
Hard money
10% down · 12.0% · 12mo
- Down + closing
- —
- Monthly P&I
- —
- Monthly cashflow
- —
- DSCR
- —
- Eligible?
- —
Short-term bridge; refi at stabilization.
HOA detail
- Monthly dues
- $13 · $156/yr
Listing history 29 events
-
2026-06-17status $374,850 Pending 47 DOM
-
2026-06-16days on market $374,850 Active 47 DOM
-
2026-06-16days on market $374,850 Active 46 DOM
-
2026-06-14days on market $374,850 Active 44 DOM
-
2026-06-12pricedays on market $374,850 Active 43 DOM
-
2026-06-09days on market $374,900 Active 40 DOM
-
2026-06-08days on market $374,900 Active 39 DOM
-
2026-06-07pricedays on market $374,900 Active 38 DOM
-
2026-06-05days on market $384,900 Active 35 DOM
-
2026-06-02days on market $384,900 Active 33 DOM
-
2026-06-01days on market $384,900 Active 32 DOM
-
2026-05-31days on market $384,900 Active 31 DOM
-
2026-05-30days on market $384,900 Active 30 DOM
-
2026-05-12price $399,750 822-char remark
-
2026-05-01$409,900 Active 822-char remark
-
2026-05-01historical $409,900 822-char remark
-
2026-01-26soldstatus $160,000 Closed 232-char remark
Show marketing remark (232 chars)
Built in 1993, this split level home offers approximately 1132 finished square feet, three bedrooms, one full and one half bath, partially finished basement and sits on an approximate 43996 sqft lot. This home is in need of repairs.
-
2026-01-06status Pending 232-char remark
Show marketing remark (232 chars)
Built in 1993, this split level home offers approximately 1132 finished square feet, three bedrooms, one full and one half bath, partially finished basement and sits on an approximate 43996 sqft lot. This home is in need of repairs.
-
2025-12-03price $172,300 232-char remark
Show marketing remark (232 chars)
Built in 1993, this split level home offers approximately 1132 finished square feet, three bedrooms, one full and one half bath, partially finished basement and sits on an approximate 43996 sqft lot. This home is in need of repairs.
-
2025-11-03price $181,300 232-char remark
Show marketing remark (232 chars)
Built in 1993, this split level home offers approximately 1132 finished square feet, three bedrooms, one full and one half bath, partially finished basement and sits on an approximate 43996 sqft lot. This home is in need of repairs.
-
2025-10-02$190,800 Active 232-char remark
Show marketing remark (232 chars)
Built in 1993, this split level home offers approximately 1132 finished square feet, three bedrooms, one full and one half bath, partially finished basement and sits on an approximate 43996 sqft lot. This home is in need of repairs.
-
2025-08-15historical
-
2025-06-04status Active
-
2025-05-16status Pending
-
2025-03-24price $154,600
-
2025-02-20price $162,700
-
2025-01-21price $171,200
-
2024-12-18$180,200 Active
-
1994-01-12soldstatus $15,000
ⓘ Source: listings_history table (triggers on properties + properties_extension) + one-shot
backfill from property_details.listing_events for pre-trigger history.
Tax reassessment forecast PA · Partial reset (capped growth)
- Current annual tax
- $3,113 · $259/mo
- Projected year-2 tax
- $4,518 · $376/mo
- Expected delta
- +$1,405/yr (+$117/mo · 45.1%)
ⓘ Screening estimate from a state-policy table — verify with the county assessor before closing.
Climate risk First Street
- Flood 1/10 Low FEMA zone X (unshaded) · 0% chance over 30 yrs
- Wildfire 4/10 Moderate
- Heat 3/10 Moderate 7 d/yr ≥96°F today · 15 d/yr by 30 yrs out
- Wind 2/10 Low 3% chance of damaging wind over 30 yrs
- Air quality 2/10 Low 1 unhealthy d/yr today · 2 by 30 yrs out
Nearby sold comps map
Loading sold comps map…
Walkable amenities ~0.75 mi
Loading nearby amenities…
Taxation est. · year 1
- Rental income
- $17,102
- − Mortgage interest
- −$20,997
- − Property taxes
- −$3,113
- − Insurance
- −$1,874
- − Repairs & maintenance
- −$1,368
- − Management
- −$1,368
- − HOA
- −$156
- − Depreciation
- −$10,905
- Taxable loss
- −$22,679
- Est. tax savings @ 24.0%
- +$5,443
- After-tax cash flow
- $-9,778/yr
For passive investors: Depreciation is non-cash, so a rental often shows a tax loss while cash-flowing — sheltering income. Rental losses are passive: they offset passive income freely, and up to $25,000/yr can offset ordinary (W-2) income if you actively participate and your MAGI is under $100k (phasing out to $0 by $150k); unused losses carry forward. On sale, claimed depreciation is recaptured at up to 25%, and gains may owe capital-gains tax (a 1031 exchange can defer both). Figures are a year-1 estimate at your 24.0% rate — not tax advice; consult a CPA.
Schools (NCES district)
- District
- Gettysburg Area SD
- NCES district ID
- 4210710
- Math proficiency
- 46% ▼ -9.00%
- Reading proficiency
- 60% ▼ -9.00%
- Median HH income
- $58,451
- Composite
- 46.03/100
- National rank
- #2526
- State rank
- #132 of 539 in PA
Livability — Cashtown
- Score
- 62/100
- State rank
- #1329
- US rank
- #16387
Category grades
Schools grade is shown separately in the Schools card above.
Census & demographics
- Population (ZIP)
- 2,745
Population outlook (Adams County) Hauer SSP2
- Today (2025)
- 102,494 people
- By 2030
- 101,890 · -0.6%
- By 2040
- 98,417 · -4.0%
- By 2050
- 92,014 · -10.2%
- By 2075
- 76,128 · -25.7%
- By 2100
- 58,931 · -42.5%
Race, ethnicity, and origin ACS 2023
- Neighborhood character
- Predominantly White (96%)
- Race & ethnicity
- White 96% Hispanic / Latino 2% Two or more races 2%
- Common ancestry
- Romanian 2% Iranian 2% Slovak 1%
- Foreign-born
- 1% · Canada
- Languages at home
- 91% English-only · German/W. Germanic 4% Spanish 4% Other Asian/Pacific 1%
Political lean MEDSL · Adams
- 2024 margin
- Solid R (+33.6) · D 32.7% · R 66.4%
- 2008→2024 swing
- -14.1pp toward R · 2008: -19.6pp · 2024: -33.6pp
- All cycles
- 2024: R+33.6 2020: R+34.1 2016: R+36.4 2012: R+27.6 2008: R+19.6
Not yet ingested
- Civics
- —
Market trends
- HPI YoY
- ▲ 15.28%
- Current HPI
- 307.9862
- Rent YoY
- —
- Metro
- —
- State GDP YoY
- ▲ 1.68%
- F500 in state
- 34
Industry mix (Fortune 500 HQ in PA)
| Industry | F500 HQs | Revenue |
|---|---|---|
| Healthcare | 2 | $309B |
|
||
| Insurance | 2 | $27B |
|
||
| Telecommunications / Media | 1 | $124B |
|
||
| Industrial Distribution | 1 | $22B |
|
||
| Financial Services | 1 | $20B |
|
||
| Chemicals / Materials | 1 | $18B |
|
||
Price history
+2399.0% since first listed20 events — show timeline
- 2026-06-16 Pending — BRIGHT MLS
- 2026-06-12 Price Changed $374,850 BRIGHT MLS
- 2026-06-05 Price Changed $374,900 BRIGHT MLS
- 2026-05-22 Price Changed $384,900 BRIGHT MLS
- 2026-05-12 Price Changed $399,750 BRIGHT MLS
- 2026-05-01 Listed $409,900 BRIGHT MLS
- 2026-05-01 Coming Soon $409,900 BRIGHT MLS
- 2026-01-26 Sold (MLS) $160,000 BRIGHT MLS
- 2026-01-06 Pending — BRIGHT MLS
- 2025-12-03 Price Changed $172,300 BRIGHT MLS
- 2025-11-03 Price Changed $181,300 BRIGHT MLS
- 2025-10-02 Listed $190,800 BRIGHT MLS
- 2025-08-15 Listing Removed — BRIGHT MLS
- 2025-06-04 Relisted — BRIGHT MLS
- 2025-05-16 Pending — BRIGHT MLS
- 2025-03-24 Price Changed $154,600 BRIGHT MLS
- 2025-02-20 Price Changed $162,700 BRIGHT MLS
- 2025-01-21 Price Changed $171,200 BRIGHT MLS
- 2024-12-18 Listed $180,200 BRIGHT MLS
- 1994-01-12 Sold (Public Records) $15,000 Public Records
Property tax history
+2.6%/yrLatest (2026): $3,113 · +0.7% YoY. Source: county tax records.
Cash-flow waterfall
monthlySold comps — $/sqft
last 12 mo · ≤1 miLoading sold comps…