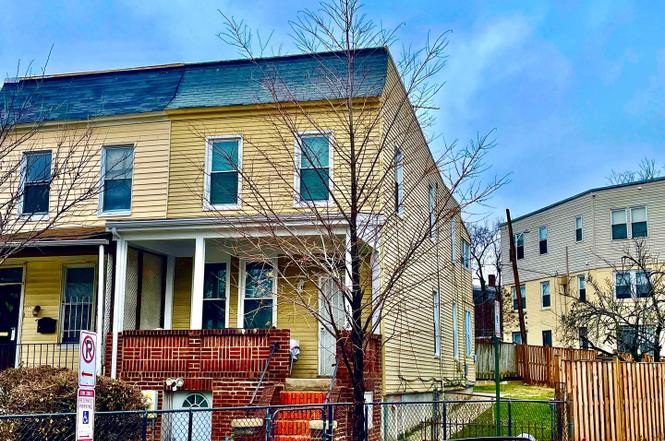
1646 Trinidad Ave NE · Washington, DC
Flood risk 1/10 · Minimal
- FEMA flood zone
- X (unshaded)
- Chance of flooding over 30 yrs
- 0.0%
- Est. flood insurance / yr
- $473 – $860
Fire risk 1/10 · Minimal
- Est. fire insurance / yr
- $631 – $1,173
Heat risk 7/10 · Major
- Hot days now (above 106°F)
- 7 days/yr
- Hot days in 30 yrs
- 15 days/yr
Wind risk 4/10 · Minor
- Chance of severe wind over 30 yrs
- 19.0%
Air-quality risk 4/10 · Minor
- Unhealthy air days now
- 4 days/yr
- Unhealthy air days in 30 yrs
- 5 days/yr
Risk factors via First Street. Map © Google.
Why this score? — see what drove the C- grade
The composite is a weighted blend of 9 inputs, each scored 0–100. Each bar is that input's sub-score; the figure is the points it added to the 100-point composite (weight × sub-score).
- Cash flow +16.1/30.0
- ARV discount +15.0/15.0
- DSCR +5.0/10.0
- 1% rule +4.5/10.0
- Livability +3.7/5.0
- Schools +3.6/10.0
- Condition / age +2.5/5.0
- Rent growth +1.7/5.0
- Appreciation +0.0/10.0
$399,000
🖨 Deal sheet (PDF) 📄 Offer letter ✓ Due diligence
Listing remarks
If space, location, and price are important, then all boxes are check with this large three bedroom, 2 bath home located blocks from Union Market and the H Street attractions- Whole Foods, Giant, shops, theaters, trolley, restaurants, etc. This home features architectural details from the early 1900's. It is priced well below the tax assessed value to accommodate your updates or renovations - sweat equity. This home has a rare eat-in kitchen with a separate dining room. The owner has enjoyed this home for nearly 30 years and has installed new windows and central air conditioning, replaced water heater and refinished the front porch. The large corner lot is the envy of the neighborhood wit
Key facts
- Built 1910
- Listed 428 days
Property features AI
Finance
- Other: Pets allowed with no pet restrictions; Above-grade finished area reported by assessor; Below-grade finished and unfinished area reported by assessor
- Financial info: Fee simple ownership
- HOA & community: No HOA details provided
Exterior
- Parking: On-street parking
- Security: No security features provided
- Utilities: Public water; Public sewer; Electric available; Natural gas available; Cable TV available; Phone available; Municipal trash service; Hot water by natural gas with 60+ gallon tank
- Home design: Semi-detached property; Not in a federal flood zone
- Construction: Brick and vinyl siding exterior; Block foundation; Building not winterized
- Exterior features: Privacy fencing; Urban location (in city limits)
Interior
- Kitchen: No kitchen appliance details provided
- Bedrooms: Three bedrooms on the upper level
- Flooring: No flooring details provided
- Bathrooms: Two full bathrooms (one on upper level, one on lower level)
- Heating & cooling: Central heating; Central air conditioning; Natural gas heating
- Interior features: Living room; Dining room; Sitting room; Screened porch; Utility room; Unfinished basement with outside/front entrance
- Laundry & utility: Washer and dryer in unit
Neighborhood map
What this means for you Summary
Snapshot
- This is a 3-bed/2.0-bath single-family listed at $399k.
Deal economics
- At list price, monthly cash flow is $207 ($2k/yr) — positive.
- The deal already cash-flows at list — no discount required.
- To meet the 1% rule (rent ≥ 1% of price), the offer needs to be $379k (5.1% below list).
- Recommended offer: $351k (12.0% below list) — sets the bar for market timing.
- Cap rate 6.9% vs local median 2.5% in Washington — top-decile yield for the area; either an underpriced asset or a hidden risk that comps aren't pricing in. Stress-test before assuming the spread holds.
Location & tenants
- Location reads 73/100 on livability (#1 in DC) — a middle-class / working-renter tenant base. Strengths: amenities A+, commute A+, employment A+; Watch: crime F, cost of living F.
- District Of Columbia Public Schools (urban): math 33% / reading 40% proficiency, ranked #8 of 32 in DC (top 25%) — families likely to look elsewhere, expect single-tenant / working-renter base with shorter leases; 65% free/reduced lunch — lower-income household profile, screen leases tightly.
- Zoned schools: Wheatley Education Campus (321 students, 0% FRL); Dunbar Hs (868 students, 0% FRL) — zoned schools average 0% FRL vs 65% district-wide (65 pts lower); this property's tenant base skews higher-income than the district average.
- Market conditions: Rents falling (-3.0%/yr); 558 active listings in the ZIP; 40 comparable units currently listed for rent nearby; rentals at typical pace (median 27d on market — plan ~3-4 weeks tenant-placement turnaround); high-income renter base; 1,737 units permitted in District of Columbia in 2024 (1,506 in 5+ unit buildings).
- This rent runs 38% of the median local income ($120k/yr) — at the standard rent-burdened threshold; future hikes will face affordability resistance.
Forward outlook
- Local home prices are declining (-3.0%/yr); year-one equity from $3k of loan paydown is wiped out by about $12k of value loss. Plan a longer hold.
- District of Columbia County population projected at +50% by 2050 — long-run rental-demand tailwind backs the buy-and-hold thesis.
Negotiation context
- It's been on market 428 days — a 12% lower offer ($351k) is reasonable based on typical stale-listing flexibility.
- 5 sale attempts since 2y ago; this cycle's ask has dropped $251k (39%) from the opening price — seller is motivated, your offer sets the floor, not the list.
- Current owner paid $68k; list at $399k implies a 487% gain — meaningful room to come down on a strong offer.
Risks & watch-outs
- Watch-outs: built in 1910 — expect roof / HVAC / electrical / plumbing capex.
- Climate carrying-cost: extreme-heat days projected 7→15/yr by 2055 (HVAC capex compounding) — expect insurance premiums to compound above CPI over the hold.
Questions for the listing agent
- It's been on market 428 days. Have you received any prior offers? Is the seller open to a 12% concession, seller financing, or rate buy-down credit?
- Built in 1910 — when were the roof, HVAC, electrical panel, plumbing, and water heater last replaced?
- Why hasn't it sold? Are there any deal-killer items the seller is aware of (foundation, flood, title, zoning, code violations)?
- Is there a deadline driving the sale (1031 exchange, divorce, estate, relocation)? That informs how much negotiation room exists.
- Crime grade is F in this area — have there been break-ins, vandalism, or insurance claims at this property in the last 3 years? What carrier currently insures it and at what premium?
- What's the average days-on-market for RENTAL listings here right now (not sales)? A rising rental-DOM trend means longer vacancies and softer asking-rent achievability than the comps imply.
- What's the recent tenant-quality profile in this submarket — average credit score on applications, eviction rate, late-payment / NSF rate, and stable-employment percentage? A property-management company in the area should have these aggregated.
- How much new for-sale + rental construction is in the pipeline within 1–3 miles? Heavy new supply typically softens prices + rents 12–24 months out; constrained supply supports both.
Investment metrics
- 1% rule
- 0.95% ✗
- Cap rate
- 6.92%
- Cash-on-cash
- 2.23%
- DSCR
- 1.10
- GRM
- 8.8
CMA / ARV
- ARV (on-the-fly)
- $667,200
- Comps found
- 2
Show comp detail 2 sales within ~0.75 mi
| Address | Dist | Beds/Ba | Sqft | Sold | Price | $/sf | Match |
|---|---|---|---|---|---|---|---|
| 602 12th St NE | 0.75mi | 3/2.0 | 1,662 (+4%) | 22mo | $400,040 | $241 | 40 |
| 1135 7th St NE | 0.67mi | 4/2.5 (+1) | 1,800 (+12%) | 21mo | $750,000 | $417 | 23 |
Match score weights: distance 35% · size 25% · config 20% · recency 20%. Top-matched comps best support the ARV.
Projected returns pro-forma
-3.0% appreciation · 0.0% rent growth · sell at horizon
- IRR
- -16.2%
- Equity multiple
- 0.44×
- Total profit
- $-62,478
- Equity at exit
- $59,492
- IRR
- -14.5%
- Equity multiple
- 0.28×
- Total profit
- $-79,988
- Equity at exit
- $34,498
Cash invested: $111,720 (down + closing). Projections, not guarantees.
Landlord ↔ Tenant lean methodology
- Overall (CITY)
- 0 Strongly Tenant-Friendly
- State District of Columbia
- 12 Strongly Tenant-Friendly · D+43
- County
- — inherits STATE
- City Washington
- 0 Strongly Tenant-Friendly · D+43
ZIP-level market 20002
- Rents YoY
- -3.0%
- Active inventory
- 558
- Price-to-rent
- 8.8×
Monthly cashflow live
- Estimated rent
- $3,786 high interval (Pro) →
- Mortgage (P&I)
- −$2,092
- Tax from tax record
- −$525 /mo · $6,299/yr
- Insurance
- −$166
- HOA
- −$0
- Vacancy / Maint / Mgmt
- −$795
- Net cashflow
- $207
Break-even live
Sensitivity live
| Price | -10% $433 | -5% $320 | +0% $207 | +5% $94 | +10% $-19 |
|---|---|---|---|---|---|
| Rent | -10% $-92 | -5% $58 | +0% $207 | +5% $357 | +10% $506 |
| Rate | -1.0pp $408 | -0.5pp $309 | base $207 | +0.5pp $104 | +1.0pp $-1 |
UW: 25.0% down · 7.5% · 30yr · 1.5% tax · 5.0% vac · 8.0% maint · 8.0% mgmt
Financing live
Cash to close
- Down payment
- $99,750
- Closing costs
- $11,970
- Reserves months
- —
- Total cash needed
- —
Loan-product check · same deal, 3 products live
Conventional
25% down · 7.5% · 30yr
- Down + closing
- —
- Monthly P&I
- —
- Monthly cashflow
- —
- DSCR
- —
- Eligible?
- —
Personal DTI + credit; lowest rate.
DSCR
20% down · 8.5% · 30yr
- Down + closing
- —
- Monthly P&I
- —
- Monthly cashflow
- —
- DSCR
- —
- Eligible?
- —
No personal income docs; deal must DSCR.
Hard money
10% down · 12.0% · 12mo
- Down + closing
- —
- Monthly P&I
- —
- Monthly cashflow
- —
- DSCR
- —
- Eligible?
- —
Short-term bridge; refi at stabilization.
Rent comps 40 comps
| Address | Beds | Baths | Sqft | Rent | $/sqft | DOM | Units | Dist |
|---|---|---|---|---|---|---|---|---|
| 1638 Trinidad Ave NE #1 Washington, DC | 3.0 | 2.5 | 1780 | $5,950 | $3.34 | 20d | 1 | 0.00mi |
| 1255 Raum St NE Unit 1388282P Washington, DC | 2.0–8.0 | 1.0–5.0 | 3245 | $5,195 | $1.60 | 4d | 2 | 0.07mi |
| 1331 Queen St NE Washington, DC | 3.0 | 2.0 | 1708 | $4,600 | $2.69 | 17d | 1 | 0.13mi |
| 1331 Queen St NE Washington, DC | 3.0 | 2.0 | 1708 | $4,600 | $2.69 | 19d | 1 | 0.13mi |
| 1222 Owen Pl NE Washington, DC | 4.0 | 2.5 | 2164 | $3,800 | $1.76 | 26d | 1 | 0.18mi |
| 1224 16th St NE Washington, DC | 4.0 | 2.0 | 1360 | $3,900 | $2.87 | 26d | 1 | 0.19mi |
| 1409 Orren St NE Washington, DC | 4.0 | 2.0 | 1352 | $3,995 | $2.95 | 9d | 1 | 0.19mi |
| 1714 Montello Ave NE Washington, DC | 4.0 | 3.0 | 2100 | $4,350 | $2.07 | 26d | 1 | 0.19mi |
| 1236 Oates St NE Washington, DC | 4.0 | 2.0 | 1294 | $2,999 | $2.32 | 20d | 1 | 0.21mi |
| 1417 Montello Ave NE Washington, DC | 3.0 | 2.5 | 1412 | $4,995 | $3.54 | 26d | 1 | 0.22mi |
| 1023 16th St NE Unit B Washington, DC | 2.0 | 2.0 | 1229 | $3,100 | $2.52 | 20d | 1 | 0.26mi |
| 1328 Holbrook St NE Washington, DC | 3.0 | 3.0 | 1260 | $3,400 | $2.70 | 26d | 1 | 0.26mi |
| 1157 Oates St NE Unit 1A Washington, DC | 3.0 | 3.0 | 1400 | $4,000 | $2.86 | 26d | 1 | 0.28mi |
| 1159 Oates St NE Unit B Washington, DC | 2.0 | 2.0 | 1333 | $3,000 | $2.25 | 0d | 1 | 0.28mi |
| 1028 Bladensburg Rd NE Washington, DC | 3.0 | 2.0 | 1067 | $2,800 | $2.62 | 9d | 1 | 0.29mi |
| 1232 Trinidad Ave NE Unit 1 Washington, DC | 3.0 | 2.5 | 1478 | $4,000 | $2.71 | 26d | 1 | 0.30mi |
| 1838 Capitol Ave NE Washington, DC | 3.0 | 2.5 | 1230 | $2,550 | $2.07 | 26d | 1 | 0.33mi |
| 1809 Kendall St NE Washington, DC | 3.0 | 3.0 | 1376 | $3,695 | $2.69 | 26d | 1 | 0.33mi |
| 1215 Staples St NE Washington, DC | 4.0 | 2.0 | 1326 | $3,050 | $2.30 | 1d | 1 | 0.33mi |
| 1916 W Virginia Ave NE Unit 2 Washington, DC | 3.0 | 2.0 | 1800 | $2,900 | $1.61 | 22d | 1 | 0.34mi |
| 1200 Staples St NE #3 Washington, DC | 2.0 | 2.0 | 1100 | $3,600 | $3.27 | 26d | 1 | 0.35mi |
| 1742 Lyman Pl NE Washington, DC | 3.0 | 3.0 | 1196 | $3,495 | $2.92 | 26d | 1 | 0.37mi |
| 1213 Holbrook St NE #1 Washington, DC | 3.0 | 2.5 | 1618 | $3,850 | $2.38 | 20d | 1 | 0.37mi |
| 1102 Trinidad Ave NE Washington, DC | 3.0 | 2.5 | 1288 | $3,500 | $2.72 | 16d | 1 | 0.40mi |
| 1320 Florida Ave NE Washington, DC | 3.0 | 1.5 | 1272 | $2,999 | $2.36 | 26d | 1 | 0.40mi |
| 1676 Maryland Ave NE Washington, DC | 2.0 | 1.0–2.0 | 827 | $3,499 | $4.23 | 0d | 68 | 0.41mi |
| 1018 18th St NE Apt 1 Washington, DC | 2.0 | 1.0 | 1100 | $2,650 | $2.41 | 24d | 1 | 0.41mi |
| 1858 Kendall St NE #2 Washington, DC | 3.0 | 2.0 | 1150 | $3,000 | $2.61 | 26d | 1 | 0.41mi |
| 1006 18th St NE Washington, DC | 3.0 | 2.5 | 1684 | $3,095 | $1.84 | 26d | 1 | 0.42mi |
| 1495 Gallaudet St NE Unit 1495B Washington, DC | 3.0 | 2.5 | 1586 | $4,141 | $2.61 | 26d | 1 | 0.43mi |
| 1321 I St NE Washington, DC | 4.0 | 3.5 | 1809 | $4,600 | $2.54 | 26d | 1 | 0.45mi |
| 1929 Gallaudet St NE Washington, DC | 3.0 | 2.0 | 1200 | $3,395 | $2.83 | 26d | 1 | 0.45mi |
| 1241 I St NE Washington, DC | 3.0 | 2.5 | 1402 | $4,000 | $2.85 | 26d | 1 | 0.48mi |
| 1324 H St NE Unit 2 Washington, DC | 4.0 | 1.5 | 2100 | $4,000 | $1.90 | 26d | 1 | 0.49mi |
| 1825 Maryland Ave NE Washington, DC | 2.0–3.0 | 1.0 | 942 | $2,400 | $2.55 | 1d | 2 | 0.50mi |
| 1230 Wylie St NE Washington, DC | 3.0 | 1.5 | 1202 | $3,000 | $2.50 | 9d | 1 | 0.50mi |
| 1451 Maryland Ave NE Unit PH Washington, DC | 2.0 | 2.0 | 2000 | $5,250 | $2.62 | 19d | 1 | 0.51mi |
| 1203 I St NE Washington, DC | 3.0 | 1.5 | 1322 | $4,200 | $3.18 | 26d | 1 | 0.52mi |
| 1301 H St NE #7 Washington, DC | 3.0 | 2.0 | 1070 | $3,850 | $3.60 | 26d | 1 | 0.53mi |
| 1700 H St NE Washington, DC | 2.0 | 1.0–2.0 | 961 | $4,115 | $4.28 | 3d | 30 | 0.53mi |
Listing history 32 events
-
2026-06-21days on market $399,000 Active 428 DOM
-
2026-06-18days on market $399,000 Active 425 DOM
-
2026-06-17days on market $399,000 Active 424 DOM
-
2026-06-16days on market $399,000 Active 423 DOM
-
2026-06-15days on market $399,000 Active 422 DOM
-
2026-06-13days on market $399,000 Active 420 DOM
-
2026-06-09days on market $399,000 Active 416 DOM
-
2026-06-08days on market $399,000 Active 415 DOM
-
2026-06-07days on market $399,000 Active 414 DOM
-
2026-06-04days on market $399,000 Active 411 DOM
-
2026-06-03days on market $399,000 Active 410 DOM
-
2026-06-02days on market $399,000 Active 409 DOM
-
2026-06-01days on market $399,000 Active 408 DOM
-
2026-05-31days on market $399,000 Active 407 DOM
-
2026-05-01status Active
-
2026-04-30historical
-
2026-03-24status Active
-
2026-01-31status Pending
-
2026-01-30historical
-
2026-01-12price $399,000
-
2025-12-19price $480,000
-
2025-10-02status Active
-
2025-09-30historical
-
2025-04-04price $525,000
-
2025-02-23$650,000 Active
-
2025-02-07historical $650,000
-
2025-02-02historical
-
2025-01-31price $724,900
-
2024-12-26price $749,900
-
2024-12-01price $774,900
-
2024-10-28$799,900 Active
-
1990-12-12soldstatus $68,000
ⓘ Source: listings_history table (triggers on properties + properties_extension) + one-shot
backfill from property_details.listing_events for pre-trigger history.
Tax reassessment forecast DC · Partial reset (capped growth)
- Current annual tax
- $6,299 · $525/mo
- Projected year-2 tax
- $6,299 · $525/mo
- Expected delta
- $0/yr ($0/mo · 0.0%)
ⓘ Screening estimate from a state-policy table — verify with the county assessor before closing.
Climate risk First Street
- Flood 1/10 Low FEMA zone X (unshaded) · 0% chance over 30 yrs
- Wildfire 1/10 Low
- Heat 7/10 Severe 7 d/yr ≥106°F today · 15 d/yr by 30 yrs out
- Wind 4/10 Moderate 19% chance of damaging wind over 30 yrs
- Air quality 4/10 Moderate 4 unhealthy d/yr today · 5 by 30 yrs out
Nearby sold comps map
Loading sold comps map…
Walkable amenities ~0.75 mi
Loading nearby amenities…
Taxation est. · year 1
- Rental income
- $45,430
- − Mortgage interest
- −$22,350
- − Property taxes
- −$6,299
- − Insurance
- −$1,995
- − Repairs & maintenance
- −$3,634
- − Management
- −$3,634
- − Depreciation
- −$11,607
- Taxable loss
- −$4,090
- Est. tax savings @ 24.0%
- +$982
- After-tax cash flow
- $3,469/yr
For passive investors: Depreciation is non-cash, so a rental often shows a tax loss while cash-flowing — sheltering income. Rental losses are passive: they offset passive income freely, and up to $25,000/yr can offset ordinary (W-2) income if you actively participate and your MAGI is under $100k (phasing out to $0 by $150k); unused losses carry forward. On sale, claimed depreciation is recaptured at up to 25%, and gains may owe capital-gains tax (a 1031 exchange can defer both). Figures are a year-1 estimate at your 24.0% rate — not tax advice; consult a CPA.
Schools (NCES district)
- District
- District Of Columbia Public Schools
- NCES district ID
- 1100030
- Math proficiency
- 33% ▲ 3.00%
- Reading proficiency
- 40% ▲ 5.00%
- Median HH income
- $67,671
- Composite
- 35.84/100
- National rank
- #9606
- State rank
- #8 of 32 in DC
Livability — Washington
- Score
- 73/100
- State rank
- #1
- US rank
- #5327
Category grades
Schools grade is shown separately in the Schools card above.
Census & demographics
- Census place
- Washington, DC
- County
- District of Columbia · 671,873 people
- City population
- 671,873
- Metro
- Washington-Arlington-Alexandria, DC-VA-MD-WV
- Population (ZIP)
- 72,397
- Household income
- $120,337
- Rent vs Own
- Severe rent burden
- 3854.0
Population outlook (District of Columbia County) Hauer SSP2
- Today (2025)
- 821,926 people
- By 2030
- 899,517 · +9.4%
- By 2040
- 1,061,162 · +29.1%
- By 2050
- 1,231,493 · +49.8%
- By 2075
- 1,603,312 · +95.1%
- By 2100
- 1,847,141 · +124.7%
Race, ethnicity, and origin ACS 2023
- Neighborhood character
- Diverse neighborhood (Simpson 0.66)
- Race & ethnicity
- White 41% Black 40% Two or more races 9% Hispanic / Latino 9% Asian 3%
- Hispanic origin (detail)
- Mexican 2%
- Common ancestry
- Romanian 3% Lithuanian 2% Italian 2%
- Foreign-born
- 9% · Canada, China, South Korea
- Languages at home
- 87% English-only · Spanish 5% French/Haitian/Cajun 2% Other Indo-European 1%
Political lean MEDSL · District of Columbia
- 2024 margin
- Solid D (+86.1) · D 91.2% · R 5.1% · Other 3.8%
- 2008→2024 swing
- +0.1pp no change · 2008: 85.9pp · 2024: 86.1pp
- All cycles
- 2024: D+86.1 2020: D+86.8 2016: D+88.7 2012: D+84.2 2008: D+85.9
Not yet ingested
- Civics
- —
Market trends
- HPI YoY
- ▼ -852.61%
- Current HPI
- 396.6033
- Rent YoY
- ▼ -3.04%
- Metro
- Washington-Arlington-Alexandria, DC-VA-MD-WV
- State GDP YoY
- ▲ 1.33%
- F500 in state
- 6
Industry mix (Fortune 500 HQ in DC)
| Industry | F500 HQs | Revenue |
|---|---|---|
| Financial Services | 1 | $153B |
|
||
| Life Sciences / Industrials | 1 | $25B |
|
||
| Industrial Machinery | 1 | $8B |
|
||
Price history
+486.8% since first listed18 events — show timeline
- 2026-05-01 Relisted — BRIGHT MLS
- 2026-04-30 Listing Removed — BRIGHT MLS
- 2026-03-24 Relisted — BRIGHT MLS
- 2026-01-31 Pending — BRIGHT MLS
- 2026-01-30 Listing Removed — BRIGHT MLS
- 2026-01-12 Price Changed $399,000 BRIGHT MLS
- 2025-12-19 Price Changed $480,000 BRIGHT MLS
- 2025-10-02 Relisted — BRIGHT MLS
- 2025-09-30 Listing Removed — BRIGHT MLS
- 2025-04-04 Price Changed $525,000 BRIGHT MLS
- 2025-02-23 Listed $650,000 BRIGHT MLS
- 2025-02-07 Coming Soon $650,000 BRIGHT MLS
- 2025-02-02 Listing Removed — BRIGHT MLS
- 2025-01-31 Price Changed $724,900 BRIGHT MLS
- 2024-12-26 Price Changed $749,900 BRIGHT MLS
- 2024-12-01 Price Changed $774,900 BRIGHT MLS
- 2024-10-28 Listed $799,900 BRIGHT MLS
- 1990-12-12 Sold (Public Records) $68,000 Public Records
Property tax history
+16.2%/yrLatest (2025): $6,299 · +328.8% YoY. Source: county tax records.
Cash-flow waterfall
monthlySold comps — $/sqft
last 12 mo · ≤1 miLoading sold comps…