5010 Cornish St · Houston, TX
Flood risk 1/10 · Minimal
- FEMA flood zone
- X (unshaded)
- Chance of flooding over 30 yrs
- 0.0%
- Est. flood insurance / yr
- $507 – $1,088
Fire risk 1/10 · Minimal
- Est. fire insurance / yr
- $1,222 – $2,270
Heat risk 9/10 · Severe
- Hot days now (above 109°F)
- 7 days/yr
- Hot days in 30 yrs
- 24 days/yr
Wind risk 9/10 · Severe
- Chance of severe wind over 30 yrs
- 99.0%
Air-quality risk 3/10 · Minor
- Unhealthy air days now
- 2 days/yr
- Unhealthy air days in 30 yrs
- 3 days/yr
Risk factors via First Street. Map © Google.
Why this score? — see what drove the D grade
The composite is a weighted blend of 9 inputs, each scored 0–100. Each bar is that input's sub-score; the figure is the points it added to the 100-point composite (weight × sub-score).
- ARV discount +15.0/15.0
- Cash flow +8.5/30.0
- Livability +3.7/5.0
- 1% rule +3.4/10.0
- Schools +2.7/10.0
- Condition / age +2.5/5.0
- DSCR +2.3/10.0
- Rent growth +2.3/5.0
- Appreciation +0.0/10.0
$359,900
🖨 Deal sheet 📄 Offer letter ✓ Due diligence
Listing remarks MLS
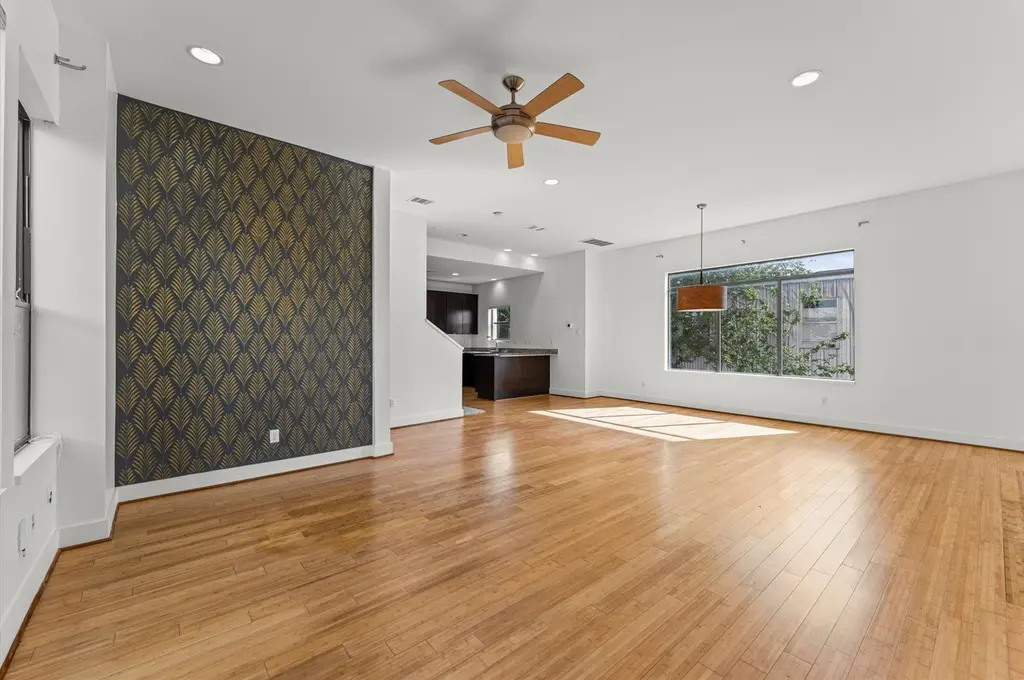
Welcome to 5010 Cornish St, a beautifully updated townhome in the heart of Houston’s highly sought-after Rice Military/Washington Corridor—featuring NO HOA and true move-in ready condition. Ideally located just minutes from Memorial Park, Downtown Houston This home has been refreshed with newly installed flooring throughout and offers a bright, open-concept layout with a spacious living area that’s perfect for both everyday living and entertaining. The kitchen flows into the main living and dining areas, providing both functionality and connectivity. Upstairs, the primary suite offers a custom-designed closet that adds exceptional storage. Additional bedrooms provide flexibility for guests, a home office ideal for today’s lifestyle needs. Whether you're a first-time buyer, investor, or looking for low-maintenance living in a prime location, this property is an exceptional opportunity.
Key facts
- Updated townhome
- Open-concept layout
- Home office
Tags
Neighborhood map
What this means for you Summary
Snapshot
- This is a 3-bed/2.5-bath single-family listed at $360k.
Deal economics
- At list price, monthly cash flow is $-319 ($-4k/yr) — negative.
- To cash-flow at today's rent, offer at most $303k (15.7% below list).
- To meet the 1% rule (rent ≥ 1% of price), the offer needs to be $302k (16.2% below list).
- Recommended offer: $302k (16.2% below list) — sets the bar for 1% rule.
- Cap rate 5.2% vs local median 3.2% in Houston — top-decile yield for the area; either an underpriced asset or a hidden risk that comps aren't pricing in. Stress-test before assuming the spread holds.
Location & tenants
- Location reads 74/100 on livability (#184 in TX, #4,771 nationally) — a middle-class / working-renter tenant base. Strengths: amenities A+, cost of living A+, housing A+; Watch: schools D, crime F.
- Houston ISD (urban): math 27% / reading 35% proficiency, ranked #593 of 826 in TX (top 72%) — families likely to look elsewhere, expect single-tenant / working-renter base with shorter leases; 71% free/reduced lunch — lower-income household profile, screen leases tightly.
- Market conditions: Rents soft (-0.8%/yr); 646 active listings in the ZIP; 40 comparable units currently listed for rent nearby; rentals leasing fast (median 11d on market — plan ~1-2 weeks tenant-placement turnaround); high-income renter base; 29,883 units permitted in Harris County in 2024 (8,621 in 5+ unit buildings).
Forward outlook
- Local home prices are declining (-3.0%/yr); year-one equity from $2k of loan paydown is wiped out by about $11k of value loss. Plan a longer hold.
- Harris County population projected at +47% by 2050 — long-run rental-demand tailwind backs the buy-and-hold thesis.
Negotiation context
- It's been on market 62 days — a 6% lower offer ($338k) is reasonable based on typical stale-listing flexibility.
- 7 sale attempts since 17y ago with the ask held roughly flat each time — persistent listings suggest the price (not the market) is what's stuck; bring a comps-based counter.
Risks & watch-outs
- Climate carrying-cost: severe wind risk, 99% chance of damaging wind over 30y; extreme-heat days projected 7→24/yr by 2055 (HVAC capex compounding) — expect insurance premiums to compound above CPI over the hold.
Questions for the listing agent
- What do current leases actually rent for vs. the listed asking? Can we see a recent rent roll and the last 12 months of T-12 income?
- It's been on market 62 days. Have you received any prior offers? Is the seller open to a 16% concession, seller financing, or rate buy-down credit?
- Why hasn't it sold? Are there any deal-killer items the seller is aware of (foundation, flood, title, zoning, code violations)?
- Is there a deadline driving the sale (1031 exchange, divorce, estate, relocation)? That informs how much negotiation room exists.
- Schools are D-rated, which usually means shorter tenancies and higher turnover. Who's the typical renter profile here, and what's been the actual vacancy rate?
- Crime grade is F in this area — have there been break-ins, vandalism, or insurance claims at this property in the last 3 years? What carrier currently insures it and at what premium?
- The area grade is low — what's the realistic commute time and amenity access for the typical tenant pool here? Any planned neighborhood developments (good or bad) we should know about?
- What's the average days-on-market for RENTAL listings here right now (not sales)? A rising rental-DOM trend means longer vacancies and softer asking-rent achievability than the comps imply.
- What's the recent tenant-quality profile in this submarket — average credit score on applications, eviction rate, late-payment / NSF rate, and stable-employment percentage? A property-management company in the area should have these aggregated.
- How much new for-sale + rental construction is in the pipeline within 1–3 miles? Heavy new supply typically softens prices + rents 12–24 months out; constrained supply supports both.
Investment metrics
- 1% rule
- 0.84% ✗
- Cap rate
- 5.23%
- Cash-on-cash
- -3.80%
- DSCR
- 0.83
- GRM
- 9.9
CMA / ARV
- ARV (median comp)
- $496,917
- List price
- $359,900
- Delta
- -27.57%
- Verdict
- UNDERPRICED
- Comps
- 20 within 1.0 mi
Show comp detail 12 sales within ~0.75 mi
| Address | Dist | Beds/Ba | Sqft | Sold | Price | $/sf | Match |
|---|---|---|---|---|---|---|---|
| 5228 Schuler St | 0.40mi | 3/3.5 | 1,926 (+4%) | 2mo | $495,000 | $257 | 70 |
| 5309 Eigel St | 0.37mi | 3/3.5 | 1,961 (+6%) | 2mo | $435,000 | $222 | 68 |
| 1393 Studer St | 0.43mi | 2/2.5 (-1) | 1,784 (-4%) | 2mo | $375,000 | $210 | 66 |
| 5416 Kansas St | 0.47mi | 3/3.5 | 1,918 (+3%) | 3mo | $479,000 | $250 | 66 |
| 5540 Nolda St | 0.54mi | 3/2.5 | 2,000 (+8%) | 1mo | $400,000 | $200 | 61 |
| 5224 Nett St Unit A | 0.47mi | 3/2.0 | 2,034 (+10%) | 4mo | $480,000 | $236 | 57 |
| 2103 Patterson St | 0.33mi | 3/3.5 | 2,124 (+14%) | 1mo | $455,000 | $214 | 56 |
| 1408 Asbury St | 0.51mi | 2/2.0 (-1) | 1,725 (-7%) | 4mo | $425,000 | $246 | 55 |
| 5307 Nett St Unit C | 0.53mi | 3/3.5 | 2,104 (+13%) | 1mo | $399,900 | $190 | 49 |
| 1506 Birdsall St | 0.54mi | 3/3.5 | 2,124 (+14%) | 1mo | $425,000 | $200 | 46 |
| 629 W 8th St | 0.66mi | 3/3.5 | 2,084 (+12%) | 2mo | $515,000 | $247 | 44 |
| 931 Alexander St | 0.68mi | 2/3.5 (-1) | 2,102 (+13%) | 1mo | $879,000 | $418 | 37 |
Match score weights: distance 35% · size 25% · config 20% · recency 20%. Top-matched comps best support the ARV.
Projected returns pro-forma
-3.0% appreciation · 0.0% rent growth · sell at horizon
- IRR
- -26.4%
- Equity multiple
- 0.13×
- Total profit
- $-87,321
- Equity at exit
- $53,662
- IRR
- -39.9%
- Equity multiple
- -0.35×
- Total profit
- $-135,666
- Equity at exit
- $31,118
Cash invested: $100,772 (down + closing). Projections, not guarantees.
Landlord ↔ Tenant lean methodology
- Overall (STATE)
- 87 Strongly Landlord-Friendly
- State Texas
- 87 Strongly Landlord-Friendly · R+5
- County
- — inherits STATE
- City
- — inherits STATE
ZIP-level market 77007
- Rents YoY
- -0.8%
- Active inventory
- 646
- Price-to-rent
- 9.9×
Monthly cashflow live
- Estimated rent
- $3,016 high interval (Pro) →
- Mortgage (P&I)
- −$1,887
- Tax from tax record
- −$665 /mo · $7,975/yr
- Insurance
- −$150
- HOA
- −$0
- Vacancy / Maint / Mgmt
- −$633
- Net cashflow
- $-319
Break-even live
UW: 25.0% down · 7.5% · 30yr · 1.5% tax · 5.0% vac · 8.0% maint · 8.0% mgmt
Financing live
Cash to close
- Down payment
- $89,975
- Closing costs
- $10,797
- Reserves months
- —
- Total cash needed
- —
Loan-product check · same deal, 3 products live
Conventional
25% down · 7.5% · 30yr
- Down + closing
- —
- Monthly P&I
- —
- Monthly cashflow
- —
- DSCR
- —
- Eligible?
- —
Personal DTI + credit; lowest rate.
DSCR
20% down · 8.5% · 30yr
- Down + closing
- —
- Monthly P&I
- —
- Monthly cashflow
- —
- DSCR
- —
- Eligible?
- —
No personal income docs; deal must DSCR.
Hard money
10% down · 12.0% · 12mo
- Down + closing
- —
- Monthly P&I
- —
- Monthly cashflow
- —
- DSCR
- —
- Eligible?
- —
Short-term bridge; refi at stabilization.
Rent comps 40 comps
| Address | Beds | Baths | Sqft | Rent | $/sqft | DOM | Units | Dist |
|---|---|---|---|---|---|---|---|---|
| 5108 Larkin St Houston, TX | 3.0 | 3.5 | 2108 | $2,850 | $1.35 | 44d | 1 | 0.07mi |
| 4917 Nolda St Houston, TX | 3.0 | 3.5 | 1764 | $5,000 | $2.83 | 24d | 1 | 0.21mi |
| 5235 Petty St Unit B Houston, TX | 3.0 | 2.5 | 2532 | $3,000 | $1.18 | 43d | 1 | 0.23mi |
| 1111 W 6th St Houston, TX | 2.0 | 1.0–2.0 | 861 | $2,591 | $3.01 | 2d | 30 | 0.27mi |
| 5336 Darling St Unit 1225767P Houston, TX | 3.0 | 3.0 | 2292 | $5,570 | $2.43 | 7d | 1 | 0.33mi |
| 4510 Inker St Houston, TX | 4.0 | 4.0 | 2293 | $4,500 | $1.96 | 43d | 1 | 0.39mi |
| 543 T C Jester Blvd Unit 1225766P Houston, TX | 3.0 | 3.5 | 2389 | $5,222 | $2.19 | 16d | 1 | 0.44mi |
| 4508 Maxie St Unit B Houston, TX | 3.0 | 1.0 | 1700 | $3,003 | $1.77 | 15d | 1 | 0.45mi |
| 2210 Radcliffe St Houston, TX | 3.0 | 3.5 | 2066 | $2,716 | $1.31 | 7d | 1 | 0.48mi |
| 5427 Kansas St Houston, TX | 3.0 | 4.0 | 2156 | $2,700 | $1.25 | 43d | 1 | 0.48mi |
| 230 T C Jester Blvd Unit 2174 Houston, TX | 2.0 | 2.0 | 1250 | $1,713 | $1.37 | 10d | 1 | 0.49mi |
| 230 T C Jester Blvd Unit 2187 Houston, TX | 2.0 | 2.0 | 1250 | $1,681 | $1.34 | 2d | 1 | 0.49mi |
| 230 T C Jester Blvd Unit 2162 Houston, TX | 2.0 | 2.0 | 1250 | $1,689 | $1.35 | 5d | 1 | 0.49mi |
| 230 T C Jester Blvd Unit 2148 Houston, TX | 2.0 | 2.0 | 1250 | $1,681 | $1.34 | 3d | 1 | 0.49mi |
| 4311 Marina St Houston, TX | 3.0 | 4.0 | 2328 | $3,599 | $1.55 | 43d | 1 | 0.49mi |
| 2103 Radcliffe St Unit 1225772P Houston, TX | 3.0 | 2.0 | 1797 | $4,729 | $2.63 | 7d | 1 | 0.50mi |
| 1717 Thompson St Houston, TX | 2.0 | 3.0 | 1250 | $2,200 | $1.76 | 43d | 1 | 0.50mi |
| 230 T C Jester Blvd Apt 422 Houston, TX | 2.0 | 2.0 | 1250 | $1,689 | $1.35 | 7d | 1 | 0.51mi |
| 230 T C Jester Blvd Unit 267 Houston, TX | 2.0 | 2.0 | 1250 | $1,714 | $1.37 | 43d | 1 | 0.51mi |
| 4608 Nett St Houston, TX | 3.0 | 4.0 | 2261 | $3,750 | $1.66 | 43d | 1 | 0.54mi |
| 5305 Nett St Unit A Houston, TX | 3.0 | 3.5 | 2104 | $2,950 | $1.40 | 24d | 1 | 0.56mi |
| 5237 Center St Houston, TX | 3.0 | 3.0 | 2284 | $2,995 | $1.31 | 43d | 1 | 0.58mi |
| 5610 Schuler St Houston, TX | 3.0 | 3.5 | 2614 | $3,111 | $1.19 | 5d | 1 | 0.60mi |
| 5454 Washington Ave Unit 5487 Houston, TX | 3.0 | 2.0 | 1444 | $2,726 | $1.89 | 11d | 1 | 0.60mi |
| 5454 Washington Ave Unit 525 Houston, TX | 3.0 | 2.0 | 1444 | $2,694 | $1.87 | 3d | 1 | 0.60mi |
| 4444 Center St Houston, TX | 3.0 | 3.0 | 2121 | $3,200 | $1.51 | 43d | 1 | 0.63mi |
| 5811 Maxie St Houston, TX | 3.0 | 3.5 | 2226 | $3,000 | $1.35 | 43d | 1 | 0.64mi |
| 1132 Patterson St Houston, TX | 2.0 | 2.0 | 1398 | $2,530 | $1.81 | 24d | 1 | 0.65mi |
| 4040 Koehler St Unit 2174 Houston, TX | 2.0 | 2.0 | 1273 | $2,084 | $1.64 | 10d | 1 | 0.69mi |
| 4040 Koehler St Unit 425 Houston, TX | 2.0 | 2.0 | 1273 | $2,052 | $1.61 | 3d | 1 | 0.69mi |
| 4040 Koehler St Unit 4077 Houston, TX | 2.0 | 2.0 | 1273 | $2,095 | $1.65 | 12d | 1 | 0.69mi |
| 4040 Koehler St Unit 422 Houston, TX | 2.0 | 2.0 | 1273 | $2,060 | $1.62 | 7d | 1 | 0.70mi |
| 4040 Koehler St Unit 2162 Houston, TX | 2.0 | 2.0 | 1273 | $2,060 | $1.62 | 5d | 1 | 0.70mi |
| 1221 Bonner St Houston, TX | 3.0 | 3.5 | 2252 | $3,200 | $1.42 | 43d | 1 | 0.71mi |
| 525 Yale St Houston, TX | 2.0 | 1.0–2.0 | 1017 | $3,345 | $3.29 | 1d | 41 | 0.77mi |
| 655 Yale St Houston, TX | 2.0 | 1.0–2.0 | 978 | $2,842 | $2.91 | 1d | 39 | 0.81mi |
| 920 Westcott St Houston, TX | 1.0–2.0 | 1.0–2.0 | 1175 | $3,306 | $2.81 | 1d | 29 | 0.83mi |
| 5732 Darling St Unit 1056419P Houston, TX | 3.0 | 3.5 | 2400 | $7,771 | $3.24 | 43d | 1 | 0.84mi |
| 929 Westcott St Houston, TX | 1.0–3.0 | 1.0–3.0 | 1375 | $9,263 | $6.74 | 3d | 22 | 0.92mi |
| 3990 Washington Ave Houston, TX | 1.0–2.0 | 1.0–2.0 | 1112 | $2,478 | $2.23 | 1d | 45 | 0.93mi |
Listing history 30 events
-
2026-06-10days on market $359,900 Active 62 DOM
-
2026-06-08days on market $359,900 Active 61 DOM
-
2026-06-07days on market $359,900 Active 60 DOM
-
2026-06-04days on market $359,900 Active 57 DOM
-
2026-06-01days on market $359,900 Active 54 DOM
-
2026-05-31days on market $359,900 Active 53 DOM
-
2026-04-08$359,900 Active 926-char remark
Show marketing remark (926 chars)
Welcome to 5010 Cornish St, a beautifully updated townhome in the heart of Houston’s highly sought-after Rice Military/Washington Corridor—featuring NO HOA and true move-in ready condition. Ideally located just minutes from Memorial Park, Downtown Houston This home has been refreshed with newly installed flooring throughout and offers a bright, open-concept layout with a spacious living area that’s perfect for both everyday living and entertaining. The kitchen flows into the main living and dining areas, providing both functionality and connectivity. Upstairs, the primary suite offers a custom-designed closet that adds exceptional storage. Additional bedrooms provide flexibility for guests, a home office ideal for today’s lifestyle needs. Whether you're a first-time buyer, investor, or looking for low-maintenance living in a prime location, this property is an exceptional opportunity.
-
2024-01-24historical $2,600
-
2023-12-20$2,600
-
2020-09-28historical
-
2020-09-28$2,500 Active
-
2019-12-03soldstatus
-
2019-12-02soldstatus Sold
-
2019-11-16status Pending
-
2019-11-11status Option Pending
-
2019-10-22price $335,000
-
2019-10-07$345,000 Active
-
2015-02-27soldstatus
-
2015-02-26soldstatus Sold
-
2015-01-28status Pending, Continue to Show
-
2015-01-21status Option Pending
-
2015-01-14$340,000 Active
-
2013-07-30soldstatus
-
2013-07-30soldstatus
-
2013-07-25soldstatus Sold
-
2013-06-24status Pending
-
2013-06-19$266,500 Active
-
2010-03-05soldstatus
-
2010-01-22historical
-
2009-11-29$259,000
ⓘ Source: listings_history table (triggers on properties + properties_extension) + one-shot
backfill from property_details.listing_events for pre-trigger history.
Tax reassessment forecast TX · Resets to sale price
- Current annual tax
- $7,975 · $665/mo
- Projected year-2 tax
- $7,975 · $665/mo
- Expected delta
- $0/yr ($0/mo · 0.0%)
ⓘ Screening estimate from a state-policy table — verify with the county assessor before closing.
Climate risk First Street
- Flood 1/10 Low FEMA zone X (unshaded) · 0% chance over 30 yrs
- Wildfire 1/10 Low
- Heat 9/10 Extreme 7 d/yr ≥109°F today · 24 d/yr by 30 yrs out
- Wind 9/10 Extreme 99% chance of damaging wind over 30 yrs
- Air quality 3/10 Moderate 2 unhealthy d/yr today · 3 by 30 yrs out
Nearby sold comps map
Loading sold comps map…
Walkable amenities ~0.75 mi
Loading nearby amenities…
Taxation est. · year 1
- Rental income
- $36,190
- − Mortgage interest
- −$20,160
- − Property taxes
- −$7,975
- − Insurance
- −$1,800
- − Repairs & maintenance
- −$2,895
- − Management
- −$2,895
- − Depreciation
- −$10,470
- Taxable loss
- −$10,005
- Est. tax savings @ 24.0%
- +$2,401
- After-tax cash flow
- $-1,431/yr
For passive investors: Depreciation is non-cash, so a rental often shows a tax loss while cash-flowing — sheltering income. Rental losses are passive: they offset passive income freely, and up to $25,000/yr can offset ordinary (W-2) income if you actively participate and your MAGI is under $100k (phasing out to $0 by $150k); unused losses carry forward. On sale, claimed depreciation is recaptured at up to 25%, and gains may owe capital-gains tax (a 1031 exchange can defer both). Figures are a year-1 estimate at your 24.0% rate — not tax advice; consult a CPA.
Schools (NCES district)
- District
- Houston ISD
- NCES district ID
- 4823640
- Math proficiency
- 27% ▼ -18.00%
- Reading proficiency
- 35% ▼ -6.00%
- Median HH income
- $46,054
- Composite
- 26.63/100
- National rank
- #7173
- State rank
- #593 of 826 in TX
Livability — Houston
- Score
- 74/100
- State rank
- #184
- US rank
- #4771
Category grades
Schools grade is shown separately in the Schools card above.
Census & demographics
- Census place
- Houston, TX
- County
- Harris County · 4,702,590 people
- City population
- 3,226,434
- Metro
- Houston-The Woodlands-Sugar Land, TX
- Population (ZIP)
- 47,808
- Household income
- $144,911
- Rent vs Own
- Severe rent burden
- 1812.0
Population outlook (Harris County) Hauer SSP2
- Today (2025)
- 5,571,493 people
- By 2030
- 6,089,821 · +9.3%
- By 2040
- 7,142,806 · +28.2%
- By 2050
- 8,185,864 · +46.9%
- By 2075
- 10,574,329 · +89.8%
- By 2100
- 12,109,958 · +117.4%
Race, ethnicity, and origin ACS 2023
- Neighborhood character
- Diverse neighborhood (Simpson 0.63)
- Race & ethnicity
- White 57% Hispanic / Latino 17% Two or more races 13% Asian 11% Black 9%
- Hispanic origin (detail)
- Mexican 12%
- Common ancestry
- Slovak 3% Romanian 3% Italian 3%
- Foreign-born
- 19% · Canada, China, South Korea
- Languages at home
- 75% English-only · Spanish 12% Other Indo-European 4% Chinese 2%
Political lean MEDSL · Harris
- 2024 margin
- Lean D (+5.5) · D 52.0% · R 46.4% · Other 1.6%
- 2008→2024 swing
- +3.9pp toward D · 2008: 1.6pp · 2024: 5.5pp
- All cycles
- 2024: D+5.5 2020: D+13.3 2016: D+12.4 2012: D+0.1 2008: D+1.6
Not yet ingested
- Civics
- —
Market trends
- HPI YoY
- ▼ -219.42%
- Current HPI
- 159.8157
- Rent YoY
- ▼ -0.83%
- Metro
- Houston-The Woodlands-Sugar Land, TX
- State GDP YoY
- ▲ 3.95%
- F500 in state
- 110
Industry mix (Fortune 500 HQ in TX)
| Industry | F500 HQs | Revenue |
|---|---|---|
| Energy | 16 | $1,198B |
|
||
| Technology | 5 | $198B |
|
||
| Engineering / Construction | 4 | $72B |
|
||
| Energy Services | 3 | $60B |
|
||
| Utilities | 3 | $41B |
|
||
| Healthcare | 2 | $330B |
|
||
Price history
+39.0% since first listed24 events — show timeline
- 2026-04-08 Listed $359,900 HARMLS
- 2024-01-24 Rental Removed $2,600 HARMLS
- 2023-12-20 Listed for Rent $2,600 HARMLS
- 2020-09-28 Listed $2,500 HARMLS
- 2020-09-28 Listing Removed — HARMLS
- 2019-12-03 Sold (Public Records) — Public Records
- 2019-12-02 Sold (MLS) — HARMLS
- 2019-11-16 Pending — HARMLS
- 2019-11-11 Pending — HARMLS
- 2019-10-22 Price Changed $335,000 HARMLS
- 2019-10-07 Listed $345,000 HARMLS
- 2015-02-27 Sold (Public Records) — Public Records
- 2015-02-26 Sold (MLS) — HARMLS
- 2015-01-28 Pending — HARMLS
- 2015-01-21 Pending — HARMLS
- 2015-01-14 Listed $340,000 HARMLS
- 2013-07-30 Sold (Public Records) — Public Records
- 2013-07-30 Sold (Public Records) — Public Records
- 2013-07-25 Sold (MLS) — HARMLS
- 2013-06-24 Pending — HARMLS
- 2013-06-19 Listed $266,500 HARMLS
- 2010-03-05 Sold (MLS) — HARMLS
- 2010-01-22 Listing Removed — HARMLS
- 2009-11-29 Listed $259,000 HARMLS
Property tax history
+13.4%/yrLatest (2025): $7,975 · +5.1% YoY. Source: county tax records.
Cash-flow waterfall
monthlySold comps — $/sqft
last 12 mo · ≤1 miLoading sold comps…