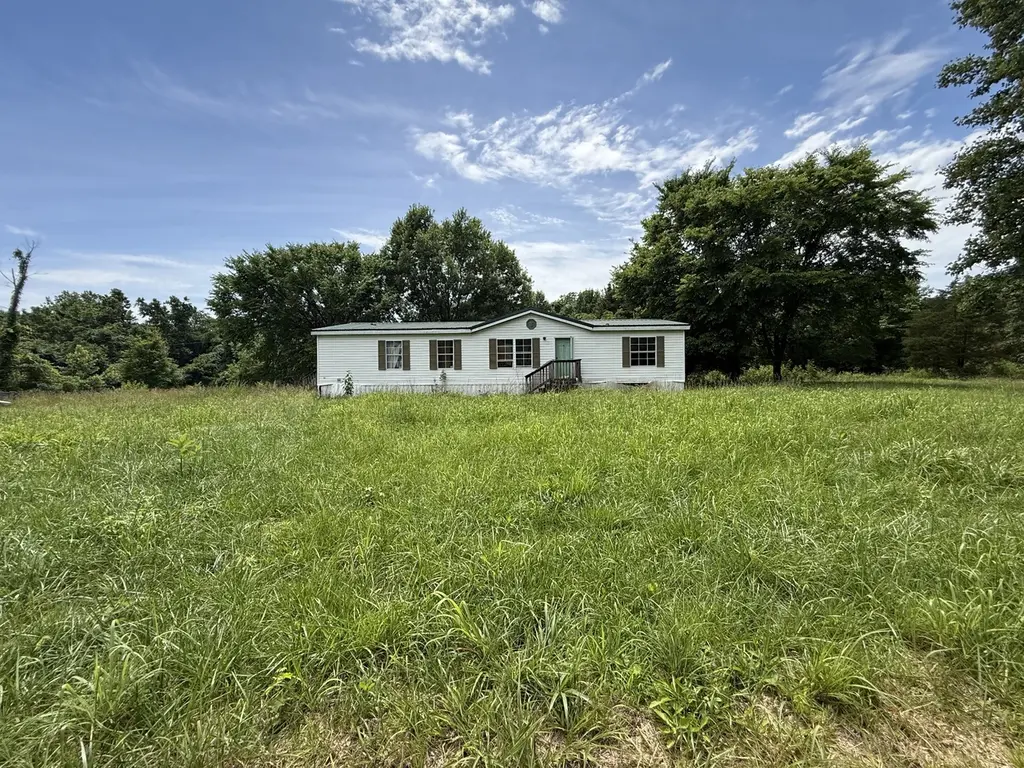
1271 Freeman Loop · Charlotte, TN
Flood risk 1/10 · Minimal
- FEMA flood zone
- X (unshaded)
- Chance of flooding over 30 yrs
- 0.0%
- Est. flood insurance / yr
- $507 – $1,088
Fire risk 4/10 · Minor
- Est. fire insurance / yr
- $949 – $1,763
Heat risk 5/10 · Moderate
- Hot days now (above 108°F)
- 7 days/yr
- Hot days in 30 yrs
- 19 days/yr
Wind risk 4/10 · Minor
- Chance of severe wind over 30 yrs
- 11.0%
Air-quality risk 1/10 · Minimal
- Unhealthy air days now
- 0 days/yr
- Unhealthy air days in 30 yrs
- 0 days/yr
Risk factors via First Street. Map © Google.
Why this score? — see what drove the C grade
The composite is a weighted blend of 9 inputs, each scored 0–100. Each bar is that input's sub-score; the figure is the points it added to the 100-point composite (weight × sub-score).
- Cash flow +19.0/30.0
- Appreciation +10.0/10.0
- ARV discount +7.5/15.0
- DSCR +6.0/10.0
- 1% rule +3.8/10.0
- Livability +3.2/5.0
- Schools +2.7/10.0
- Rent growth +2.5/5.0
- Condition / age +2.5/5.0
$150,000
🖨 Deal sheet 📄 Offer letter ✓ Due diligence
Listing remarks MLS
Here it’s sits!!! Privacy allows you to enjoy the county and wildlife!! Manufactured home in need of tlc, however it’s live able- or you can build your own dream house on top of the hill - you decide! Beautiful views
Key facts
- Dickson county
- Rural communities
- 5 acres
Tags
Property features AI
Finance
- Financial info: Annual tax reported
Exterior
- Parking: No covered or designated parking spaces reported
- Utilities: Private water source; Septic tank
- Home design: Residential mobile home; Single-story
- Construction: Vinyl siding; Steel roof; Existing structure
- Exterior features: 5-acre lot; Water available
Interior
- Kitchen: No appliances listed
- Bedrooms: 3 bedrooms, all on the main level
- Flooring: Other
- Bathrooms: 2 full bathrooms
- Heating & cooling: Central heating; Central air conditioning
- Interior features: No basement; Other flooring
- Laundry & utility: No washer/dryer or utility appliances listed
Neighborhood map
What this means for you Summary
Snapshot
- This is a 3-bed/2.0-bath single-family listed at $150k.
Deal economics
- At list price, monthly cash flow is $157 ($2k/yr) — positive.
- The deal already cash-flows at list — no discount required.
- To meet the 1% rule (rent ≥ 1% of price), the offer needs to be $132k (12.2% below list).
- Recommended offer: $132k (12.2% below list) — sets the bar for 1% rule.
- Cap rate 7.5% vs local median 2.5% in Charlotte — top-decile yield for the area; either an underpriced asset or a hidden risk that comps aren't pricing in. Stress-test before assuming the spread holds.
Location & tenants
- Location reads 65/100 on livability (#141 in TN) — a middle-class / working-renter tenant base. Strengths: cost of living A+, housing A+, crime B+; Watch: amenities F, commute F, employment D-.
- Dickson County (rural): math 30% / reading 33% proficiency, ranked #39 of 139 in TN (top 28%) — families likely to look elsewhere, expect single-tenant / working-renter base with shorter leases.
- Zoned schools: Charlotte Elementary (math 32% / reading 30%, grade F, #400 of 952 statewide, top 43%, 616 students, 0% FRL); Creek Wood High School (math 22% / reading 39%, grade F, #75 of 332 statewide, top 24%, 933 students, 0% FRL) — zoned schools average 0% FRL vs 45% district-wide (45 pts lower); this property's tenant base skews higher-income than the district average.
- Market conditions: 46 active listings in the ZIP; 376 units permitted in Dickson County in 2024 (5 in 5+ unit buildings).
Forward outlook
- In year one you build about $16k of equity ($1k loan paydown + $15k appreciation (10.0% local appreciation)).
- Dickson County population projected at +7% by 2050 — modest demand growth; plan on rents tracking national, not racing it.
- At projected returns (10.0% appreciation + 3.0% rent growth), your $42k cash investment doubles in ~3 years — after that, you're playing with house money.
- By year 3, paydown + projected appreciation supports a ~$41k cash-out refi (75% LTV) — recoverable capital for the next deal without selling this one.
Negotiation context
- Only 5 days on market — expect competitive offers; lowballing is unlikely to land.
- 2 sale attempts since 4y ago with the ask held roughly flat each time — persistent listings suggest the price (not the market) is what's stuck; bring a comps-based counter.
- Current owner paid $22k; list at $150k implies a 583% gain — meaningful room to come down on a strong offer.
Risks & watch-outs
- Climate carrying-cost: extreme-heat days projected 7→19/yr by 2055 (HVAC capex compounding) — expect insurance premiums to compound above CPI over the hold.
Questions for the listing agent
- Is there a deadline driving the sale (1031 exchange, divorce, estate, relocation)? That informs how much negotiation room exists.
- Schools are D-rated, which usually means shorter tenancies and higher turnover. Who's the typical renter profile here, and what's been the actual vacancy rate?
- What's the average days-on-market for RENTAL listings here right now (not sales)? A rising rental-DOM trend means longer vacancies and softer asking-rent achievability than the comps imply.
- What's the recent tenant-quality profile in this submarket — average credit score on applications, eviction rate, late-payment / NSF rate, and stable-employment percentage? A property-management company in the area should have these aggregated.
- How much new for-sale + rental construction is in the pipeline within 1–3 miles? Heavy new supply typically softens prices + rents 12–24 months out; constrained supply supports both.
Investment metrics
- 1% rule
- 0.88% ✗
- Cap rate
- 7.55%
- Cash-on-cash
- 4.49%
- DSCR
- 1.20
- GRM
- 9.5
CMA / ARV
No comps found within radius.
Projected returns pro-forma
10.0% appreciation · 3.0% rent growth · sell at horizon
- IRR
- 27.5%
- Equity multiple
- 3.18×
- Total profit
- $91,620
- Equity at exit
- $135,132
- IRR
- 24.0%
- Equity multiple
- 7.23×
- Total profit
- $261,794
- Equity at exit
- $291,417
Cash invested: $42,000 (down + closing). Projections, not guarantees.
Landlord ↔ Tenant lean methodology
- Overall (STATE)
- 87 Strongly Landlord-Friendly
- State Tennessee
- 87 Strongly Landlord-Friendly · R+13
- County
- — inherits STATE
- City
- — inherits STATE
ZIP-level market 37051
- Home prices YoY
- 10.0%
- Active inventory
- 46
- Price-to-rent
- 9.5×
Monthly cashflow live
- Estimated rent
- $1,317 medium interval (Pro) →
- Mortgage (P&I)
- −$787
- Tax from tax record
- −$34 /mo · $412/yr
- Insurance
- −$62
- HOA
- −$0
- Vacancy / Maint / Mgmt
- −$277
- Net cashflow
- $157
Break-even live
UW: 25.0% down · 7.5% · 30yr · 1.5% tax · 5.0% vac · 8.0% maint · 8.0% mgmt
Financing live
Cash to close
- Down payment
- $37,500
- Closing costs
- $4,500
- Reserves months
- —
- Total cash needed
- —
Loan-product check · same deal, 3 products live
Conventional
25% down · 7.5% · 30yr
- Down + closing
- —
- Monthly P&I
- —
- Monthly cashflow
- —
- DSCR
- —
- Eligible?
- —
Personal DTI + credit; lowest rate.
DSCR
20% down · 8.5% · 30yr
- Down + closing
- —
- Monthly P&I
- —
- Monthly cashflow
- —
- DSCR
- —
- Eligible?
- —
No personal income docs; deal must DSCR.
Hard money
10% down · 12.0% · 12mo
- Down + closing
- —
- Monthly P&I
- —
- Monthly cashflow
- —
- DSCR
- —
- Eligible?
- —
Short-term bridge; refi at stabilization.
Listing history 5 events
-
2026-06-13statusdays on market $150,000 Pending 5 DOM
-
2026-06-09days on market $150,000 Active 2 DOM
-
2026-06-08remarks 693-char remark
-
2026-06-08remarks 687-char remark
-
2026-06-08$150,000 Active 1 DOM
ⓘ Source: listings_history table (triggers on properties + properties_extension) + one-shot
backfill from property_details.listing_events for pre-trigger history.
Tax reassessment forecast TN · Resets to sale price
- Current annual tax
- $412 · $34/mo
- Projected year-2 tax
- $1,065 · $89/mo
- Expected delta
- +$653/yr (+$54/mo · 158.5%)
ⓘ Screening estimate from a state-policy table — verify with the county assessor before closing.
Climate risk First Street
- Flood 1/10 Low FEMA zone X (unshaded) · 0% chance over 30 yrs
- Wildfire 4/10 Moderate
- Heat 5/10 Major 7 d/yr ≥108°F today · 19 d/yr by 30 yrs out
- Wind 4/10 Moderate 11% chance of damaging wind over 30 yrs
- Air quality 1/10 Low 0 unhealthy d/yr today · 0 by 30 yrs out
Nearby sold comps map
Loading sold comps map…
Walkable amenities ~0.75 mi
Loading nearby amenities…
Taxation est. · year 1
- Rental income
- $15,804
- − Mortgage interest
- −$8,402
- − Property taxes
- −$412
- − Insurance
- −$750
- − Repairs & maintenance
- −$1,264
- − Management
- −$1,264
- − Depreciation
- −$4,364
- Taxable loss
- −$652
- Est. tax savings @ 24.0%
- +$157
- After-tax cash flow
- $2,041/yr
For passive investors: Depreciation is non-cash, so a rental often shows a tax loss while cash-flowing — sheltering income. Rental losses are passive: they offset passive income freely, and up to $25,000/yr can offset ordinary (W-2) income if you actively participate and your MAGI is under $100k (phasing out to $0 by $150k); unused losses carry forward. On sale, claimed depreciation is recaptured at up to 25%, and gains may owe capital-gains tax (a 1031 exchange can defer both). Figures are a year-1 estimate at your 24.0% rate — not tax advice; consult a CPA.
Schools (NCES district)
- District
- Dickson County
- NCES district ID
- 4701020
- Math proficiency
- 30% ▼ -15.00%
- Reading proficiency
- 33% ▼ -6.00%
- Median HH income
- $45,458
- Composite
- 27.01/100
- National rank
- #7064
- State rank
- #39 of 139 in TN
Livability — Charlotte
- Score
- 65/100
- State rank
- #141
- US rank
- #12873
Category grades
Schools grade is shown separately in the Schools card above.
Census & demographics
- Population (ZIP)
- 3,712
Population outlook (Dickson County) Hauer SSP2
- Today (2025)
- 55,013 people
- By 2030
- 56,448 · +2.6%
- By 2040
- 58,508 · +6.4%
- By 2050
- 59,076 · +7.4%
- By 2075
- 58,343 · +6.1%
- By 2100
- 52,900 · -3.8%
Race, ethnicity, and origin ACS 2023
- Neighborhood character
- Predominantly White (92%)
- Race & ethnicity
- White 92% Two or more races 4% Hispanic / Latino 3%
- Common ancestry
- Slovak 2% Italian 1% Serbian 1%
- Foreign-born
- 2%
- Languages at home
- 99% English-only · German/W. Germanic 1%
Political lean MEDSL · Dickson
- 2024 margin
- Solid R (+51.9) · D 23.5% · R 75.4% · Other 1.1%
- 2008→2024 swing
- -30.6pp toward R · 2008: -21.4pp · 2024: -51.9pp
- All cycles
- 2024: R+51.9 2020: R+47.4 2016: R+45.6 2012: R+28.4 2008: R+21.4
Not yet ingested
- Civics
- —
Market trends
- HPI YoY
- ▲ 31.81%
- Current HPI
- 348.65
- Rent YoY
- —
- Metro
- —
- State GDP YoY
- ▲ 2.78%
- F500 in state
- 22
Industry mix (Fortune 500 HQ in TN)
| Industry | F500 HQs | Revenue |
|---|---|---|
| Healthcare | 3 | $91B |
|
||
| Retail | 3 | $72B |
|
||
| Transportation / Logistics | 1 | $88B |
|
||
| Paper / Packaging | 1 | $19B |
|
||
| Insurance | 1 | $13B |
|
||
| Energy | 1 | $12B |
|
||
Price history
+583.4% since first listed7 events — show timeline
- 2026-06-07 Listed $150,000 REALTRACS as Distributed by MLS Grid
- 2022-12-31 Listing Removed — REALTRACS as Distributed by MLS Grid
- 2022-11-02 Price Changed $280,000 REALTRACS as Distributed by MLS Grid
- 2022-07-21 Price Changed $329,900 REALTRACS as Distributed by MLS Grid
- 2022-06-06 Listed $339,900 REALTRACS as Distributed by MLS Grid
- 2022-06-03 Coming Soon $339,900 REALTRACS as Distributed by MLS Grid
- 1998-05-19 Sold (Public Records) $21,950 Public Records
Property tax history
-2.9%/yrLatest (2025): $412 · +0.0% YoY. Source: county tax records.
Cash-flow waterfall
monthlySold comps — $/sqft
last 12 mo · ≤1 miLoading sold comps…