 Triplex
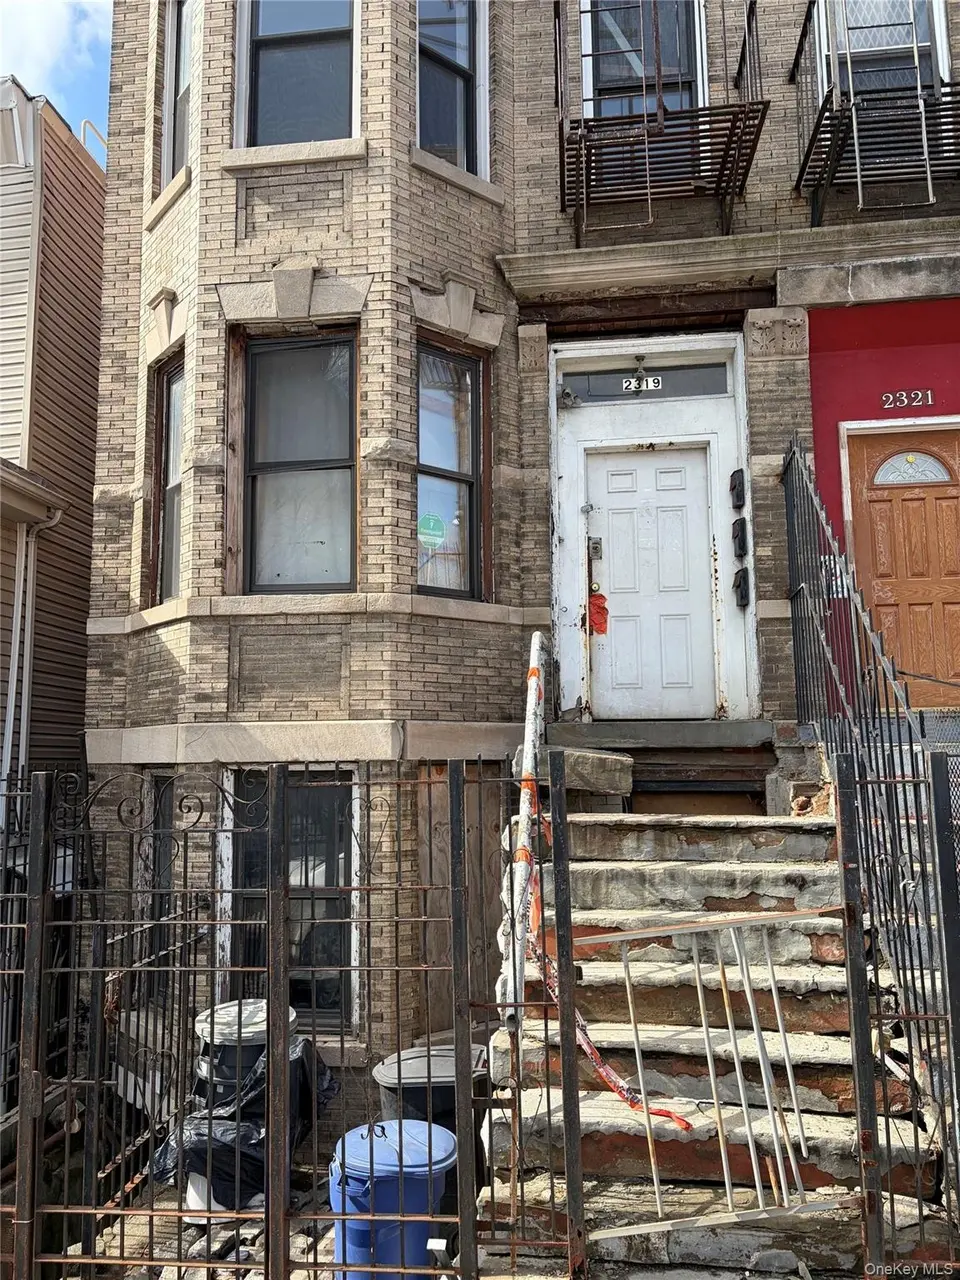
2319 Prospect Ave · New York, NY
Flood risk 5/10 · Moderate
- FEMA flood zone
- X (unshaded)
- Chance of flooding over 30 yrs
- 0.24%
- Est. flood insurance / yr
- $507 – $1,088
Fire risk 2/10 · Minimal
- Est. fire insurance / yr
- $691 – $1,283
Heat risk 6/10 · Moderate
- Hot days now (above 99°F)
- 7 days/yr
- Hot days in 30 yrs
- 15 days/yr
Wind risk 6/10 · Moderate
- Chance of severe wind over 30 yrs
- 27.0%
Air-quality risk 3/10 · Minor
- Unhealthy air days now
- 3 days/yr
- Unhealthy air days in 30 yrs
- 4 days/yr
Risk factors via First Street. Map © Google.
Why this score? — see what drove the A grade
The composite is a weighted blend of 9 inputs, each scored 0–100. Each bar is that input's sub-score; the figure is the points it added to the 100-point composite (weight × sub-score).
- Cash flow +30.0/30.0
- ARV discount +15.0/15.0
- DSCR +10.0/10.0
- 1% rule +9.2/10.0
- Appreciation +7.5/10.0
- Schools +5.0/10.0
- Rent growth +4.5/5.0
- Livability +3.8/5.0
- Condition / age +2.5/5.0
$650,000
🖨 Deal sheet 📄 Offer letter ✓ Due diligence
Multi-family units
County records classify this as Multi-Family (2-4 Unit). Listing-text estimate: 3 units. confirmed
Listing remarks
Calling all investors, developers, and builders! SHORT sALE! This development opportunity in an R7-1 zoned district is waiting for you. Don’t miss this rare investment gem located in the heart of the Belmont section of the The Bronx. This spacious three-family property features three residential units. Each floor offers two bedrooms, a living room, dining area, kitchen, and one full bathroom, providing a solid layout with strong potential for value-add improvements or redevelopment. Conveniently located near public transportation, shopping, schools, and major highways, the property offers easy access to surrounding areas and the rest of New York City. Bring your vision. This home is
Key facts
- Easy access
- R7-1 zoned district
- Solid layout
Tags
Property features AI
Exterior
- Parking: No carport; No dedicated parking
- Utilities: Electric service by Con-Edison; Public sewer
- Home design: Triplex
- Construction: Brownstone construction
- Exterior features: Brownstone construction; Not waterfront
Interior
- Kitchen: Eat-in kitchen(s)
- Bedrooms: Three 2-bedroom units
- Bathrooms: Three full bathrooms
- Heating & cooling: Oil heating; No central cooling
- Interior features: First-floor bedroom; First-floor full bathroom; Eat-in kitchen
Neighborhood map
What this means for you Summary
Snapshot
- This is a 3 × 2-bed/1.0-bath units multifamily listed at $650k.
Deal economics
- At list price, monthly cash flow is $3k ($39k/yr) — positive. Per door: $1k/mo.
- The deal already cash-flows at list — no discount required.
- Meets the 1% rule at list price ($9k rent vs $650k).
- Recommended offer: $611k (6.0% below list) — sets the bar for market timing.
- Cap rate 12.3% vs local median 2.6% in New York — top-decile yield for the area; either an underpriced asset or a hidden risk that comps aren't pricing in. Stress-test before assuming the spread holds.
Location & tenants
- Location reads 75/100 on livability (#268 in NY, #4,188 nationally) — a middle-class / working-renter tenant base. Strengths: amenities A+, commute A+, health & safety A; Watch: crime F, cost of living F.
- Market conditions: Rents rising fast (+8.0%/yr); 62 active listings in the ZIP; lower-income renter base — watch delinquency; 6,929 units permitted in Bronx County in 2024 (6,829 in 5+ unit buildings).
- At $9,220/mo this rent would consume 271% of the median local household income ($41k/yr) (locally 10274% of renters already pay >50% of income on rent) — very limited rent-growth headroom before tenants either downsize or default.
Forward outlook
- In year one you build about $37k of equity ($4k loan paydown + $33k appreciation (5.0% local appreciation)).
- Bronx County population projected at +21% by 2050 — long-run rental-demand tailwind backs the buy-and-hold thesis.
- At projected returns (5.0% appreciation + 8.0% rent growth), your $182k cash investment doubles in ~3 years — after that, you're playing with house money.
- By year 2, paydown + projected appreciation supports a ~$60k cash-out refi (75% LTV) — recoverable capital for the next deal without selling this one.
Negotiation context
- It's been on market 88 days — a 6% lower offer ($611k) is reasonable based on typical stale-listing flexibility.
- 7 sale attempts since 22y ago with the ask held roughly flat each time — persistent listings suggest the price (not the market) is what's stuck; bring a comps-based counter.
- Current owner paid $520k; 25% above their basis — modest negotiation headroom, anchor on the comps not their cost.
Risks & watch-outs
- Watch-outs: built in 1910 — expect roof / HVAC / electrical / plumbing capex.
- Climate carrying-cost: moderate flood risk; major wind risk, 27% chance of damaging wind over 30y; extreme-heat days projected 7→15/yr by 2055 (HVAC capex compounding) — expect insurance premiums to compound above CPI over the hold.
Questions for the listing agent
- It's been on market 88 days. Have you received any prior offers? Is the seller open to a 6% concession, seller financing, or rate buy-down credit?
- Can we see the unit-by-unit rent roll, current vacancy, and any below-market leases? What's the average tenancy length?
- What capital expenditures (roof, boiler, parking lot, exteriors) have been made in the last 5 years, and what's planned in the next 2?
- Built in 1910 — when were the roof, HVAC, electrical panel, plumbing, and water heater last replaced?
- Why hasn't it sold? Are there any deal-killer items the seller is aware of (foundation, flood, title, zoning, code violations)?
- Is there a deadline driving the sale (1031 exchange, divorce, estate, relocation)? That informs how much negotiation room exists.
- Schools are B-rated — typically a magnet for longer-tenancy family renters. What's the average tenant stay here, and is there a school-zone premium baked into asking?
- Crime grade is F in this area — have there been break-ins, vandalism, or insurance claims at this property in the last 3 years? What carrier currently insures it and at what premium?
- What's the average days-on-market for RENTAL listings here right now (not sales)? A rising rental-DOM trend means longer vacancies and softer asking-rent achievability than the comps imply.
- What's the recent tenant-quality profile in this submarket — average credit score on applications, eviction rate, late-payment / NSF rate, and stable-employment percentage? A property-management company in the area should have these aggregated.
- How much new apartment / multifamily construction is in the pipeline within 1–3 miles? Heavy new supply (>2% of stock underway) typically softens rents 12–24 months out; light construction supports rent growth.
Investment metrics
- 1% rule
- 1.42% ✓
- Cap rate
- 12.27%
- Cash-on-cash
- 21.34%
- DSCR
- 1.95
- GRM
- 5.9
CMA / ARV
- ARV (on-the-fly)
- $929,736
- Comps found
- 12
Show comp detail 12 sales within ~0.75 mi
| Address | Dist | Beds/Ba | Sqft | Sold | Price | $/sf | Match |
|---|---|---|---|---|---|---|---|
| 2304 Prospect Ave | 0.04mi | 6/2.0 | 2,390 (-10%) | 7mo | $750,000 | $314 | 71 |
| 741 E 181st St | 0.31mi | 7/4.0 (+1) | 2,625 (-2%) | 11mo | $998,000 | $380 | 65 |
| 2305 Bathgate Ave | 0.46mi | 7/3.0 (+1) | 2,652 (-0%) | 13mo | $849,999 | $321 | 62 |
| 729 E 182nd St | 0.17mi | 6/4.0 | 2,820 (+6%) | 24mo | $859,000 | $305 | 58 |
| 731 E 181 St | 0.31mi | 6/4.0 | 3,002 (+13%) | 4mo | $1,127,000 | $375 | 57 |
| 879 Elsmere Pl | 0.69mi | 7/4.0 (+1) | 2,700 (+1%) | 8mo | $1,020,000 | $378 | 50 |
| 818 E 179th St | 0.53mi | 5/4.0 (-1) | 2,725 (+2%) | 15mo | $950,000 | $349 | 50 |
| 766 E 179 St | 0.51mi | 6/2.5 | 2,793 (+5%) | 22mo | $850,000 | $304 | 48 |
| 2079 Honeywell Ave | 0.53mi | 5/3.0 (-1) | 2,368 (-11%) | 6mo | $1,180,000 | $498 | 47 |
| 2172 Clinton Ave | 0.21mi | 6/4.0 | 3,015 (+13%) | 22mo | $972,350 | $323 | 46 |
| 2077 Honeywell Ave | 0.53mi | 6/5.0 | 2,368 (-11%) | 6mo | $1,240,000 | $524 | 44 |
| 704 E 182nd St | 0.21mi | 7/4.5 (+1) | 3,045 (+14%) | 18mo | $950,000 | $312 | 40 |
Match score weights: distance 35% · size 25% · config 20% · recency 20%. Top-matched comps best support the ARV.
Projected returns pro-forma
5.03% appreciation · 8.0% rent growth · sell at horizon
- IRR
- 34.7%
- Equity multiple
- 3.23×
- Total profit
- $405,471
- Equity at exit
- $369,319
- IRR
- 35.4%
- Equity multiple
- 7.39×
- Total profit
- $1,163,861
- Equity at exit
- $638,200
Cash invested: $182,000 (down + closing). Projections, not guarantees.
Landlord ↔ Tenant lean methodology
- Overall (CITY)
- 0 Strongly Tenant-Friendly
- State New York
- 15 Strongly Tenant-Friendly · D+10
- County
- — inherits STATE
- City New York
- 0 Strongly Tenant-Friendly · D+34
ZIP-level market 10458
- Home prices YoY
- 3.0%
- Rents YoY
- 8.0%
- Active inventory
- 62
- Price-to-rent
- 17.6×
Monthly cashflow live
- Estimated rent
- $9,220 medium interval (Pro) →
- Mortgage (P&I)
- −$3,409
- Tax from tax record
- −$368 /mo · $4,411/yr
- Insurance
- −$271
- HOA
- −$0
- Vacancy / Maint / Mgmt
- −$1,936
- Net cashflow
- $3,237
Break-even live
3-unit breakdown (identical units grouped — click to expand)
| Units | Beds | Baths | Est. rent |
|---|---|---|---|
| 3× units | 2 | 1 | $9,219 |
| #1 | 2 | 1 | $3,073 |
| #2 | 2 | 1 | $3,073 |
| #3 | 2 | 1 | $3,073 |
| Total (3 units) | $9,220 | ||
UW: 25.0% down · 7.5% · 30yr · 1.5% tax · 5.0% vac · 8.0% maint · 8.0% mgmt
Financing live
Cash to close
- Down payment
- $162,500
- Closing costs
- $19,500
- Reserves months
- —
- Total cash needed
- —
Loan-product check · same deal, 3 products live
Conventional
25% down · 7.5% · 30yr
- Down + closing
- —
- Monthly P&I
- —
- Monthly cashflow
- —
- DSCR
- —
- Eligible?
- —
Personal DTI + credit; lowest rate.
DSCR
20% down · 8.5% · 30yr
- Down + closing
- —
- Monthly P&I
- —
- Monthly cashflow
- —
- DSCR
- —
- Eligible?
- —
No personal income docs; deal must DSCR.
Hard money
10% down · 12.0% · 12mo
- Down + closing
- —
- Monthly P&I
- —
- Monthly cashflow
- —
- DSCR
- —
- Eligible?
- —
Short-term bridge; refi at stabilization.
Listing history 32 events
-
2026-06-18days on market $650,000 Active 88 DOM
-
2026-06-17days on market $650,000 Active 87 DOM
-
2026-06-15days on market $650,000 Active 85 DOM
-
2026-06-13days on market $650,000 Active 83 DOM
-
2026-06-10days on market $650,000 Active 79 DOM
-
2026-06-08days on market $650,000 Active 78 DOM
-
2026-06-08days on market $650,000 Active 77 DOM
-
2026-06-04days on market $650,000 Active 74 DOM
-
2026-06-03days on market $650,000 Active 73 DOM
-
2026-06-01days on market $650,000 Active 71 DOM
-
2026-05-31days on market $650,000 Active 70 DOM
-
2026-03-22$650,000 Active
-
2014-09-29historical
-
2014-03-04historical
-
2014-03-03historical
-
2013-10-12price
-
2013-09-28$434,000
-
2013-09-03Active
-
2013-09-03$435,000
-
2006-06-20soldstatus $520,000
-
2006-05-30historical
-
2006-03-30historical
-
2005-12-07
-
2005-09-12
-
2005-07-28soldstatus $420,000
-
2005-02-23soldstatus $410,000
-
2004-12-23historical
-
2004-07-23
-
2004-05-27soldstatus $220,500
-
1998-10-19soldstatus $220,000
-
1994-09-22soldstatus $110,000
-
1987-11-30soldstatus $110,000
ⓘ Source: listings_history table (triggers on properties + properties_extension) + one-shot
backfill from property_details.listing_events for pre-trigger history.
Tax reassessment forecast NY · Partial reset (capped growth)
- Current annual tax
- $4,411 · $368/mo
- Projected year-2 tax
- $7,698 · $641/mo
- Expected delta
- +$3,287/yr (+$274/mo · 74.5%)
ⓘ Screening estimate from a state-policy table — verify with the county assessor before closing.
Climate risk First Street
- Flood 5/10 Major FEMA zone X (unshaded) · 24% chance over 30 yrs
- Wildfire 2/10 Low
- Heat 6/10 Major 7 d/yr ≥99°F today · 15 d/yr by 30 yrs out
- Wind 6/10 Major 27% chance of damaging wind over 30 yrs
- Air quality 3/10 Moderate 3 unhealthy d/yr today · 4 by 30 yrs out
Nearby sold comps map
Loading sold comps map…
Walkable amenities ~0.75 mi
Loading nearby amenities…
Taxation est. · year 1
- Rental income
- $110,640
- − Mortgage interest
- −$36,410
- − Property taxes
- −$4,411
- − Insurance
- −$3,250
- − Repairs & maintenance
- −$8,851
- − Management
- −$8,851
- − Depreciation
- −$18,909
- Taxable income
- $29,958
- Est. tax owed @ 24.0%
- −$7,190
- After-tax cash flow
- $31,651/yr
For passive investors: Depreciation is non-cash, so a rental often shows a tax loss while cash-flowing — sheltering income. Rental losses are passive: they offset passive income freely, and up to $25,000/yr can offset ordinary (W-2) income if you actively participate and your MAGI is under $100k (phasing out to $0 by $150k); unused losses carry forward. On sale, claimed depreciation is recaptured at up to 25%, and gains may owe capital-gains tax (a 1031 exchange can defer both). Figures are a year-1 estimate at your 24.0% rate — not tax advice; consult a CPA.
Schools (NCES district)
No district data.
Livability — New York
- Score
- 75/100
- State rank
- #268
- US rank
- #4188
Category grades
Schools grade is shown separately in the Schools card above.
Census & demographics
- Census place
- New York, NY
- County
- Bronx County · 1,197,324 people
- City population
- 7,731,280
- Metro
- New York-Newark-Jersey City, NY-NJ-PA
- Population (ZIP)
- 74,898
- Household income
- $40,800
- Rent vs Own
- Severe rent burden
- 10274.0
Population outlook (Bronx County) Hauer SSP2
- Today (2025)
- 1,607,353 people
- By 2030
- 1,681,852 · +4.6%
- By 2040
- 1,824,421 · +13.5%
- By 2050
- 1,945,470 · +21.0%
- By 2075
- 2,187,887 · +36.1%
- By 2100
- 2,244,136 · +39.6%
Race, ethnicity, and origin ACS 2023
- Neighborhood character
- Predominantly Hispanic (70%)
- Race & ethnicity
- Hispanic / Latino 70% Black 16% Two or more races 10% White 8% Asian 4% Native American 2%
- Hispanic origin (detail)
- Mexican 12% Puerto Rican 15% Dominican 34%
- Foreign-born
- 41% · Canada, Jamaica, South Korea
- Languages at home
- 30% English-only · Spanish 61% Other Indo-European 3% French/Haitian/Cajun 1%
Political lean MEDSL · Bronx
- 2024 margin
- Solid D (+45.4) · D 72.7% · R 27.3%
- 2008→2024 swing
- -32.3pp toward R · 2008: 77.8pp · 2024: 45.4pp
- All cycles
- 2024: D+45.4 2020: D+67.6 2016: D+79.1 2012: D+82.9 2008: D+77.8
Not yet ingested
- Civics
- —
Market trends
- HPI YoY
- ▲ 5.03%
- Current HPI
- 173.4217
- Rent YoY
- ▲ 8.04%
- Metro
- New York-Newark-Jersey City, NY-NJ-PA
- State GDP YoY
- ▲ 2.60%
- F500 in state
- 92
Industry mix (Fortune 500 HQ in NY)
| Industry | F500 HQs | Revenue |
|---|---|---|
| Financial Services | 10 | $950B |
|
||
| Consumer Goods | 9 | $162B |
|
||
| Insurance | 4 | $225B |
|
||
| Telecommunications | 2 | $144B |
|
||
| Pharmaceuticals | 2 | $112B |
|
||
| Media / Entertainment | 2 | $69B |
|
||
Price history
+490.9% since first listed21 events — show timeline
- 2026-03-22 Listed $650,000 OneKey® MLS as Distributed by MLS Grid
- 2014-09-29 Listing Removed — OneKey® MLS as Distributed by MLS Grid
- 2014-03-04 Delisted — HGMLS
- 2014-03-03 Listing Removed — OneKey® MLS as Distributed by MLS Grid
- 2013-10-12 Price Changed — HGMLS
- 2013-09-28 Listed $434,000 OneKey® MLS as Distributed by MLS Grid
- 2013-09-03 Listed — HGMLS
- 2013-09-03 Listed $435,000 OneKey® MLS as Distributed by MLS Grid
- 2006-06-20 Sold (Public Records) $520,000 Public Records
- 2006-05-30 Delisted — HGMLS
- 2006-03-30 Delisted — HGMLS
- 2005-12-07 Listed — HGMLS
- 2005-09-12 Listed — HGMLS
- 2005-07-28 Sold (Public Records) $420,000 Public Records
- 2005-02-23 Sold (Public Records) $410,000 Public Records
- 2004-12-23 Delisted — HGMLS
- 2004-07-23 Listed — HGMLS
- 2004-05-27 Sold (Public Records) $220,500 Public Records
- 1998-10-19 Sold (Public Records) $220,000 Public Records
- 1994-09-22 Sold (Public Records) $110,000 Public Records
- 1987-11-30 Sold (Public Records) $110,000 Public Records
Property tax history
+5.9%/yrLatest (2025): $4,411 · +3.9% YoY. Source: county tax records.
Cash-flow waterfall
monthlySold comps — $/sqft
last 12 mo · ≤1 miLoading sold comps…