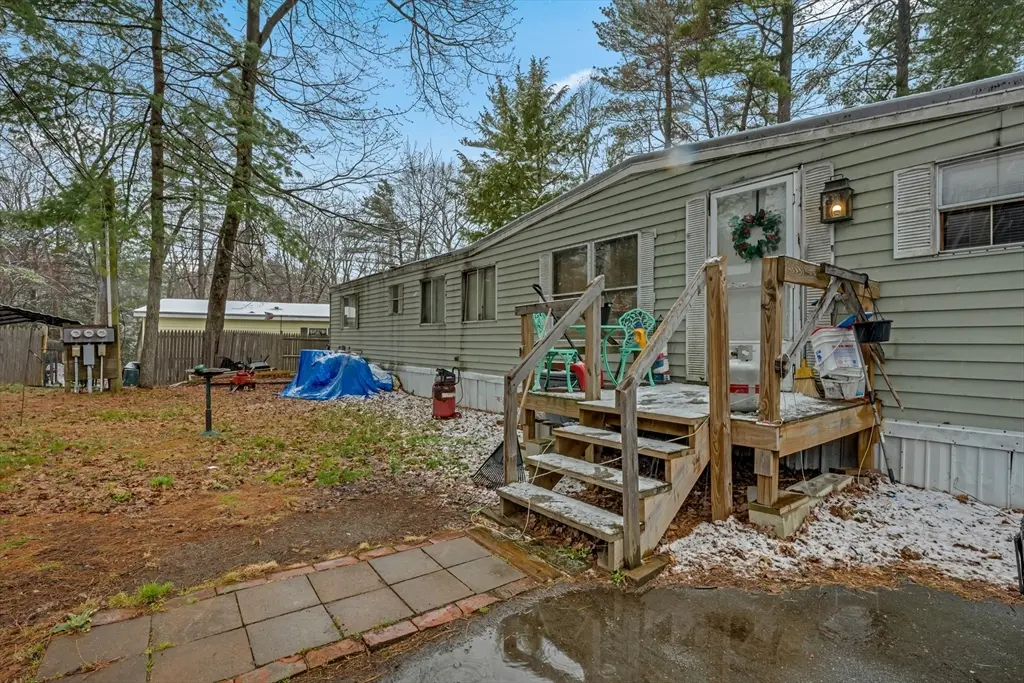
1790 Massachusetts Ave Lot V · Lunenburg, MA
Flood risk 1/10 · Minimal
- FEMA flood zone
- —
- Chance of flooding over 30 yrs
- 0.0%
- Est. flood insurance / yr
- —
Fire risk 2/10 · Minimal
- Est. fire insurance / yr
- $915 – $1,699
Heat risk 3/10 · Minor
- Hot days now (above 97°F)
- 7 days/yr
- Hot days in 30 yrs
- 16 days/yr
Wind risk 6/10 · Moderate
- Chance of severe wind over 30 yrs
- 27.0%
Air-quality risk 2/10 · Minimal
- Unhealthy air days now
- 1 days/yr
- Unhealthy air days in 30 yrs
- 1 days/yr
Risk factors via First Street. Map © Google.
Why this score? — see what drove the B+ grade
The composite is a weighted blend of 9 inputs, each scored 0–100. Each bar is that input's sub-score; the figure is the points it added to the 100-point composite (weight × sub-score).
- Cash flow +30.0/30.0
- ARV discount +15.0/15.0
- 1% rule +10.0/10.0
- DSCR +10.0/10.0
- Schools +4.5/10.0
- Livability +3.7/5.0
- Rent growth +2.5/5.0
- Condition / age +2.2/5.0
- Appreciation +0.0/10.0
$70,000
🖨 Deal sheet (PDF) 📄 Offer letter ✓ Due diligence
Listing remarks MLS
Embrace low-maintenance living and a more affordable lifestyle! A great opportunity to bring your vision and make this home your own.
Key facts
- 2 parking spots
- Built 1971
- Listed 67 days
Neighborhood map
What this means for you Summary
Snapshot
- This is a 2-bed/1.0-bath single-family listed at $70k. Condition is rated fair.
Deal economics
- At list price, monthly cash flow is $1k ($13k/yr) — positive.
- The deal already cash-flows at list — no discount required.
- Meets the 1% rule at list price ($2k rent vs $70k).
- Recommended offer: $66k (6.0% below list) — sets the bar for market timing.
- Cap rate 24.6% vs local median 1.9% in Lunenburg — top-decile yield for the area; either an underpriced asset or a hidden risk that comps aren't pricing in. Stress-test before assuming the spread holds.
Location & tenants
- Location reads 73/100 on livability (#105 in MA) — a middle-class / working-renter tenant base. Strengths: crime A+, employment A+, housing A+; Watch: amenities F, commute F, cost of living F.
- Lunenburg (suburban): math 42% / reading 55% proficiency, ranked #123 of 302 in MA (top 41%) — families likely to look elsewhere, expect single-tenant / working-renter base with shorter leases; only 14% free/reduced lunch — higher-income household profile.
- Market conditions: 26 active listings in the ZIP; 2,293 units permitted in Worcester County in 2024 (1,205 in 5+ unit buildings).
Forward outlook
- Local home prices are declining (-3.0%/yr); year-one equity from $484 of loan paydown is wiped out by about $2k of value loss. Plan a longer hold.
- At projected returns (-3.0% appreciation + 3.0% rent growth), your $20k cash investment doubles in ~2 years — after that, you're playing with house money.
Negotiation context
- It's been on market 67 days — a 6% lower offer ($66k) is reasonable based on typical stale-listing flexibility.
Risks & watch-outs
- Climate carrying-cost: major wind risk, 27% chance of damaging wind over 30y — expect insurance premiums to compound above CPI over the hold.
Questions for the listing agent
- It's been on market 67 days. Have you received any prior offers? Is the seller open to a 6% concession, seller financing, or rate buy-down credit?
- Have any recent inspections been done? Can we get a copy of the seller's disclosures and any deferred-maintenance estimates?
- Built in 1971 — when were the roof, HVAC, electrical panel, plumbing, and water heater last replaced?
- Why hasn't it sold? Are there any deal-killer items the seller is aware of (foundation, flood, title, zoning, code violations)?
- Is there a deadline driving the sale (1031 exchange, divorce, estate, relocation)? That informs how much negotiation room exists.
- Schools are B-rated — typically a magnet for longer-tenancy family renters. What's the average tenant stay here, and is there a school-zone premium baked into asking?
- What's the average days-on-market for RENTAL listings here right now (not sales)? A rising rental-DOM trend means longer vacancies and softer asking-rent achievability than the comps imply.
- What's the recent tenant-quality profile in this submarket — average credit score on applications, eviction rate, late-payment / NSF rate, and stable-employment percentage? A property-management company in the area should have these aggregated.
- How much new for-sale + rental construction is in the pipeline within 1–3 miles? Heavy new supply typically softens prices + rents 12–24 months out; constrained supply supports both.
Investment metrics
- 1% rule
- 2.81% ✓
- Cap rate
- 24.62%
- Cash-on-cash
- 65.45%
- DSCR
- 3.91
- GRM
- 3.0
CMA / ARV
- ARV (median comp)
- $111,288
- List price
- $70,000
- Delta
- -37.10%
- Verdict
- UNDERPRICED
- Comps
- 7 within 1.0 mi
Projected returns pro-forma
-3.0% appreciation · 3.0% rent growth · sell at horizon
- IRR
- 64.6%
- Equity multiple
- 3.90×
- Total profit
- $56,769
- Equity at exit
- $10,437
- IRR
- 69.0%
- Equity multiple
- 8.00×
- Total profit
- $137,221
- Equity at exit
- $6,052
Cash invested: $19,600 (down + closing). Projections, not guarantees.
Landlord ↔ Tenant lean methodology
- Overall (STATE)
- 20 Strongly Tenant-Friendly
- State Massachusetts
- 20 Strongly Tenant-Friendly · D+15
- County
- — inherits STATE
- City
- — inherits STATE
ZIP-level market 01462
- Home prices YoY
- -26.7%
- Active inventory
- 26
- Price-to-rent
- 3.0×
Monthly cashflow live
- Estimated rent
- $1,965 medium interval (Pro) →
- Mortgage (P&I)
- −$367
- Tax est. 1.5%
- −$88 /mo · $1,050/yr
- Insurance
- −$29
- HOA
- −$0
- Vacancy / Maint / Mgmt
- −$413
- Net cashflow
- $1,069
Break-even live
Sensitivity live
| Price | -10% $1,117 | -5% $1,093 | +0% $1,069 | +5% $1,045 | +10% $1,021 |
|---|---|---|---|---|---|
| Rent | -10% $914 | -5% $991 | +0% $1,069 | +5% $1,147 | +10% $1,224 |
| Rate | -1.0pp $1,104 | -0.5pp $1,087 | base $1,069 | +0.5pp $1,051 | +1.0pp $1,032 |
UW: 25.0% down · 7.5% · 30yr · 1.5% tax · 5.0% vac · 8.0% maint · 8.0% mgmt
Financing live
Cash to close
- Down payment
- $17,500
- Closing costs
- $2,100
- Reserves months
- —
- Total cash needed
- —
Loan-product check · same deal, 3 products live
Conventional
25% down · 7.5% · 30yr
- Down + closing
- —
- Monthly P&I
- —
- Monthly cashflow
- —
- DSCR
- —
- Eligible?
- —
Personal DTI + credit; lowest rate.
DSCR
20% down · 8.5% · 30yr
- Down + closing
- —
- Monthly P&I
- —
- Monthly cashflow
- —
- DSCR
- —
- Eligible?
- —
No personal income docs; deal must DSCR.
Hard money
10% down · 12.0% · 12mo
- Down + closing
- —
- Monthly P&I
- —
- Monthly cashflow
- —
- DSCR
- —
- Eligible?
- —
Short-term bridge; refi at stabilization.
Listing history 18 events
-
2026-06-18days on market $70,000 Active 67 DOM
-
2026-06-17days on market $70,000 Active 66 DOM
-
2026-06-16days on market $70,000 Active 65 DOM
-
2026-06-15days on market $70,000 Active 64 DOM
-
2026-06-14days on market $70,000 Active 62 DOM
-
2026-06-10days on market $70,000 Active 59 DOM
-
2026-06-09days on market $70,000 Active 58 DOM
-
2026-06-08days on market $70,000 Active 57 DOM
-
2026-06-07days on market $70,000 Active 56 DOM
-
2026-06-05days on market $70,000 Active 53 DOM
-
2026-06-03days on market $70,000 Active 52 DOM
-
2026-06-02days on market $70,000 Active 51 DOM
-
2026-06-01days on market $70,000 Active 50 DOM
-
2026-05-31days on market $70,000 Active 49 DOM
-
2026-05-31days on market $70,000 Active 48 DOM
-
2026-04-29price $70,000 133-char remark
Show marketing remark (133 chars)
Embrace low-maintenance living and a more affordable lifestyle! A great opportunity to bring your vision and make this home your own.
-
2026-04-28price $80,000 133-char remark
Show marketing remark (133 chars)
Embrace low-maintenance living and a more affordable lifestyle! A great opportunity to bring your vision and make this home your own.
-
2026-04-12$90,000 New 133-char remark
Show marketing remark (133 chars)
Embrace low-maintenance living and a more affordable lifestyle! A great opportunity to bring your vision and make this home your own.
ⓘ Source: listings_history table (triggers on properties + properties_extension) + one-shot
backfill from property_details.listing_events for pre-trigger history.
Climate risk First Street
- Flood 1/10 Low 0% chance over 30 yrs
- Wildfire 2/10 Low
- Heat 3/10 Moderate 7 d/yr ≥97°F today · 16 d/yr by 30 yrs out
- Wind 6/10 Major 27% chance of damaging wind over 30 yrs
- Air quality 2/10 Low 1 unhealthy d/yr today · 1 by 30 yrs out
Nearby sold comps map
Loading sold comps map…
Walkable amenities ~0.75 mi
Loading nearby amenities…
Taxation est. · year 1
- Rental income
- $23,586
- − Mortgage interest
- −$3,921
- − Property taxes
- −$1,050
- − Insurance
- −$350
- − Repairs & maintenance
- −$1,887
- − Management
- −$1,887
- − Depreciation
- −$2,036
- Taxable income
- $12,454
- Est. tax owed @ 24.0%
- −$2,989
- After-tax cash flow
- $9,838/yr
For passive investors: Depreciation is non-cash, so a rental often shows a tax loss while cash-flowing — sheltering income. Rental losses are passive: they offset passive income freely, and up to $25,000/yr can offset ordinary (W-2) income if you actively participate and your MAGI is under $100k (phasing out to $0 by $150k); unused losses carry forward. On sale, claimed depreciation is recaptured at up to 25%, and gains may owe capital-gains tax (a 1031 exchange can defer both). Figures are a year-1 estimate at your 24.0% rate — not tax advice; consult a CPA.
Condition & rehab AI · 12 photos
This home requires moderate renovations to improve its condition and increase its value. Key areas for improvement include the kitchen, exterior siding, and interior painting.
Repairs flagged
- Moderate Kitchen cabinets — Signs of wear and tear
- Moderate Kitchen appliances — Old and worn
- Moderate Exterior siding — Weathered and discolored
Value-add opportunities
- Both Paint interior walls — Fresh paint enhances curb appeal and interior aesthetics
- Both Replace kitchen cabinets and appliances — Modernizing the kitchen boosts both resale and rental value
- Both Landscaping and debris removal — Improved landscaping and removal of debris enhance curb appeal and attract potential buyers
Renovation cost estimate screening
| Repair item | Severity | Est. cost |
|---|---|---|
| Kitchen cabinets · Signs of wear and tear | Moderate | $3,000–15,000 |
| Kitchen appliances · Old and worn | Moderate | $3,000–15,000 |
| Exterior siding · Weathered and discolored | Moderate | $3,000–15,000 |
| Total estimated repair cost · 3 items | $9,000–45,000 |
Value-add ROI direction
- Both Paint interior walls — Fresh paint enhances curb appeal and interior aesthetics ↑
- Both Replace kitchen cabinets and appliances — Modernizing the kitchen boosts both resale and rental value ↑
- Both Landscaping and debris removal — Improved landscaping and removal of debris enhance curb appeal and attract potential buyers ↑
ⓘ Cost ranges are severity-bucket heuristics (US national rule-of-thumb). Get contractor quotes + a written scope before underwriting a rehab budget.
Schools (NCES district)
- District
- Lunenburg
- NCES district ID
- 2507080
- Math proficiency
- 42% ▼ -16.00%
- Reading proficiency
- 55% ▲ 4.00%
- Median HH income
- $83,464
- Composite
- 44.69/100
- National rank
- #2756
- State rank
- #123 of 302 in MA
Livability — Lunenburg
- Score
- 73/100
- State rank
- #105
- US rank
- #5377
Category grades
Schools grade is shown separately in the Schools card above.
Census & demographics
- City population
- 11,822
- Population (ZIP)
- 11,822
Population outlook (Worcester County) Hauer SSP2
- Today (2025)
- 850,858 people
- By 2030
- 860,403 · +1.1%
- By 2040
- 869,902 · +2.2%
- By 2050
- 869,110 · +2.1%
- By 2075
- 870,120 · +2.3%
- By 2100
- 829,703 · -2.5%
Race, ethnicity, and origin ACS 2023
- Neighborhood character
- Predominantly White (84%)
- Race & ethnicity
- White 84% Hispanic / Latino 7% Two or more races 4% Asian 3% Black 2%
- Hispanic origin (detail)
- Puerto Rican 1% Dominican 2%
- Common ancestry
- Lithuanian 9% Romanian 4% Slovak 2%
- Foreign-born
- 7% · Canada, Vietnam, China
- Languages at home
- 89% English-only · Spanish 4% Other Indo-European 3% Chinese 3%
Political lean MEDSL · Worcester
- 2024 margin
- D (+10.0) · D 53.9% · R 43.9% · Other 2.2%
- 2008→2024 swing
- -3.8pp toward R · 2008: 13.8pp · 2024: 10.0pp
- All cycles
- 2024: D+10.0 2020: D+17.8 2016: D+10.5 2012: D+9.2 2008: D+13.8
Not yet ingested
- Civics
- —
Market trends
- HPI YoY
- ▼ -101.86%
- Current HPI
- 279.6056
- Rent YoY
- —
- Metro
- —
- State GDP YoY
- ▲ 2.28%
- F500 in state
- 38
Industry mix (Fortune 500 HQ in MA)
| Industry | F500 HQs | Revenue |
|---|---|---|
| Technology | 3 | $17B |
|
||
| Insurance | 2 | $84B |
|
||
| Retail | 2 | $76B |
|
||
| Life Sciences | 1 | $43B |
|
||
| Energy Technology | 1 | $31B |
|
||
| Aerospace / Defense | 1 | $18B |
|
||
Price history
-22.2% since first listed3 events — show timeline
- 2026-04-29 Price Changed $70,000 MLS PIN
- 2026-04-28 Price Changed $80,000 MLS PIN
- 2026-04-12 Listed $90,000 MLS PIN
Cash-flow waterfall
monthlySold comps — $/sqft
last 12 mo · ≤1 miLoading sold comps…