 🏷️ Likely Rental
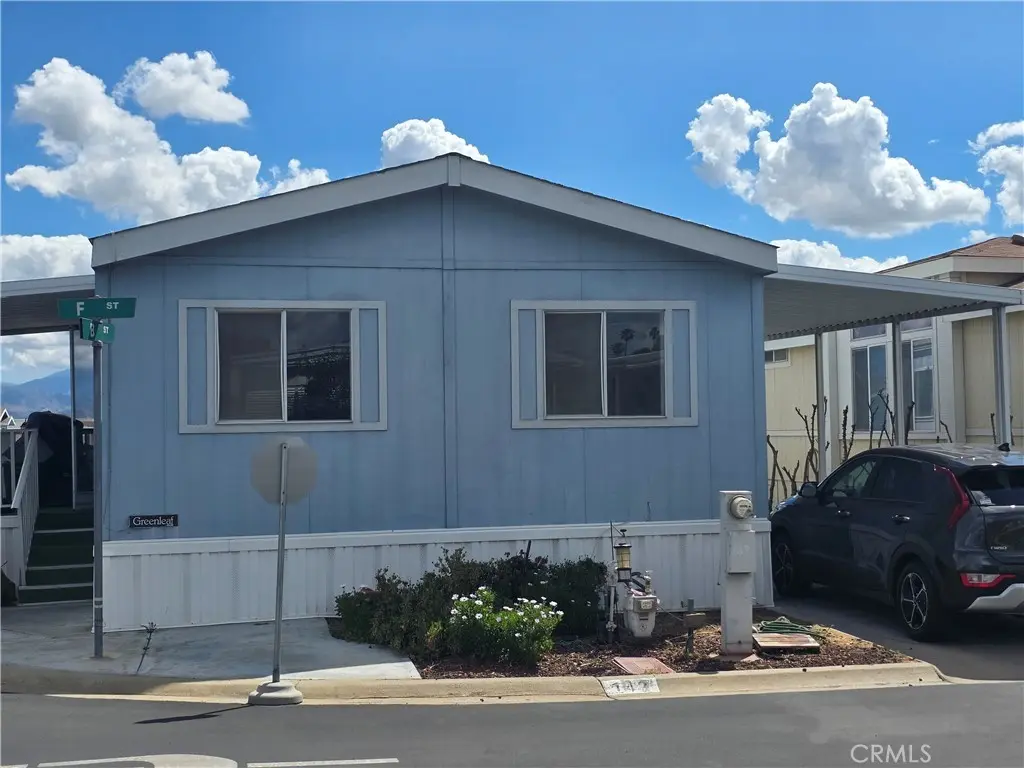
1010 Terrace Rd #142 · Rialto, CA
Flood risk 1/10 · Minimal
- FEMA flood zone
- X (unshaded)
- Chance of flooding over 30 yrs
- 0.0%
- Est. flood insurance / yr
- $507 – $1,088
Fire risk 2/10 · Minimal
- Est. fire insurance / yr
- $659 – $1,223
Heat risk 8/10 · Major
- Hot days now (above 102°F)
- 7 days/yr
- Hot days in 30 yrs
- 19 days/yr
Wind risk 1/10 · Minimal
- Chance of severe wind over 30 yrs
- —
Air-quality risk 10/10 · Severe
- Unhealthy air days now
- 25 days/yr
- Unhealthy air days in 30 yrs
- 31 days/yr
Risk factors via First Street. Map © Google.
Why this score? — see what drove the B+ grade
The composite is a weighted blend of 9 inputs, each scored 0–100. Each bar is that input's sub-score; the figure is the points it added to the 100-point composite (weight × sub-score).
- Cash flow +30.0/30.0
- ARV discount +15.0/15.0
- 1% rule +10.0/10.0
- DSCR +10.0/10.0
- Rent growth +3.9/5.0
- Schools +3.1/10.0
- Livability +3.0/5.0
- Condition / age +2.5/5.0
- Appreciation +0.0/10.0
$130,000
🖨 Deal sheet 📄 Offer letter ✓ Due diligence
Listing remarks MLS
Opportunity knocks in San Bernardino! Welcome to this charming, manufactured home located in the beautiful Ramrod Estates Senior Park. This home at Space 142 is perfect for buyers looking to add their personal touch and build instant equity. Featuring 2 bedrooms and 2 bathrooms, this doublewide home offers a functional layout with lots of natural light! An indoor laundry room, 2 spacious living areas, and a functional kitchen with separate dining area creates a welcoming space with plenty of potential. Step outside to a lovely outdoor area, ideal for relaxing, and enjoy the benefits of being located in one of the area’s most desirable senior communities. With low space rent of just $350 per month, and park amenities like a clubhouse, pool, spa, gym and a wonderful close-knit community, this property presents an incredible value rarely found in today’s market. Conveniently situated near shopping, dining, and major commuter routes, this home is perfect for those seeking both comfort and accessibility. With a little TLC, this hidden gem can truly shine making this the opportunity you have been waiting for! Don’t miss your chance to transform this diamond in the rough into something special—priced to sell and full of possibilities!
Key facts
- Community pool
- Built 1994
- Listed 66 days
Neighborhood map
What this means for you Summary
Snapshot
- This is a 2-bed/2.0-bath manufactured listed at $130k.
Deal economics
- At list price, monthly cash flow is $997 ($12k/yr) — positive.
- The deal already cash-flows at list — no discount required.
- Meets the 1% rule at list price ($2k rent vs $130k).
- Recommended offer: $122k (6.0% below list) — sets the bar for market timing.
- Cap rate 15.5% vs local median 3.5% in Rialto — top-decile yield for the area; either an underpriced asset or a hidden risk that comps aren't pricing in. Stress-test before assuming the spread holds.
Location & tenants
- Location reads 60/100 on livability (#598 in CA) — a middle-class / working-renter tenant base. Strengths: housing A+, commute A-; Watch: schools F, crime F, amenities D-.
- Rialto Unified (suburban): math 25% / reading 46% proficiency, ranked #268 of 517 in CA (top 52%) — families likely to look elsewhere, expect single-tenant / working-renter base with shorter leases; 74% free/reduced lunch — lower-income household profile, screen leases tightly.
- Market conditions: Rents rising fast (+5.5%/yr); 90 active listings in the ZIP; 7 comparable units currently listed for rent nearby; rentals at typical pace (median 24d on market — plan ~3-4 weeks tenant-placement turnaround); 43% of comp listings sitting > 30 days — soft ceiling on asking rent; 5,458 units permitted in San Bernardino County in 2024 (1,500 in 5+ unit buildings).
- At $2,235/mo this rent would consume 50% of the median local household income ($54k/yr) (locally 2569% of renters already pay >50% of income on rent) — very limited rent-growth headroom before tenants either downsize or default.
Forward outlook
- Local home prices are declining (-3.0%/yr); year-one equity from $899 of loan paydown is wiped out by about $4k of value loss. Plan a longer hold.
- San Bernardino County population projected at +15% by 2050 — modest demand growth; plan on rents tracking national, not racing it.
- At projected returns (-3.0% appreciation + 5.5% rent growth), your $36k cash investment doubles in ~4 years — after that, you're playing with house money.
Negotiation context
- It's been on market 67 days — a 6% lower offer ($122k) is reasonable based on typical stale-listing flexibility.
Risks & watch-outs
- Climate carrying-cost: extreme-heat days projected 7→19/yr by 2055 (HVAC capex compounding) — expect insurance premiums to compound above CPI over the hold.
Questions for the listing agent
- It's been on market 67 days. Have you received any prior offers? Is the seller open to a 6% concession, seller financing, or rate buy-down credit?
- Why hasn't it sold? Are there any deal-killer items the seller is aware of (foundation, flood, title, zoning, code violations)?
- Is there a deadline driving the sale (1031 exchange, divorce, estate, relocation)? That informs how much negotiation room exists.
- Schools are F-rated, which usually means shorter tenancies and higher turnover. Who's the typical renter profile here, and what's been the actual vacancy rate?
- Crime grade is F in this area — have there been break-ins, vandalism, or insurance claims at this property in the last 3 years? What carrier currently insures it and at what premium?
- What's the average days-on-market for RENTAL listings here right now (not sales)? A rising rental-DOM trend means longer vacancies and softer asking-rent achievability than the comps imply.
- What's the recent tenant-quality profile in this submarket — average credit score on applications, eviction rate, late-payment / NSF rate, and stable-employment percentage? A property-management company in the area should have these aggregated.
- How much new for-sale + rental construction is in the pipeline within 1–3 miles? Heavy new supply typically softens prices + rents 12–24 months out; constrained supply supports both.
Investment metrics
- 1% rule
- 1.72% ✓
- Cap rate
- 15.50%
- Cash-on-cash
- 32.87%
- DSCR
- 2.46
- GRM
- 4.8
CMA / ARV
- ARV (median comp)
- $173,669
- List price
- $130,000
- Delta
- -25.14%
- Verdict
- UNDERPRICED
- Comps
- 8 within 1.0 mi
Show comp detail 1 sale within ~0.75 mi
| Address | Dist | Beds/Ba | Sqft | Sold | Price | $/sf | Match |
|---|---|---|---|---|---|---|---|
| 1010 Terrace #127 | 0.00mi | 2/1.0 | 896 (-14%) | 4mo | $100,000 | $112 | 70 |
Match score weights: distance 35% · size 25% · config 20% · recency 20%. Top-matched comps best support the ARV.
Projected returns pro-forma
-3.0% appreciation · 5.5% rent growth · sell at horizon
- IRR
- 30.6%
- Equity multiple
- 2.32×
- Total profit
- $48,152
- Equity at exit
- $19,383
- IRR
- 39.1%
- Equity multiple
- 5.08×
- Total profit
- $148,399
- Equity at exit
- $11,240
Cash invested: $36,400 (down + closing). Projections, not guarantees.
Landlord ↔ Tenant lean methodology
- Overall (STATE)
- 18 Strongly Tenant-Friendly
- State California
- 18 Strongly Tenant-Friendly · D+13
- County
- — inherits STATE
- City
- — inherits STATE
ZIP-level market 92410
- Home prices YoY
- -9.7%
- Rents YoY
- 5.5%
- Active inventory
- 90
- Price-to-rent
- 4.8×
Monthly cashflow live
- Estimated rent
- $2,235 high interval (Pro) →
- Mortgage (P&I)
- −$682
- Tax from tax record
- −$33 /mo · $393/yr
- Insurance
- −$54
- HOA
- −$0
- Vacancy / Maint / Mgmt
- −$469
- Net cashflow
- $997
Break-even live
UW: 25.0% down · 7.5% · 30yr · 1.5% tax · 5.0% vac · 8.0% maint · 8.0% mgmt
Financing live
Cash to close
- Down payment
- $32,500
- Closing costs
- $3,900
- Reserves months
- —
- Total cash needed
- —
Loan-product check · same deal, 3 products live
Conventional
25% down · 7.5% · 30yr
- Down + closing
- —
- Monthly P&I
- —
- Monthly cashflow
- —
- DSCR
- —
- Eligible?
- —
Personal DTI + credit; lowest rate.
DSCR
20% down · 8.5% · 30yr
- Down + closing
- —
- Monthly P&I
- —
- Monthly cashflow
- —
- DSCR
- —
- Eligible?
- —
No personal income docs; deal must DSCR.
Hard money
10% down · 12.0% · 12mo
- Down + closing
- —
- Monthly P&I
- —
- Monthly cashflow
- —
- DSCR
- —
- Eligible?
- —
Short-term bridge; refi at stabilization.
Rent comps 7 comps
| Address | Beds | Baths | Sqft | Rent | $/sqft | DOM | Units | Dist |
|---|---|---|---|---|---|---|---|---|
| 870 E Morgan St Unit A Rialto, CA | 1.0 | 1.0 | 750 | $1,690 | $2.25 | 43d | 1 | 0.60mi |
| 619 N Gardena St San Bernardino, CA | 3.0 | 2.0 | 1000 | $2,900 | $2.90 | 5d | 1 | 1.14mi |
| 550 E Foothill Blvd Rialto, CA | 1.0–3.0 | 1.0–2.0 | 874 | $2,808 | $3.21 | 5d | 8 | 1.16mi |
| 249 E Jackson St Unit B Rialto, CA | 3.0 | 2.0 | 1427 | $2,965 | $2.08 | 5d | 1 | 1.34mi |
| 249 E Jackson St Unit C Rialto, CA | 3.0 | 2.0 | 1190 | $2,980 | $2.50 | 43d | 1 | 1.34mi |
| 555 Ramona Ave San Bernardino, CA | 1.0 | 1.0 | 724 | $1,650 | $2.28 | 43d | 1 | 1.43mi |
| 515 Ramona Ave San Bernardino, CA | 3.0 | 1.0 | 1040 | $2,095 | $2.01 | 24d | 1 | 1.45mi |
Listing history 15 events
-
2026-06-18days on market $130,000 Active 67 DOM
-
2026-06-17days on market $130,000 Active 66 DOM
-
2026-06-16days on market $130,000 Active 65 DOM
-
2026-06-15days on market $130,000 Active 64 DOM
-
2026-06-13days on market $130,000 Active 62 DOM
-
2026-06-13days on market $130,000 Active 61 DOM
-
2026-06-09days on market $130,000 Active 58 DOM
-
2026-06-08days on market $130,000 Active 57 DOM
-
2026-06-07days on market $130,000 Active 56 DOM
-
2026-06-04days on market $130,000 Active 53 DOM
-
2026-06-03days on market $130,000 Active 52 DOM
-
2026-06-02days on market $130,000 Active 51 DOM
-
2026-06-01days on market $130,000 Active 50 DOM
-
2026-05-31days on market $130,000 Active 49 DOM
-
2026-04-12$130,000 Active 1274-char remark
Show marketing remark (1274 chars)
Opportunity knocks in San Bernardino! Welcome to this charming, manufactured home located in the beautiful Ramrod Estates Senior Park. This home at Space 142 is perfect for buyers looking to add their personal touch and build instant equity. Featuring 2 bedrooms and 2 bathrooms, this doublewide home offers a functional layout with lots of natural light! An indoor laundry room, 2 spacious living areas, and a functional kitchen with separate dining area creates a welcoming space with plenty of potential. Step outside to a lovely outdoor area, ideal for relaxing, and enjoy the benefits of being located in one of the area’s most desirable senior communities. With low space rent of just $350 per month, and park amenities like a clubhouse, pool, spa, gym and a wonderful close-knit community, this property presents an incredible value rarely found in today’s market. Conveniently situated near shopping, dining, and major commuter routes, this home is perfect for those seeking both comfort and accessibility. With a little TLC, this hidden gem can truly shine making this the opportunity you have been waiting for! Don’t miss your chance to transform this diamond in the rough into something special—priced to sell and full of possibilities!
ⓘ Source: listings_history table (triggers on properties + properties_extension) + one-shot
backfill from property_details.listing_events for pre-trigger history.
Tax reassessment forecast CA · Resets to sale price
- Current annual tax
- $393 · $33/mo
- Projected year-2 tax
- $988 · $82/mo
- Expected delta
- +$595/yr (+$50/mo · 151.3%)
ⓘ Screening estimate from a state-policy table — verify with the county assessor before closing.
Climate risk First Street
- Flood 1/10 Low FEMA zone X (unshaded) · 0% chance over 30 yrs
- Wildfire 2/10 Low
- Heat 8/10 Severe 7 d/yr ≥102°F today · 19 d/yr by 30 yrs out
- Wind 1/10 Low
- Air quality 10/10 Extreme 25 unhealthy d/yr today · 31 by 30 yrs out
Nearby sold comps map
Loading sold comps map…
Walkable amenities ~0.75 mi
Loading nearby amenities…
Taxation est. · year 1
- Rental income
- $26,820
- − Mortgage interest
- −$7,282
- − Property taxes
- −$393
- − Insurance
- −$650
- − Repairs & maintenance
- −$2,146
- − Management
- −$2,146
- − Depreciation
- −$3,782
- Taxable income
- $10,422
- Est. tax owed @ 24.0%
- −$2,501
- After-tax cash flow
- $9,463/yr
For passive investors: Depreciation is non-cash, so a rental often shows a tax loss while cash-flowing — sheltering income. Rental losses are passive: they offset passive income freely, and up to $25,000/yr can offset ordinary (W-2) income if you actively participate and your MAGI is under $100k (phasing out to $0 by $150k); unused losses carry forward. On sale, claimed depreciation is recaptured at up to 25%, and gains may owe capital-gains tax (a 1031 exchange can defer both). Figures are a year-1 estimate at your 24.0% rate — not tax advice; consult a CPA.
Schools (NCES district)
- District
- Rialto Unified
- NCES district ID
- 0632370
- Math proficiency
- 25% ▲ 3.00%
- Reading proficiency
- 46% ▲ 10.00%
- Median HH income
- $50,916
- Composite
- 30.77/100
- National rank
- #6154
- State rank
- #268 of 517 in CA
Livability — Rialto
- Score
- 60/100
- State rank
- #598
- US rank
- #19283
Category grades
Schools grade is shown separately in the Schools card above.
Census & demographics
- Census place
- Rialto, CA
- County
- San Bernardino County · 2,030,291 people
- City population
- 105,208
- Metro
- Riverside-San Bernardino-Ontario, CA
- Population (ZIP)
- 47,869
- Household income
- $54,181
- Rent vs Own
- Severe rent burden
- 2569.0
Population outlook (San Bernardino County) Hauer SSP2
- Today (2025)
- 2,300,329 people
- By 2030
- 2,378,907 · +3.4%
- By 2040
- 2,523,137 · +9.7%
- By 2050
- 2,642,388 · +14.9%
- By 2075
- 2,880,769 · +25.2%
- By 2100
- 2,909,436 · +26.5%
Race, ethnicity, and origin ACS 2023
- Neighborhood character
- Predominantly Hispanic (80%)
- Race & ethnicity
- Hispanic / Latino 80% Two or more races 12% Black 8% White 7% Asian 3%
- Hispanic origin (detail)
- Mexican 70%
- Common ancestry
- Romanian 0%
- Foreign-born
- 29% · Canada, Vietnam, Jamaica
- Languages at home
- 32% English-only · Spanish 65% Vietnamese 1%
Political lean MEDSL · San Bernardino
- 2024 margin
- Toss-up / Even · D 47.5% · R 49.7% · Other 2.8%
- 2008→2024 swing
- -8.5pp toward R · 2008: 6.3pp · 2024: -2.1pp
- All cycles
- 2024: R+2.1 2020: D+10.7 2016: D+9.8 2012: D+5.4 2008: D+6.3
Not yet ingested
- Civics
- —
Market trends
- HPI YoY
- ▼ -54.39%
- Current HPI
- 504.0299
- Rent YoY
- ▲ 5.50%
- Metro
- Riverside-San Bernardino-Ontario, CA
- State GDP YoY
- ▲ 3.21%
- F500 in state
- 116
Industry mix (Fortune 500 HQ in CA)
| Industry | F500 HQs | Revenue |
|---|---|---|
| Technology | 27 | $1,492B |
|
||
| Financial Services | 3 | $174B |
|
||
| Retail | 3 | $44B |
|
||
| Insurance | 3 | $26B |
|
||
| Media / Entertainment | 2 | $115B |
|
||
| Pharmaceuticals / Biotech | 2 | $62B |
|
||
Price history
1 event — show timeline
- 2026-04-12 Listed $130,000 CRMLS
Property tax history
+0.2%/yrLatest (2025): $393 · +1.8% YoY. Source: county tax records.
Cash-flow waterfall
monthlySold comps — $/sqft
last 12 mo · ≤1 miLoading sold comps…