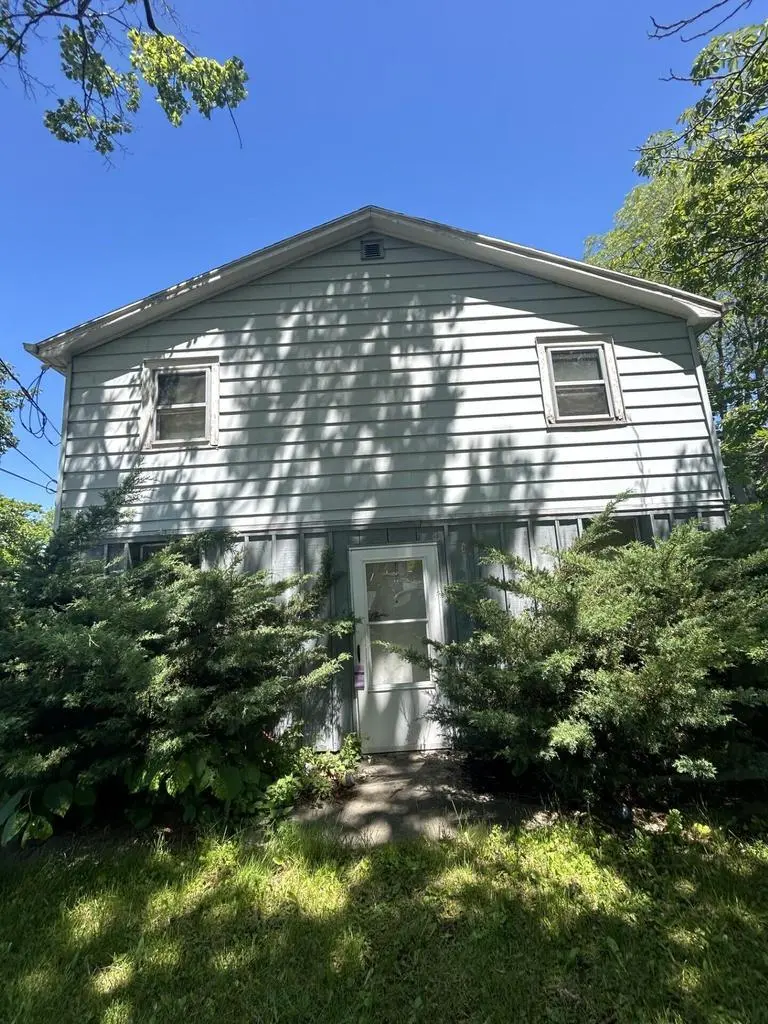
2026 E Leroy Ave · St. Francis, WI
Flood risk 3/10 · Minor
- FEMA flood zone
- X (unshaded)
- Chance of flooding over 30 yrs
- 0.2%
- Est. flood insurance / yr
- $507 – $1,088
Fire risk 1/10 · Minimal
- Est. fire insurance / yr
- $636 – $1,182
Heat risk 2/10 · Minimal
- Hot days now (above 96°F)
- 7 days/yr
- Hot days in 30 yrs
- 13 days/yr
Wind risk 2/10 · Minimal
- Chance of severe wind over 30 yrs
- —
Air-quality risk 3/10 · Minor
- Unhealthy air days now
- 3 days/yr
- Unhealthy air days in 30 yrs
- 3 days/yr
Risk factors via First Street. Map © Google.
Why this score? — see what drove the B- grade
The composite is a weighted blend of 9 inputs, each scored 0–100. Each bar is that input's sub-score; the figure is the points it added to the 100-point composite (weight × sub-score).
- Cash flow +23.7/30.0
- ARV discount +15.0/15.0
- 1% rule +8.0/10.0
- DSCR +7.6/10.0
- Rent growth +3.5/5.0
- Livability +2.5/5.0
- Condition / age +2.5/5.0
- Schools +2.2/10.0
- Appreciation +0.0/10.0
$210,000
🖨 Deal sheet 📄 Offer letter ✓ Due diligence
Listing remarks MLS
Property is being sold ''AS IS'' with no warranties to condition. Property is owned by Milwaukee County. Approval of offer and sale is subject to approval of County Executive, County Comptroller and individual from the Intergovernmental Cooperation Council (ICC).
Key facts
- 0.78 acre lot
- 2 garage spots
- Built 1926
Neighborhood map
What this means for you Summary
Snapshot
- This is a 4-bed/2.0-bath single-family listed at $210k.
Deal economics
- At list price, monthly cash flow is $401 ($5k/yr) — positive.
- The deal already cash-flows at list — no discount required.
- Meets the 1% rule at list price ($3k rent vs $210k).
- Recommended offer: $197k (6.0% below list) — sets the bar for market timing.
- Cap rate 8.6% vs local median 0.7% in St. Francis — top-decile yield for the area; either an underpriced asset or a hidden risk that comps aren't pricing in. Stress-test before assuming the spread holds.
Location & tenants
- Location reads: area grade B — affects rentability + tenant quality, not the cash-flow math above.
- Saint Francis School District (suburban): math 22% / reading 29% proficiency, ranked #311 of 342 in WI (top 91%) — low school quality limits family demand, transient renter base, plan for 1-2y turnover.
- Market conditions: Rents rising (+3.9%/yr); 51 active listings in the ZIP; 5 comparable units currently listed for rent nearby; rentals lingering (median 44d on market — plan ~5-8 weeks vacancy on turnover, expect pricing pressure); 60% of comp listings sitting > 30 days — soft ceiling on asking rent; 1,017 units permitted in Milwaukee County in 2024 (803 in 5+ unit buildings).
- At $2,733/mo this rent would consume 57% of the median local household income ($57k/yr) (locally 646% of renters already pay >50% of income on rent) — very limited rent-growth headroom before tenants either downsize or default.
Forward outlook
- Local home prices are declining (-3.0%/yr); year-one equity from $1k of loan paydown is wiped out by about $6k of value loss. Plan a longer hold.
- Milwaukee County population projected at +4% by 2050 — modest demand growth; plan on rents tracking national, not racing it.
Negotiation context
- It's been on market 70 days — a 6% lower offer ($197k) is reasonable based on typical stale-listing flexibility.
Risks & watch-outs
- Watch-outs: property tax is 3.3% of price; built in 1926 — expect roof / HVAC / electrical / plumbing capex.
Questions for the listing agent
- It's been on market 70 days. Have you received any prior offers? Is the seller open to a 6% concession, seller financing, or rate buy-down credit?
- Built in 1926 — when were the roof, HVAC, electrical panel, plumbing, and water heater last replaced?
- Property tax is high relative to price — has the assessment been appealed recently, and will the sale trigger a re-assessment?
- Why hasn't it sold? Are there any deal-killer items the seller is aware of (foundation, flood, title, zoning, code violations)?
- Is there a deadline driving the sale (1031 exchange, divorce, estate, relocation)? That informs how much negotiation room exists.
- What's the average days-on-market for RENTAL listings here right now (not sales)? A rising rental-DOM trend means longer vacancies and softer asking-rent achievability than the comps imply.
- What's the recent tenant-quality profile in this submarket — average credit score on applications, eviction rate, late-payment / NSF rate, and stable-employment percentage? A property-management company in the area should have these aggregated.
- How much new for-sale + rental construction is in the pipeline within 1–3 miles? Heavy new supply typically softens prices + rents 12–24 months out; constrained supply supports both.
Investment metrics
- 1% rule
- 1.30% ✓
- Cap rate
- 8.58%
- Cash-on-cash
- 8.18%
- DSCR
- 1.36
- GRM
- 6.4
CMA / ARV
- ARV (median comp)
- $367,601
- List price
- $210,000
- Delta
- -42.87%
- Verdict
- UNDERPRICED
- Comps
- 20 within 1.0 mi
Show comp detail 12 sales within ~0.75 mi
| Address | Dist | Beds/Ba | Sqft | Sold | Price | $/sf | Match |
|---|---|---|---|---|---|---|---|
| 4459 S New York Ave | 0.40mi | 3/2.0 (-1) | 2,058 (+2%) | 2mo | $325,000 | $158 | 71 |
| 3718 S Iowa Ave | 0.64mi | 5/1.5 (+1) | 2,048 (+2%) | 3mo | $280,000 | $137 | 58 |
| 3704 S Rutland Ave | 0.66mi | 4/1.5 | 2,006 (-0%) | 13mo | $405,000 | $202 | 56 |
| 3674 S Ahmedi Ave | 0.69mi | 4/1.5 | 2,153 (+7%) | 4mo | $379,900 | $176 | 51 |
| 2805 E Cudahy Ave | 0.66mi | 3/1.5 (-1) | 2,067 (+2%) | 9mo | $329,900 | $160 | 51 |
| 4043 S Kansas Ave | 0.29mi | 4/2.0 | 1,742 (-14%) | 17mo | $125,000 | $72 | 50 |
| 1857 E Leroy Ave | 0.12mi | 3/1.5 (-1) | 1,748 (-13%) | 19mo | $293,000 | $168 | 49 |
| 4450 S Whitnall Ave | 0.32mi | 3/2.0 (-1) | 2,200 (+9%) | 19mo | $327,000 | $149 | 49 |
| 2921 E Van Norman Ave | 0.64mi | 3/1.5 (-1) | 1,976 (-2%) | 19mo | $290,000 | $147 | 44 |
| 3210 E Denton Ave | 0.74mi | 4/1.5 | 1,922 (-5%) | 15mo | $350,000 | $182 | 43 |
| 4028 S Kinnickinnic Ave | 0.59mi | 3/2.0 (-1) | 1,845 (-8%) | 20mo | $300,000 | $163 | 36 |
| 3700 S Rutland Ave | 0.67mi | 4/3.0 | 2,278 (+13%) | 22mo | $372,000 | $163 | 25 |
Match score weights: distance 35% · size 25% · config 20% · recency 20%. Top-matched comps best support the ARV.
Projected returns pro-forma
-3.0% appreciation · 3.88% rent growth · sell at horizon
- IRR
- -2.6%
- Equity multiple
- 0.90×
- Total profit
- $-5,815
- Equity at exit
- $31,312
- IRR
- 8.3%
- Equity multiple
- 1.66×
- Total profit
- $38,957
- Equity at exit
- $18,157
Cash invested: $58,800 (down + closing). Projections, not guarantees.
Landlord ↔ Tenant lean methodology
- Overall (STATE)
- 73 Landlord-Friendly
- State Wisconsin
- 73 Landlord-Friendly · R+2
- County
- — inherits STATE
- City
- — inherits STATE
ZIP-level market 53235
- Home prices YoY
- -33.9%
- Rents YoY
- 3.9%
- Active inventory
- 51
- Price-to-rent
- 6.4×
Monthly cashflow live
- Estimated rent
- $2,733 high interval (Pro) →
- Mortgage (P&I)
- −$1,101
- Tax from tax record
- −$569 /mo · $6,828/yr
- Insurance
- −$88
- HOA
- −$0
- Vacancy / Maint / Mgmt
- −$574
- Net cashflow
- $401
Break-even live
UW: 25.0% down · 7.5% · 30yr · 1.5% tax · 5.0% vac · 8.0% maint · 8.0% mgmt
Financing live
Cash to close
- Down payment
- $52,500
- Closing costs
- $6,300
- Reserves months
- —
- Total cash needed
- —
Loan-product check · same deal, 3 products live
Conventional
25% down · 7.5% · 30yr
- Down + closing
- —
- Monthly P&I
- —
- Monthly cashflow
- —
- DSCR
- —
- Eligible?
- —
Personal DTI + credit; lowest rate.
DSCR
20% down · 8.5% · 30yr
- Down + closing
- —
- Monthly P&I
- —
- Monthly cashflow
- —
- DSCR
- —
- Eligible?
- —
No personal income docs; deal must DSCR.
Hard money
10% down · 12.0% · 12mo
- Down + closing
- —
- Monthly P&I
- —
- Monthly cashflow
- —
- DSCR
- —
- Eligible?
- —
Short-term bridge; refi at stabilization.
Rent comps 5 comps
| Address | Beds | Baths | Sqft | Rent | $/sqft | DOM | Units | Dist |
|---|---|---|---|---|---|---|---|---|
| 2721 Hidden Dr St Francis, WI | 3.0 | 2.0 | 1500 | $2,395 | $1.60 | 43d | 1 | 0.45mi |
| 2819 Hidden Dr Unit 2819 St Francis, WI | 3.0 | 2.5 | 2000 | $2,975 | $1.49 | 43d | 1 | 0.45mi |
| 2725 Pond DR St Francis, WI | 3.0 | 2.5 | 2000 | $2,975 | $1.49 | 1d | 1 | 0.45mi |
| 2760 Hidden Dr St Francis, WI | 3.0 | 2.0 | 1500 | $2,395 | $1.60 | 43d | 1 | 0.48mi |
| 2731 Pond Dr St Francis, WI | 3.0 | 2.5 | 2000 | $2,975 | $1.49 | 1d | 1 | 0.48mi |
Listing history 2 events
-
2026-05-19status Pending 263-char remark
Show marketing remark (263 chars)
Property is being sold ''AS IS'' with no warranties to condition. Property is owned by Milwaukee County. Approval of offer and sale is subject to approval of County Executive, County Comptroller and individual from the Intergovernmental Cooperation Council (ICC).
-
2026-03-05$210,000 Active 263-char remark
Show marketing remark (263 chars)
Property is being sold ''AS IS'' with no warranties to condition. Property is owned by Milwaukee County. Approval of offer and sale is subject to approval of County Executive, County Comptroller and individual from the Intergovernmental Cooperation Council (ICC).
ⓘ Source: listings_history table (triggers on properties + properties_extension) + one-shot
backfill from property_details.listing_events for pre-trigger history.
Tax reassessment forecast WI · Partial reset (capped growth)
- Current annual tax
- $6,828 · $569/mo
- Projected year-2 tax
- $6,828 · $569/mo
- Expected delta
- $0/yr ($0/mo · 0.0%)
ⓘ Screening estimate from a state-policy table — verify with the county assessor before closing.
Climate risk First Street
- Flood 3/10 Moderate FEMA zone X (unshaded) · 20% chance over 30 yrs
- Wildfire 1/10 Low
- Heat 2/10 Low 7 d/yr ≥96°F today · 13 d/yr by 30 yrs out
- Wind 2/10 Low
- Air quality 3/10 Moderate 3 unhealthy d/yr today · 3 by 30 yrs out
Nearby sold comps map
Loading sold comps map…
Walkable amenities ~0.75 mi
Loading nearby amenities…
Taxation est. · year 1
- Rental income
- $32,793
- − Mortgage interest
- −$11,763
- − Property taxes
- −$6,828
- − Insurance
- −$1,050
- − Repairs & maintenance
- −$2,623
- − Management
- −$2,623
- − Depreciation
- −$6,109
- Taxable income
- $1,795
- Est. tax owed @ 24.0%
- −$431
- After-tax cash flow
- $4,382/yr
For passive investors: Depreciation is non-cash, so a rental often shows a tax loss while cash-flowing — sheltering income. Rental losses are passive: they offset passive income freely, and up to $25,000/yr can offset ordinary (W-2) income if you actively participate and your MAGI is under $100k (phasing out to $0 by $150k); unused losses carry forward. On sale, claimed depreciation is recaptured at up to 25%, and gains may owe capital-gains tax (a 1031 exchange can defer both). Figures are a year-1 estimate at your 24.0% rate — not tax advice; consult a CPA.
Schools (NCES district)
- District
- Saint Francis School District
- NCES district ID
- 5513260
- Math proficiency
- 22% ▼ -13.00%
- Reading proficiency
- 29% ▼ -6.00%
- Median HH income
- $43,137
- Composite
- 21.79/100
- National rank
- #8251
- State rank
- #311 of 342 in WI
Livability — St. Francis
No livability data for this city. (Only ~50 U.S. cities are tracked.)
Census & demographics
- Census place
- St. Francis, WI
- County
- Milwaukee County · 926,379 people
- City population
- 9,318
- Metro
- Milwaukee-Waukesha, WI
- Population (ZIP)
- 9,004
- Household income
- $57,368
- Rent vs Own
- Severe rent burden
- 646.0
Population outlook (Milwaukee County) Hauer SSP2
- Today (2025)
- 995,758 people
- By 2030
- 1,009,124 · +1.3%
- By 2040
- 1,028,128 · +3.3%
- By 2050
- 1,040,066 · +4.4%
- By 2075
- 1,057,849 · +6.2%
- By 2100
- 1,039,774 · +4.4%
Race, ethnicity, and origin ACS 2023
- Neighborhood character
- Predominantly White (79%)
- Race & ethnicity
- White 79% Hispanic / Latino 11% Black 6% Two or more races 4% Asian 1%
- Hispanic origin (detail)
- Mexican 10%
- Common ancestry
- Romanian 16% Lithuanian 4% Iranian 3%
- Foreign-born
- 4% · Canada
- Languages at home
- 92% English-only · Spanish 4% Other Indo-European 3% German/W. Germanic 1%
Political lean MEDSL · Milwaukee
- 2024 margin
- Solid D (+38.5) · D 68.3% · R 29.8% · Other 1.8%
- 2008→2024 swing
- +2.7pp toward D · 2008: 35.9pp · 2024: 38.5pp
- All cycles
- 2024: D+38.5 2020: D+39.9 2016: D+37.5 2012: D+34.6 2008: D+35.9
Not yet ingested
- Civics
- —
Market trends
- HPI YoY
- ▼ -119.57%
- Current HPI
- 232.7373
- Rent YoY
- ▲ 3.88%
- Metro
- Milwaukee-Waukesha, WI
- State GDP YoY
- ▲ 2.10%
- F500 in state
- 20
Industry mix (Fortune 500 HQ in WI)
| Industry | F500 HQs | Revenue |
|---|---|---|
| Industrial Machinery | 4 | $23B |
|
||
| Industrial Technology | 2 | $36B |
|
||
| Insurance | 1 | $36B |
|
||
| Professional Services | 1 | $19B |
|
||
| Utilities | 1 | $9B |
|
||
| Consumer Goods | 1 | $3B |
|
||
Price history
2 events — show timeline
- 2026-05-19 Pending — METROMLS
- 2026-03-05 Listed $210,000 METROMLS
Property tax history
+4.2%/yrLatest (2024): $6,828 · -52.9% YoY. Source: county tax records.
Cash-flow waterfall
monthlySold comps — $/sqft
last 12 mo · ≤1 miLoading sold comps…