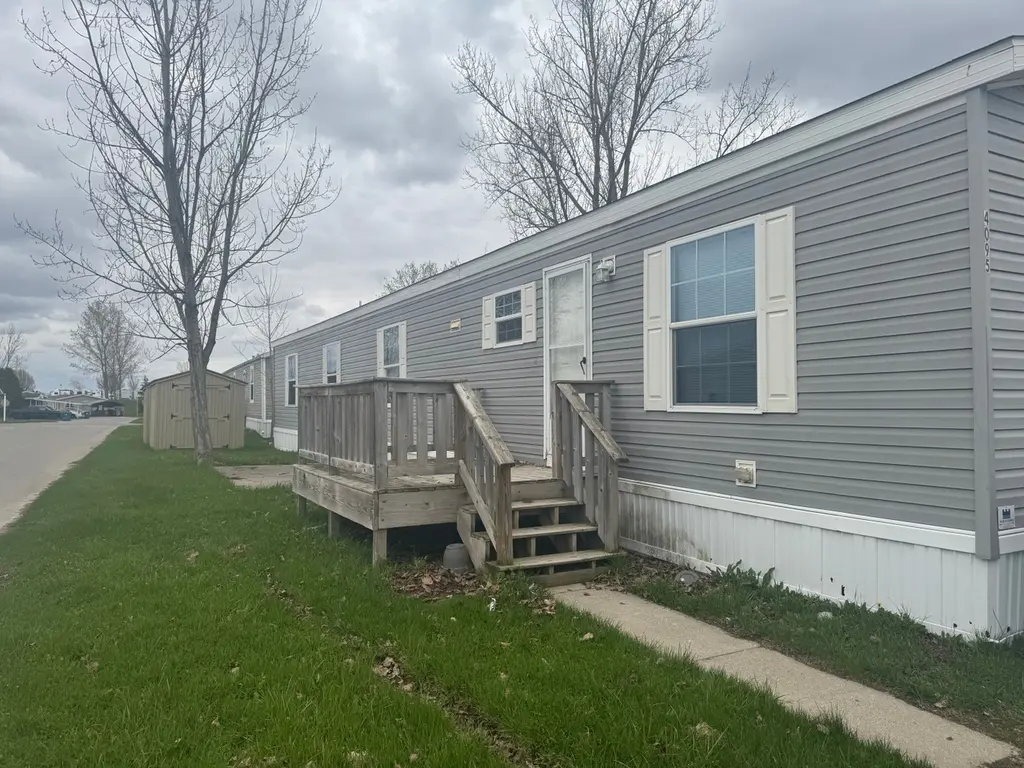
4095 Geranium Ln · Chums Corner, MI
Flood risk No data
- FEMA flood zone
- —
- Chance of flooding over 30 yrs
- —
- Est. flood insurance / yr
- —
Fire risk No data
- Est. fire insurance / yr
- —
Heat risk No data
- Hot days now (above threshold)
- —
- Hot days in 30 yrs
- —
Wind risk No data
- Chance of severe wind over 30 yrs
- —
Air-quality risk No data
- Unhealthy air days now
- —
- Unhealthy air days in 30 yrs
- —
Risk factors via First Street. Map © Google.
Why this score? — see what drove the B grade
The composite is a weighted blend of 9 inputs, each scored 0–100. Each bar is that input's sub-score; the figure is the points it added to the 100-point composite (weight × sub-score).
- Cash flow +30.0/30.0
- 1% rule +10.0/10.0
- DSCR +10.0/10.0
- ARV discount +7.5/15.0
- Schools +4.4/10.0
- Condition / age +3.8/5.0
- Livability +3.4/5.0
- Rent growth +2.5/5.0
- Appreciation +0.0/10.0
$58,900
🖨 Deal sheet 📄 Offer letter ✓ Due diligence
Listing remarks
Take advantage of this opportunity to own a well maintained 3 bedroom 2 bathroom home featuring a spacious open floor plan designed for comfort and convenience. This move in ready home offers a bright living space that connects seamlessly to a large kitchen creating an ideal setup for everyday living dining and entertaining. The functional layout includes three comfortable bedrooms and two full bathrooms offering flexibility and practicality throughout the home. The kitchen provides ample cabinet and counter space making meal preparation and storage simple and efficient. With its low maintenance features and inviting layout this home offers an excellent combination of style value and functi
Key facts
- Open floor plan
- Large kitchen
- Ample cabinet space
Tags
Property features AI
Finance
- Financial info: Listed as a spec home; List price $58,900
Exterior
- Home design: Single-section home; 3 bed, 2 bath plan
- Exterior features: Living area approximately 1120
Interior
- Kitchen: Includes dishwasher, disposal, and refrigerator
- Bedrooms: 3 bedrooms
- Bathrooms: 2 bathrooms
- Interior features: Dishwasher; Disposal; Refrigerator
Neighborhood map
What this means for you Summary
Snapshot
- This is a 3-bed/2.0-bath manufactured listed at $59k. Condition is rated good.
Deal economics
- At list price, monthly cash flow is $759 ($9k/yr) — positive.
- The deal already cash-flows at list — no discount required.
- Meets the 1% rule at list price ($1k rent vs $59k).
- Recommended offer: $57k (3.0% below list) — sets the bar for market timing.
- Cap rate 21.8% vs local median 1.5% in Chums Corner — top-decile yield for the area; either an underpriced asset or a hidden risk that comps aren't pricing in. Stress-test before assuming the spread holds.
Location & tenants
- Location reads 67/100 on livability (#400 in MI) — a middle-class / working-renter tenant base. Strengths: crime A+, housing A+, cost of living A-; Watch: schools D+, amenities F, commute F.
- Traverse City Area Public Schools (town): math 45% / reading 56% proficiency, ranked #94 of 540 in MI (top 17%) — acceptable for families but not a draw, mixed tenant base, ~2y average lease.
- Market conditions: 229 active listings in the ZIP; 2 comparable units currently listed for rent nearby; 883 units permitted in Grand Traverse County in 2024 (501 in 5+ unit buildings).
Forward outlook
- Local home prices are declining (-3.0%/yr); year-one equity from $407 of loan paydown is wiped out by about $2k of value loss. Plan a longer hold.
- Grand Traverse County population projected at +20% by 2050 — long-run rental-demand tailwind backs the buy-and-hold thesis.
- At projected returns (-3.0% appreciation + 3.0% rent growth), your $16k cash investment doubles in ~3 years — after that, you're playing with house money.
Negotiation context
- It's been on market 40 days — a 3% lower offer ($57k) is reasonable based on typical stale-listing flexibility.
Questions for the listing agent
- It's been on market 40 days. Have you received any prior offers? Is the seller open to a 3% concession, seller financing, or rate buy-down credit?
- Is there a deadline driving the sale (1031 exchange, divorce, estate, relocation)? That informs how much negotiation room exists.
- Schools are D-rated, which usually means shorter tenancies and higher turnover. Who's the typical renter profile here, and what's been the actual vacancy rate?
- What's the average days-on-market for RENTAL listings here right now (not sales)? A rising rental-DOM trend means longer vacancies and softer asking-rent achievability than the comps imply.
- What's the recent tenant-quality profile in this submarket — average credit score on applications, eviction rate, late-payment / NSF rate, and stable-employment percentage? A property-management company in the area should have these aggregated.
- How much new for-sale + rental construction is in the pipeline within 1–3 miles? Heavy new supply typically softens prices + rents 12–24 months out; constrained supply supports both.
Investment metrics
- 1% rule
- 2.51% ✓
- Cap rate
- 21.75%
- Cash-on-cash
- 55.21%
- DSCR
- 3.46
- GRM
- 3.3
CMA / ARV
No comps found within radius.
Projected returns pro-forma
-3.0% appreciation · 3.0% rent growth · sell at horizon
- IRR
- 53.5%
- Equity multiple
- 3.35×
- Total profit
- $38,806
- Equity at exit
- $8,782
- IRR
- 58.7%
- Equity multiple
- 6.83×
- Total profit
- $96,111
- Equity at exit
- $5,093
Cash invested: $16,492 (down + closing). Projections, not guarantees.
Landlord ↔ Tenant lean methodology
- Overall (STATE)
- 62 Landlord-Friendly
- State Michigan
- 62 Landlord-Friendly · EVEN
- County
- — inherits STATE
- City
- — inherits STATE
ZIP-level market 49685
- Active inventory
- 229
- Price-to-rent
- 3.3×
Monthly cashflow live
- Estimated rent
- $1,476 medium interval (Pro) →
- Mortgage (P&I)
- −$309
- Tax est. 1.5%
- −$74 /mo · $884/yr
- Insurance
- −$25
- HOA
- −$0
- Vacancy / Maint / Mgmt
- −$310
- Net cashflow
- $759
Break-even live
UW: 25.0% down · 7.5% · 30yr · 1.5% tax · 5.0% vac · 8.0% maint · 8.0% mgmt
Financing live
Cash to close
- Down payment
- $14,725
- Closing costs
- $1,767
- Reserves months
- —
- Total cash needed
- —
Loan-product check · same deal, 3 products live
Conventional
25% down · 7.5% · 30yr
- Down + closing
- —
- Monthly P&I
- —
- Monthly cashflow
- —
- DSCR
- —
- Eligible?
- —
Personal DTI + credit; lowest rate.
DSCR
20% down · 8.5% · 30yr
- Down + closing
- —
- Monthly P&I
- —
- Monthly cashflow
- —
- DSCR
- —
- Eligible?
- —
No personal income docs; deal must DSCR.
Hard money
10% down · 12.0% · 12mo
- Down + closing
- —
- Monthly P&I
- —
- Monthly cashflow
- —
- DSCR
- —
- Eligible?
- —
Short-term bridge; refi at stabilization.
Rent comps 2 comps
| Address | Beds | Baths | Sqft | Rent | $/sqft | DOM | Units | Dist |
|---|---|---|---|---|---|---|---|---|
| 4170 Lilac Ln Unit 905 Traverse City, MI | 3.0 | 2.0 | 1120 | $1,419 | $1.27 | 43d | 1 | 0.05mi |
| 4418 E Daisy Ln Unit 156 Traverse City, MI | 2.0 | 2.0 | 896 | $1,649 | $1.84 | 43d | 1 | 0.24mi |
Listing history 16 events
-
2026-06-19days on market $58,900 Active 40 DOM
-
2026-06-18days on market $58,900 Active 39 DOM
-
2026-06-17days on market $58,900 Active 38 DOM
-
2026-06-16days on market $58,900 Active 37 DOM
-
2026-06-15days on market $58,900 Active 36 DOM
-
2026-06-14days on market $58,900 Active 34 DOM
-
2026-06-12days on market $58,900 Active 33 DOM
-
2026-06-09days on market $58,900 Active 30 DOM
-
2026-06-08days on market $58,900 Active 29 DOM
-
2026-06-07days on market $58,900 Active 28 DOM
-
2026-06-03days on market $58,900 Active 24 DOM
-
2026-06-02days on market $58,900 Active 23 DOM
-
2026-06-01days on market $58,900 Active 22 DOM
-
2026-05-31days on market $58,900 Active 21 DOM
-
2026-05-30days on market $58,900 Active 20 DOM
-
2026-05-10$58,900 Active 1102-char remark
ⓘ Source: listings_history table (triggers on properties + properties_extension) + one-shot
backfill from property_details.listing_events for pre-trigger history.
Nearby sold comps map
Loading sold comps map…
Walkable amenities ~0.75 mi
Loading nearby amenities…
Taxation est. · year 1
- Rental income
- $17,709
- − Mortgage interest
- −$3,299
- − Property taxes
- −$884
- − Insurance
- −$294
- − Repairs & maintenance
- −$1,417
- − Management
- −$1,417
- − Depreciation
- −$1,713
- Taxable income
- $8,685
- Est. tax owed @ 24.0%
- −$2,084
- After-tax cash flow
- $7,021/yr
For passive investors: Depreciation is non-cash, so a rental often shows a tax loss while cash-flowing — sheltering income. Rental losses are passive: they offset passive income freely, and up to $25,000/yr can offset ordinary (W-2) income if you actively participate and your MAGI is under $100k (phasing out to $0 by $150k); unused losses carry forward. On sale, claimed depreciation is recaptured at up to 25%, and gains may owe capital-gains tax (a 1031 exchange can defer both). Figures are a year-1 estimate at your 24.0% rate — not tax advice; consult a CPA.
Condition & rehab AI · 12 photos
This move-in ready home offers a spacious and well-maintained interior with modern appliances and flooring. The exterior is clean and the property is located in a desirable neighborhood with community amenities.
Value-add opportunities
- Both paint exterior — enhances curb appeal and value
- Both replace carpet with hardwood — increases both resale and rental value
- Both install modern lighting fixtures — improves aesthetics and energy efficiency
Renovation cost estimate screening
Value-add ROI direction
- Both paint exterior — enhances curb appeal and value ↑
- Both replace carpet with hardwood — increases both resale and rental value ↑
- Both install modern lighting fixtures — improves aesthetics and energy efficiency ↑
ⓘ Cost ranges are severity-bucket heuristics (US national rule-of-thumb). Get contractor quotes + a written scope before underwriting a rehab budget.
Schools (NCES district)
- District
- Traverse City Area Public Schools
- NCES district ID
- 2633870
- Math proficiency
- 45% ▼ -3.00%
- Reading proficiency
- 56% ▼ -6.00%
- Median HH income
- $53,645
- Composite
- 43.51/100
- National rank
- #2990
- State rank
- #94 of 540 in MI
Livability — Chums Corner
- Score
- 67/100
- State rank
- #400
- US rank
- #10826
Category grades
Schools grade is shown separately in the Schools card above.
Census & demographics
- Population (ZIP)
- 21,297
Population outlook (Grand Traverse County) Hauer SSP2
- Today (2025)
- 102,241 people
- By 2030
- 107,172 · +4.8%
- By 2040
- 115,676 · +13.1%
- By 2050
- 122,377 · +19.7%
- By 2075
- 136,554 · +33.6%
- By 2100
- 137,871 · +34.8%
Race, ethnicity, and origin ACS 2023
- Neighborhood character
- Predominantly White (92%)
- Race & ethnicity
- White 92% Two or more races 4% Hispanic / Latino 2%
- Common ancestry
- Romanian 11% Lithuanian 4% Portuguese 3%
- Foreign-born
- 2% · Canada, South Korea
- Languages at home
- 98% English-only · Spanish 1% Russian/Polish/Slavic 1%
Political lean MEDSL · Grand Traverse
- 2024 margin
- Toss-up / Even · D 48.3% · R 50.1% · Other 1.6%
- 2008→2024 swing
- +1.3pp toward D · 2008: -3.0pp · 2024: -1.7pp
- All cycles
- 2024: R+1.7 2020: R+3.0 2016: R+12.5 2012: R+11.8 2008: R+3.0
Not yet ingested
- Civics
- —
Market trends
- HPI YoY
- ▼ -208.83%
- Current HPI
- 351.3678
- Rent YoY
- —
- Metro
- —
- State GDP YoY
- ▲ 1.37%
- F500 in state
- 28
Industry mix (Fortune 500 HQ in MI)
| Industry | F500 HQs | Revenue |
|---|---|---|
| Automotive Parts | 3 | $48B |
|
||
| Automotive | 2 | $372B |
|
||
| Chemicals | 1 | $45B |
|
||
| Automotive Retail | 1 | $29B |
|
||
| Healthcare / Medical Devices | 1 | $23B |
|
||
| Automotive Technology | 1 | $20B |
|
||
Cash-flow waterfall
monthlySold comps — $/sqft
last 12 mo · ≤1 miLoading sold comps…