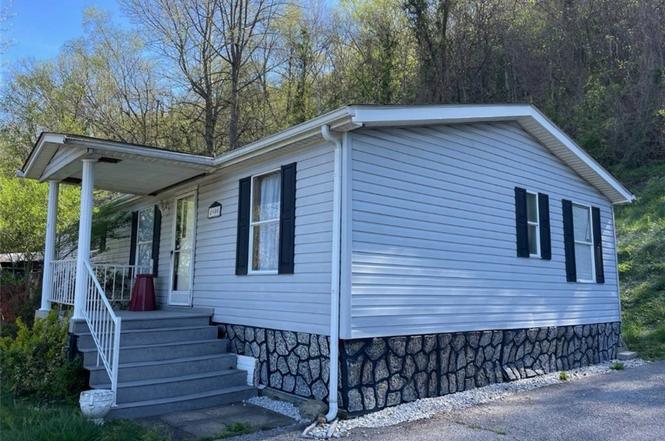
4900 & 4904 Jonquil Dr · Rand, WV
Flood risk 1/10 · Minimal
- FEMA flood zone
- X (unshaded)
- Chance of flooding over 30 yrs
- 0.0%
- Est. flood insurance / yr
- $507 – $1,088
Fire risk 5/10 · Moderate
- Est. fire insurance / yr
- $787 – $1,461
Heat risk 5/10 · Moderate
- Hot days now (above 100°F)
- 7 days/yr
- Hot days in 30 yrs
- 20 days/yr
Wind risk 2/10 · Minimal
- Chance of severe wind over 30 yrs
- 1.0%
Air-quality risk 1/10 · Minimal
- Unhealthy air days now
- 0 days/yr
- Unhealthy air days in 30 yrs
- 0 days/yr
Risk factors via First Street. Map © Google.
Why this score? — see what drove the B+ grade
The composite is a weighted blend of 9 inputs, each scored 0–100. Each bar is that input's sub-score; the figure is the points it added to the 100-point composite (weight × sub-score).
- Cash flow +30.0/30.0
- 1% rule +10.0/10.0
- DSCR +10.0/10.0
- ARV discount +7.5/15.0
- Appreciation +7.0/10.0
- Rent growth +4.4/5.0
- Livability +3.2/5.0
- Schools +2.9/10.0
- Condition / age +2.5/5.0
$74,900
🖨 Deal sheet 📄 Offer letter ✓ Due diligence
Listing remarks
2 properties for the price of 1! 3bd/2ba home, move-in-ready mobile home. Large living room with an electric fireplace, dining room, and a large kitchen. It has a primary ensuite bathroom and a walk-in closet. Additionally, the second house is a 2-bedroom, 1-bath ranch-style home. Shared driveway, double carport, and 2 storage buildings.
Key facts
- Walk-in closet
- Double carport
- Storage buildings
Tags
Property features AI
Finance
- HOA & community: Homeowners association with an annual fee of $373 (about $31.08/month)
Exterior
- Utilities: Public water; Public sewer
- Home design: Single-family residential; One story
- Construction: Vinyl siding
- Exterior features: Lot dimensions approximately 50 x 50 x 150 x 150
Interior
- Bathrooms: 1 full bathroom
- Heating & cooling: Forced air heating
- Interior features: Total of 5 rooms; No basement
Neighborhood map
What this means for you Summary
Snapshot
- This is a 2-bed/1.0-bath single-family listed at $75k.
Deal economics
- At list price, monthly cash flow is $603 ($7k/yr) — positive.
- The deal already cash-flows at list — no discount required.
- Meets the 1% rule at list price ($1k rent vs $75k).
- Recommended offer: $66k (12.0% below list) — sets the bar for market timing.
Location & tenants
- Location reads 64/100 on livability (#138 in WV) — a middle-class / working-renter tenant base. Strengths: cost of living A+; Watch: commute D+, amenities F, health & safety F.
- Kanawha County Schools (suburban): math 29% / reading 40% proficiency, ranked #17 of 55 in WV (top 31%) — families likely to look elsewhere, expect single-tenant / working-renter base with shorter leases.
- Zoned schools: Malden Elementary School (math 22% / reading 17%, grade F, #350 of 377 statewide, top 95%, 152 students, 0% FRL); Riverside High School (math 17% / reading 47%, grade F, #55 of 110 statewide, top 59%, 1,220 students, 0% FRL) — zoned schools average 0% FRL vs 46% district-wide (46 pts lower); this property's tenant base skews higher-income than the district average.
- Market conditions: Rents rising fast (+7.6%/yr); 24 active listings in the ZIP; 103 units permitted in Kanawha County in 2024 (0 in 5+ unit buildings).
Forward outlook
- In year one you build about $4k of equity ($518 loan paydown + $3k appreciation (4.0% local appreciation)).
- Kanawha County population projected at -17% by 2050 — secular population decline; favor cash flow + early exit over multi-decade hold.
- At projected returns (4.0% appreciation + 7.6% rent growth), your $21k cash investment doubles in ~2 years — after that, you're playing with house money.
- By year 9, paydown + projected appreciation supports a ~$30k cash-out refi (75% LTV) — recoverable capital for the next deal without selling this one.
Negotiation context
- It's been on market 168 days — a 12% lower offer ($66k) is reasonable based on typical stale-listing flexibility.
- 3 sale attempts; this cycle's ask has dropped $8k (9%) from the opening price — seller is motivated, your offer sets the floor, not the list.
Risks & watch-outs
- Climate carrying-cost: moderate wildfire risk; extreme-heat days projected 7→20/yr by 2055 (HVAC capex compounding) — expect insurance premiums to compound above CPI over the hold.
Questions for the listing agent
- It's been on market 168 days. Have you received any prior offers? Is the seller open to a 12% concession, seller financing, or rate buy-down credit?
- Built in 1972 — when were the roof, HVAC, electrical panel, plumbing, and water heater last replaced?
- What does the HOA fee cover, when was the last increase, and are there any pending special assessments or reserve-fund shortfalls?
- Why hasn't it sold? Are there any deal-killer items the seller is aware of (foundation, flood, title, zoning, code violations)?
- Is there a deadline driving the sale (1031 exchange, divorce, estate, relocation)? That informs how much negotiation room exists.
- Schools are F-rated, which usually means shorter tenancies and higher turnover. Who's the typical renter profile here, and what's been the actual vacancy rate?
- What's the average days-on-market for RENTAL listings here right now (not sales)? A rising rental-DOM trend means longer vacancies and softer asking-rent achievability than the comps imply.
- What's the recent tenant-quality profile in this submarket — average credit score on applications, eviction rate, late-payment / NSF rate, and stable-employment percentage? A property-management company in the area should have these aggregated.
- How much new for-sale + rental construction is in the pipeline within 1–3 miles? Heavy new supply typically softens prices + rents 12–24 months out; constrained supply supports both.
Investment metrics
- 1% rule
- 1.84% ✓
- Cap rate
- 15.95%
- Cash-on-cash
- 34.48%
- DSCR
- 2.53
- GRM
- 4.5
CMA / ARV
No comps found within radius.
Projected returns pro-forma
3.99% appreciation · 7.59% rent growth · sell at horizon
- IRR
- 45.3%
- Equity multiple
- 3.77×
- Total profit
- $58,059
- Equity at exit
- $37,931
- IRR
- 46.3%
- Equity multiple
- 8.64×
- Total profit
- $160,303
- Equity at exit
- $62,005
Cash invested: $20,972 (down + closing). Projections, not guarantees.
Landlord ↔ Tenant lean methodology
- Overall (STATE)
- 83 Strongly Landlord-Friendly
- State West Virginia
- 83 Strongly Landlord-Friendly · R+22
- County
- — inherits STATE
- City
- — inherits STATE
ZIP-level market 25306
- Home prices YoY
- 2.1%
- Rents YoY
- 7.6%
- Active inventory
- 24
- Price-to-rent
- 4.5×
Monthly cashflow live
- Estimated rent
- $1,377 medium interval (Pro) →
- Mortgage (P&I)
- −$393
- Tax from tax record
- −$30 /mo · $365/yr
- Insurance
- −$31
- HOA
- −$31
- Vacancy / Maint / Mgmt
- −$289
- Net cashflow
- $603
Break-even live
UW: 25.0% down · 7.5% · 30yr · 1.5% tax · 5.0% vac · 8.0% maint · 8.0% mgmt
Financing live
Cash to close
- Down payment
- $18,725
- Closing costs
- $2,247
- Reserves months
- —
- Total cash needed
- —
Loan-product check · same deal, 3 products live
Conventional
25% down · 7.5% · 30yr
- Down + closing
- —
- Monthly P&I
- —
- Monthly cashflow
- —
- DSCR
- —
- Eligible?
- —
Personal DTI + credit; lowest rate.
DSCR
20% down · 8.5% · 30yr
- Down + closing
- —
- Monthly P&I
- —
- Monthly cashflow
- —
- DSCR
- —
- Eligible?
- —
No personal income docs; deal must DSCR.
Hard money
10% down · 12.0% · 12mo
- Down + closing
- —
- Monthly P&I
- —
- Monthly cashflow
- —
- DSCR
- —
- Eligible?
- —
Short-term bridge; refi at stabilization.
HOA detail
- Monthly dues
- $31 · $372/yr
- Likely covers
- electric
Listing history 27 events
-
2026-06-19days on market $74,900 Active 168 DOM
-
2026-06-18price $74,900 Active 167 DOM
-
2026-06-18days on market $79,900 Active 167 DOM
-
2026-06-17days on market $79,900 Active 166 DOM
-
2026-06-16days on market $79,900 Active 165 DOM
-
2026-06-15days on market $79,900 Active 164 DOM
-
2026-06-14days on market $79,900 Active 162 DOM
-
2026-06-12days on market $79,900 Active 161 DOM
-
2026-06-09days on market $79,900 Active 158 DOM
-
2026-06-08days on market $79,900 Active 157 DOM
-
2026-06-07days on market $79,900 Active 156 DOM
-
2026-06-05days on market $79,900 Active 153 DOM
-
2026-06-03days on market $79,900 Active 152 DOM
-
2026-06-02days on market $79,900 Active 151 DOM
-
2026-06-01days on market $79,900 Active 150 DOM
-
2026-05-31days on market $79,900 Active 149 DOM
-
2026-05-30days on market $79,900 Active 148 DOM
-
2026-05-15price $79,900
-
2026-01-02$82,400 Active
-
2025-12-02price $82,400
-
2025-11-12price $84,900
-
2025-10-28price $87,400
-
2025-10-14price $89,900
-
2025-09-29price $92,400
-
2025-09-15$94,900 Active
-
2025-08-26price $94,900
-
2025-06-24$99,900 Active
ⓘ Source: listings_history table (triggers on properties + properties_extension) + one-shot
backfill from property_details.listing_events for pre-trigger history.
Tax reassessment forecast WV · Resets to sale price
- Current annual tax
- $365 · $30/mo
- Projected year-2 tax
- $442 · $37/mo
- Expected delta
- +$77/yr (+$6/mo · 21.0%)
ⓘ Screening estimate from a state-policy table — verify with the county assessor before closing.
Climate risk First Street
- Flood 1/10 Low FEMA zone X (unshaded) · 0% chance over 30 yrs
- Wildfire 5/10 Major
- Heat 5/10 Major 7 d/yr ≥100°F today · 20 d/yr by 30 yrs out
- Wind 2/10 Low 100% chance of damaging wind over 30 yrs
- Air quality 1/10 Low 0 unhealthy d/yr today · 0 by 30 yrs out
Nearby sold comps map
Loading sold comps map…
Walkable amenities ~0.75 mi
Loading nearby amenities…
Taxation est. · year 1
- Rental income
- $16,527
- − Mortgage interest
- −$4,196
- − Property taxes
- −$365
- − Insurance
- −$374
- − Repairs & maintenance
- −$1,322
- − Management
- −$1,322
- − HOA
- −$372
- − Depreciation
- −$2,179
- Taxable income
- $6,397
- Est. tax owed @ 24.0%
- −$1,535
- After-tax cash flow
- $5,696/yr
For passive investors: Depreciation is non-cash, so a rental often shows a tax loss while cash-flowing — sheltering income. Rental losses are passive: they offset passive income freely, and up to $25,000/yr can offset ordinary (W-2) income if you actively participate and your MAGI is under $100k (phasing out to $0 by $150k); unused losses carry forward. On sale, claimed depreciation is recaptured at up to 25%, and gains may owe capital-gains tax (a 1031 exchange can defer both). Figures are a year-1 estimate at your 24.0% rate — not tax advice; consult a CPA.
Schools (NCES district)
- District
- Kanawha County Schools
- NCES district ID
- 5400600
- Math proficiency
- 29% ▼ -13.00%
- Reading proficiency
- 40% ▼ -7.00%
- Median HH income
- $44,329
- Composite
- 29.35/100
- National rank
- #6540
- State rank
- #17 of 55 in WV
Livability — Rand
- Score
- 64/100
- State rank
- #138
- US rank
- #13922
Category grades
Schools grade is shown separately in the Schools card above.
Census & demographics
- County
- Kanawha County · 33,502 people
- Metro
- Charleston, WV
- Population (ZIP)
- 6,040
- Household income
- $71,654
- Rent vs Own
- Severe rent burden
- 124.0
Population outlook (Kanawha County) Hauer SSP2
- Today (2025)
- 178,946 people
- By 2030
- 172,906 · -3.4%
- By 2040
- 159,874 · -10.7%
- By 2050
- 148,148 · -17.2%
- By 2075
- 123,257 · -31.1%
- By 2100
- 96,454 · -46.1%
Race, ethnicity, and origin ACS 2023
- Neighborhood character
- Predominantly White (86%)
- Race & ethnicity
- White 86% Black 6% Hispanic / Latino 3% Two or more races 3% Asian 3%
- Common ancestry
- Italian 4% Slovak 3% Iranian 1%
- Foreign-born
- 3% · Canada
- Languages at home
- 97% English-only · Other Asian/Pacific 1% Other Indo-European 1%
Political lean MEDSL · Kanawha
- 2024 margin
- R (+17.4) · D 40.2% · R 57.6% · Other 2.2%
- 2008→2024 swing
- -17.0pp toward R · 2008: -0.4pp · 2024: -17.4pp
- All cycles
- 2024: R+17.4 2020: R+14.7 2016: R+20.6 2012: R+11.9 2008: R+0.4
Not yet ingested
- Civics
- —
Market trends
- HPI YoY
- ▲ 3.99%
- Current HPI
- 195.9623
- Rent YoY
- ▲ 7.59%
- Metro
- Charleston, WV
- State GDP YoY
- —
- F500 in state
- 0
Price history
-20.0% since first listed10 events — show timeline
- 2026-05-15 Price Changed $79,900 KVBOR
- 2026-01-02 Listed $82,400 KVBOR
- 2025-12-02 Price Changed $82,400 KVBOR
- 2025-11-12 Price Changed $84,900 KVBOR
- 2025-10-28 Price Changed $87,400 KVBOR
- 2025-10-14 Price Changed $89,900 KVBOR
- 2025-09-29 Price Changed $92,400 KVBOR
- 2025-09-15 Listed $94,900 KVBOR
- 2025-08-26 Price Changed $94,900 KVBOR
- 2025-06-24 Listed $99,900 KVBOR
Property tax history
+12.6%/yrLatest (2025): $365 · -2.0% YoY. Source: county tax records.
Cash-flow waterfall
monthlySold comps — $/sqft
last 12 mo · ≤1 miLoading sold comps…