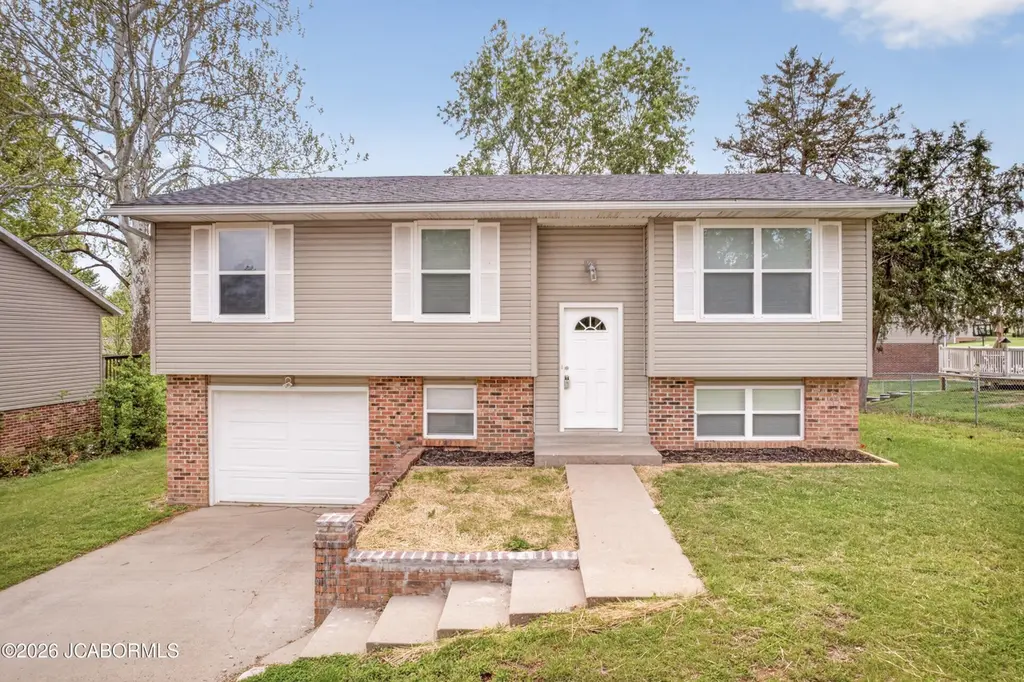
5545 Bradley Dr · Jefferson City, MO
Flood risk 1/10 · Minimal
- FEMA flood zone
- X (unshaded)
- Chance of flooding over 30 yrs
- 0.0%
- Est. flood insurance / yr
- $473 – $860
Fire risk 3/10 · Minor
- Est. fire insurance / yr
- $1,054 – $1,958
Heat risk 4/10 · Minor
- Hot days now (above 106°F)
- 7 days/yr
- Hot days in 30 yrs
- 19 days/yr
Wind risk 2/10 · Minimal
- Chance of severe wind over 30 yrs
- 0.0%
Air-quality risk 2/10 · Minimal
- Unhealthy air days now
- 0 days/yr
- Unhealthy air days in 30 yrs
- 1 days/yr
Risk factors via First Street. Map © Google.
Why this score? — see what drove the D- grade
The composite is a weighted blend of 9 inputs, each scored 0–100. Each bar is that input's sub-score; the figure is the points it added to the 100-point composite (weight × sub-score).
- ARV discount +10.3/15.0
- Cash flow +9.8/30.0
- Rent growth +5.0/5.0
- Livability +4.2/5.0
- Schools +3.5/10.0
- DSCR +2.8/10.0
- Condition / age +2.5/5.0
- 1% rule +1.9/10.0
- Appreciation +0.0/10.0
$209,900
🖨 Deal sheet (PDF) 📄 Offer letter ✓ Due diligence
Listing remarks
Updated and move in ready west end home! This well maintained 3bed 2 full bath home offers comfortable living space with a 1 car garage and plenty of room to spready out. Recent improvements inckude new floor coverings, and a new heat and air system, giving you peace of mind and modern comfort. The main level flows nicely for everyday living while the lower level features a spacious family room plus a bonus room, perfect for a home office, hobby space or potential 4th bedroom. Step outside to enjoy the nice deck and patio, ideal for relaxing or entertaining. A great combination of updates, space and location!
Key facts
- Nice deck
- Bonus room
- New floor coverings
Tags
Neighborhood map
What this means for you Summary
Snapshot
- This is a 3-bed/1.0-bath single-family listed at $210k.
Deal economics
- At list price, monthly cash flow is $-134 ($-2k/yr) — negative.
- To cash-flow at today's rent, offer at most $186k (11.3% below list).
- To meet the 1% rule (rent ≥ 1% of price), the offer needs to be $144k (31.4% below list).
- Recommended offer: $144k (31.4% below list) — sets the bar for 1% rule.
- Cap rate 5.5% vs local median 3.8% in Jefferson City — top-decile yield for the area; either an underpriced asset or a hidden risk that comps aren't pricing in. Stress-test before assuming the spread holds.
Location & tenants
- Location reads 83/100 on livability (#7 in MO, #838 nationally) — a professional / high-income tenant draw. Strengths: cost of living A+, housing A+, health & safety A+; Watch: crime C-.
- Jefferson City (urban): math 34% / reading 48% proficiency, ranked #121 of 324 in MO (top 37%) — families likely to look elsewhere, expect single-tenant / working-renter base with shorter leases.
- Zoned schools: Clarence Lawson Elem. (math 43% / reading 52%, grade D, #342 of 1,115 statewide, top 31%, 419 students, 53% FRL); Thomas Jefferson Middle (math 33% / reading 44%, grade F, #202 of 391 statewide, top 54%, 957 students, 52% FRL); Jefferson City High (math 46% / reading 63%, grade C-, #69 of 521 statewide, top 15%, 1,296 students, 48% FRL).
- Market conditions: Rents rising fast (+10.2%/yr); 248 active listings in the ZIP; 2 comparable units currently listed for rent nearby; 173 units permitted in Cole County in 2024 (0 in 5+ unit buildings).
Forward outlook
- Local home prices are declining (-3.0%/yr); year-one equity from $1k of loan paydown is wiped out by about $6k of value loss. Plan a longer hold.
- Cole County population projected to shrink 5% by 2050 — rents likely to lag national; underwrite the cash flow, not the appreciation.
Negotiation context
- Only 2 days on market — expect competitive offers; lowballing is unlikely to land.
Questions for the listing agent
- What do current leases actually rent for vs. the listed asking? Can we see a recent rent roll and the last 12 months of T-12 income?
- Is there a deadline driving the sale (1031 exchange, divorce, estate, relocation)? That informs how much negotiation room exists.
- Schools are B-rated — typically a magnet for longer-tenancy family renters. What's the average tenant stay here, and is there a school-zone premium baked into asking?
- The area grade is low — what's the realistic commute time and amenity access for the typical tenant pool here? Any planned neighborhood developments (good or bad) we should know about?
- What's the average days-on-market for RENTAL listings here right now (not sales)? A rising rental-DOM trend means longer vacancies and softer asking-rent achievability than the comps imply.
- What's the recent tenant-quality profile in this submarket — average credit score on applications, eviction rate, late-payment / NSF rate, and stable-employment percentage? A property-management company in the area should have these aggregated.
- How much new for-sale + rental construction is in the pipeline within 1–3 miles? Heavy new supply typically softens prices + rents 12–24 months out; constrained supply supports both.
Investment metrics
- 1% rule
- 0.69% ✗
- Cap rate
- 5.53%
- Cash-on-cash
- -2.73%
- DSCR
- 0.88
- GRM
- 12.1
CMA / ARV
- ARV (on-the-fly)
- $223,818
- Comps found
- 10
Show comp detail 10 sales within ~0.75 mi
| Address | Dist | Beds/Ba | Sqft | Sold | Price | $/sf | Match |
|---|---|---|---|---|---|---|---|
| 5525 Scherr Dr | 0.19mi | 3/2.5 | 1,586 (+4%) | 2mo | $230,000 | $145 | 77 |
| 5501 S Brooks Dr | 0.21mi | 3/2.0 | 1,500 (-2%) | 10mo | $219,000 | $146 | 74 |
| 5417 Bret Ct | 0.27mi | 3/1.5 | 1,556 (+2%) | 22mo | $184,900 | $119 | 65 |
| 5408 Bret Ct | 0.31mi | 3/2.0 | 1,402 (-8%) | 6mo | $209,900 | $150 | 62 |
| 5428 Bret Ct | 0.21mi | 3/2.0 | 1,476 (-4%) | 24mo | $186,000 | $126 | 60 |
| 5405 Thornridge Dr | 0.41mi | 3/2.0 | 1,681 (+10%) | 12mo | $339,900 | $202 | 50 |
| 1616 Westview Dr | 0.56mi | 3/1.0 | 1,362 (-11%) | 8mo | $179,000 | $131 | 49 |
| 1401 Westview Dr | 0.67mi | 3/2.5 | 1,446 (-6%) | 14mo | $199,900 | $138 | 41 |
| 5317 Thornridge Ct | 0.47mi | 3/2.0 | 1,700 (+11%) | 19mo | $348,500 | $205 | 40 |
| 1509 Fairlawn Ct | 0.67mi | 3/1.5 | 1,340 (-13%) | 15mo | $229,900 | $172 | 33 |
Match score weights: distance 35% · size 25% · config 20% · recency 20%. Top-matched comps best support the ARV.
Projected returns pro-forma
-3.0% appreciation · 8.0% rent growth · sell at horizon
- IRR
- -16.2%
- Equity multiple
- 0.40×
- Total profit
- $-35,015
- Equity at exit
- $31,297
- IRR
- -1.5%
- Equity multiple
- 0.88×
- Total profit
- $-7,193
- Equity at exit
- $18,148
Cash invested: $58,772 (down + closing). Projections, not guarantees.
Landlord ↔ Tenant lean methodology
- Overall (STATE)
- 81 Strongly Landlord-Friendly
- State Missouri
- 81 Strongly Landlord-Friendly · R+10
- County
- — inherits STATE
- City
- — inherits STATE
ZIP-level market 65109
- Home prices YoY
- -29.2%
- Rents YoY
- 10.2%
- Active inventory
- 248
- Price-to-rent
- 12.1×
Monthly cashflow live
- Estimated rent
- $1,440 medium interval (Pro) →
- Mortgage (P&I)
- −$1,101
- Tax from tax record
- −$83 /mo · $996/yr
- Insurance
- −$87
- HOA
- −$0
- Vacancy / Maint / Mgmt
- −$302
- Net cashflow
- $-134
Break-even live
Sensitivity live
| Price | -10% $-15 | -5% $-74 | +0% $-134 | +5% $-193 | +10% $-253 |
|---|---|---|---|---|---|
| Rent | -10% $-248 | -5% $-191 | +0% $-134 | +5% $-77 | +10% $-20 |
| Rate | -1.0pp $-28 | -0.5pp $-80 | base $-134 | +0.5pp $-188 | +1.0pp $-244 |
UW: 25.0% down · 7.5% · 30yr · 1.5% tax · 5.0% vac · 8.0% maint · 8.0% mgmt
Financing live
Cash to close
- Down payment
- $52,475
- Closing costs
- $6,297
- Reserves months
- —
- Total cash needed
- —
Loan-product check · same deal, 3 products live
Conventional
25% down · 7.5% · 30yr
- Down + closing
- —
- Monthly P&I
- —
- Monthly cashflow
- —
- DSCR
- —
- Eligible?
- —
Personal DTI + credit; lowest rate.
DSCR
20% down · 8.5% · 30yr
- Down + closing
- —
- Monthly P&I
- —
- Monthly cashflow
- —
- DSCR
- —
- Eligible?
- —
No personal income docs; deal must DSCR.
Hard money
10% down · 12.0% · 12mo
- Down + closing
- —
- Monthly P&I
- —
- Monthly cashflow
- —
- DSCR
- —
- Eligible?
- —
Short-term bridge; refi at stabilization.
Rent comps 2 comps
| Address | Beds | Baths | Sqft | Rent | $/sqft | DOM | Units | Dist |
|---|---|---|---|---|---|---|---|---|
| 5428 Bagnall Dr Jefferson City, MO | 3.0 | 2.0 | 1394 | $1,525 | $1.09 | 45d | 1 | 0.23mi |
| 1043 Emily Ln Unit 1045 Jefferson City, MO | 3.0 | 2.0 | 1450 | $1,350 | $0.93 | 23d | 1 | 1.45mi |
Listing history 2 events
-
2026-04-19status Pending
-
2026-04-17$209,900 Active
ⓘ Source: listings_history table (triggers on properties + properties_extension) + one-shot
backfill from property_details.listing_events for pre-trigger history.
Tax reassessment forecast MO · Resets to sale price
- Current annual tax
- $996 · $83/mo
- Projected year-2 tax
- $2,036 · $170/mo
- Expected delta
- +$1,040/yr (+$87/mo · 104.3%)
ⓘ Screening estimate from a state-policy table — verify with the county assessor before closing.
Climate risk First Street
- Flood 1/10 Low FEMA zone X (unshaded) · 0% chance over 30 yrs
- Wildfire 3/10 Moderate
- Heat 4/10 Moderate 7 d/yr ≥106°F today · 19 d/yr by 30 yrs out
- Wind 2/10 Low 0% chance of damaging wind over 30 yrs
- Air quality 2/10 Low 0 unhealthy d/yr today · 1 by 30 yrs out
Nearby sold comps map
Loading sold comps map…
Walkable amenities ~0.75 mi
Loading nearby amenities…
Taxation est. · year 1
- Rental income
- $17,277
- − Mortgage interest
- −$11,758
- − Property taxes
- −$996
- − Insurance
- −$1,050
- − Repairs & maintenance
- −$1,382
- − Management
- −$1,382
- − Depreciation
- −$6,106
- Taxable loss
- −$5,397
- Est. tax savings @ 24.0%
- +$1,295
- After-tax cash flow
- $-310/yr
For passive investors: Depreciation is non-cash, so a rental often shows a tax loss while cash-flowing — sheltering income. Rental losses are passive: they offset passive income freely, and up to $25,000/yr can offset ordinary (W-2) income if you actively participate and your MAGI is under $100k (phasing out to $0 by $150k); unused losses carry forward. On sale, claimed depreciation is recaptured at up to 25%, and gains may owe capital-gains tax (a 1031 exchange can defer both). Figures are a year-1 estimate at your 24.0% rate — not tax advice; consult a CPA.
Schools (NCES district)
- District
- Jefferson City
- NCES district ID
- 2916190
- Math proficiency
- 34% ▼ -1.00%
- Reading proficiency
- 48% ▲ 5.00%
- Median HH income
- $51,903
- Composite
- 35.45/100
- National rank
- #4930
- State rank
- #121 of 324 in MO
Livability — Jefferson City
- Score
- 83/100
- State rank
- #7
- US rank
- #838
Category grades
Schools grade is shown separately in the Schools card above.
Census & demographics
- County
- Cole County · 41,145 people
- City population
- 41,145
- Metro
- Jefferson City, MO
- Population (ZIP)
- 41,145
- Household income
- $74,694
- Rent vs Own
- Severe rent burden
- 984.0
Population outlook (Cole County) Hauer SSP2
- Today (2025)
- 78,107 people
- By 2030
- 78,089 · +-0.0%
- By 2040
- 76,814 · -1.7%
- By 2050
- 74,515 · -4.6%
- By 2075
- 67,687 · -13.3%
- By 2100
- 55,023 · -29.6%
Race, ethnicity, and origin ACS 2023
- Neighborhood character
- Predominantly White (82%)
- Race & ethnicity
- White 82% Black 7% Two or more races 5% Hispanic / Latino 4% Asian 3%
- Common ancestry
- Lithuanian 3% Italian 2% Slovak 2%
- Foreign-born
- 3% · Canada, China
- Languages at home
- 95% English-only · Spanish 1% Other Indo-European 1% Other Asian/Pacific 1%
Political lean MEDSL · Cole
- 2024 margin
- Solid R (+34.4) · D 32.1% · R 66.5% · Other 1.4%
- 2008→2024 swing
- -7.5pp toward R · 2008: -26.9pp · 2024: -34.4pp
- All cycles
- 2024: R+34.4 2020: R+33.9 2016: R+36.8 2012: R+33.7 2008: R+26.9
Not yet ingested
- Civics
- —
Market trends
- HPI YoY
- ▼ -83.14%
- Current HPI
- 202.01
- Rent YoY
- ▲ 10.19%
- Metro
- Jefferson City, MO
- State GDP YoY
- ▲ 1.84%
- F500 in state
- 20
Industry mix (Fortune 500 HQ in MO)
| Industry | F500 HQs | Revenue |
|---|---|---|
| Healthcare | 1 | $163B |
|
||
| Insurance | 1 | $21B |
|
||
| Industrial Technology | 1 | $17B |
|
||
| Retail | 1 | $16B |
|
||
| Industrial Distribution | 1 | $10B |
|
||
| Utilities | 1 | $9B |
|
||
Price history
2 events — show timeline
- 2026-04-19 Pending — JCMLS
- 2026-04-17 Listed $209,900 JCMLS
Property tax history
+3.2%/yrLatest (2025): $996 · +11.1% YoY. Source: county tax records.
Cash-flow waterfall
monthlySold comps — $/sqft
last 12 mo · ≤1 miLoading sold comps…