2280 Prytania Cir · Navarre, FL
Flood risk 1/10 · Minimal
- FEMA flood zone
- X (unshaded)
- Chance of flooding over 30 yrs
- 0.0%
- Est. flood insurance / yr
- $507 – $1,088
Fire risk 6/10 · Moderate
- Est. fire insurance / yr
- $947 – $1,759
Heat risk 10/10 · Severe
- Hot days now (above 104°F)
- 7 days/yr
- Hot days in 30 yrs
- 23 days/yr
Wind risk 9/10 · Severe
- Chance of severe wind over 30 yrs
- 99.0%
Air-quality risk 2/10 · Minimal
- Unhealthy air days now
- 1 days/yr
- Unhealthy air days in 30 yrs
- 2 days/yr
Risk factors via First Street. Map © Google.
Why this score? — see what drove the C grade
The composite is a weighted blend of 9 inputs, each scored 0–100. Each bar is that input's sub-score; the figure is the points it added to the 100-point composite (weight × sub-score).
- Cash flow +17.9/30.0
- ARV discount +15.0/15.0
- DSCR +5.6/10.0
- Schools +5.3/10.0
- 1% rule +3.8/10.0
- Livability +3.5/5.0
- Rent growth +3.2/5.0
- Condition / age +2.5/5.0
- Appreciation +0.0/10.0
$269,900
🖨 Deal sheet 📄 Offer letter ✓ Due diligence
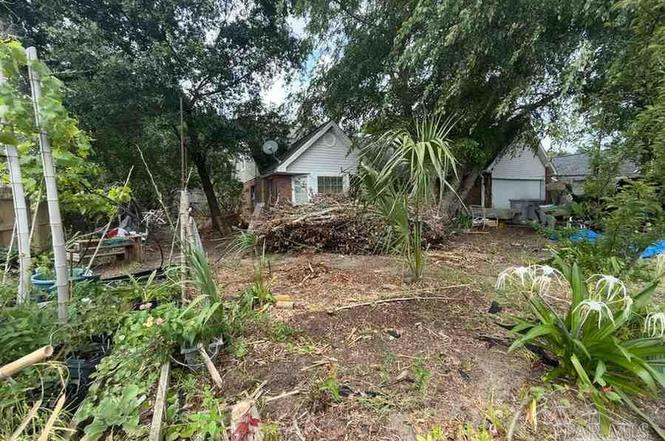
Listing remarks
Bring your vision to 2280 Prytania Cir in Navarre! This spacious 4-bedroom, 2-bath home offers 2,239 square feet, a brick/vinyl exterior, and a slab foundation in a desirable Navarre location. With a 5-year-old HVAC system already in place, this property is ready for its next chapter. The home will need a roof replacement, full renovation, interior updates, and property cleanup, including ceiling drywall repair from prior roof leaks. With generous square footage, a functional layout, and strong upside potential, this is a great opportunity for buyers looking to renovate, customize, or add value. Whether you're searching for your next project, rental, or resale opportunity, this one has the
Key facts
- Slab foundation
- Brick vinyl exterior
- Roof replacement
Tags
Property features AI
Finance
- Other: Lot approximately 0.26 acres (dimensions ~90 x 125)
- Financial info: No investor or income/expense details provided
- HOA & community: No association (association fees noted as annually if applicable)
Exterior
- Parking: Attached garage (1 garage space, 1 covered space, total 1 parking space)
- Security: No specific security features provided
- Utilities: Electric service with circuit breakers; Public water; Public sewer
- Home design: Two-story home; Resale property; Not attached to another property; Entry level information not specified
- Construction: Brick and frame construction; Off-grade foundation; Built previously (not new construction)
- Exterior features: Composition roof; Paved road access; Public water; Public sewer; No horses allowed
Interior
- Kitchen: No water heater listed (appliances not updated)
- Bedrooms: Master bedroom on the first level (approximately 10 x 10); Second bedroom on the first level (approximately 10 x 10); Third bedroom on the first level (approximately 10 x 10)
- Flooring: Tile; Carpet
- Bathrooms: Three full bathrooms
- Heating & cooling: Open loop geothermal heat pump; Ceiling fan(s)
- Interior features: Tile and carpet flooring; Ceiling fan(s)
- Laundry & utility: No specific laundry or utility details provided
Neighborhood map
What this means for you Summary
Snapshot
- This is a 4-bed/3.0-bath single-family listed at $270k.
Deal economics
- At list price, monthly cash flow is $229 ($3k/yr) — positive.
- The deal already cash-flows at list — no discount required.
- To meet the 1% rule (rent ≥ 1% of price), the offer needs to be $236k (12.4% below list).
- Recommended offer: $236k (12.4% below list) — sets the bar for 1% rule.
- Cap rate 7.3% vs local median 4.2% in Navarre — top-decile yield for the area; either an underpriced asset or a hidden risk that comps aren't pricing in. Stress-test before assuming the spread holds.
Location & tenants
- Location reads 70/100 on livability (#435 in FL) — a middle-class / working-renter tenant base. Strengths: housing A+, employment A, schools A-; Watch: health & safety C-, amenities F, commute F.
- Santa Rosa (suburban): math 63% / reading 60% proficiency, ranked #8 of 73 in FL (top 11%) — acceptable for families but not a draw, mixed tenant base, ~2y average lease.
- Market conditions: Rents rising (+2.7%/yr); 768 active listings in the ZIP; 22 comparable units currently listed for rent nearby; rentals at typical pace (median 24d on market — plan ~3-4 weeks tenant-placement turnaround); solid renter incomes; 1,983 units permitted in Santa Rosa County in 2024 (128 in 5+ unit buildings).
Forward outlook
- Local home prices are declining (-3.0%/yr); year-one equity from $2k of loan paydown is wiped out by about $8k of value loss. Plan a longer hold.
- Santa Rosa County population projected at +31% by 2050 — long-run rental-demand tailwind backs the buy-and-hold thesis.
Negotiation context
- Only 8 days on market — expect competitive offers; lowballing is unlikely to land.
- 3 sale attempts since 28y ago with the ask held roughly flat each time — persistent listings suggest the price (not the market) is what's stuck; bring a comps-based counter.
- Current owner paid $120k; list at $270k implies a 126% gain — meaningful room to come down on a strong offer.
Risks & watch-outs
- Climate carrying-cost: severe wind risk, 99% chance of damaging wind over 30y; major wildfire risk; extreme-heat days projected 7→23/yr by 2055 (HVAC capex compounding) — expect insurance premiums to compound above CPI over the hold.
Questions for the listing agent
- Is there a deadline driving the sale (1031 exchange, divorce, estate, relocation)? That informs how much negotiation room exists.
- Schools are A-rated — typically a magnet for longer-tenancy family renters. What's the average tenant stay here, and is there a school-zone premium baked into asking?
- What's the average days-on-market for RENTAL listings here right now (not sales)? A rising rental-DOM trend means longer vacancies and softer asking-rent achievability than the comps imply.
- What's the recent tenant-quality profile in this submarket — average credit score on applications, eviction rate, late-payment / NSF rate, and stable-employment percentage? A property-management company in the area should have these aggregated.
- How much new for-sale + rental construction is in the pipeline within 1–3 miles? Heavy new supply typically softens prices + rents 12–24 months out; constrained supply supports both.
Investment metrics
- 1% rule
- 0.88% ✗
- Cap rate
- 7.31%
- Cash-on-cash
- 3.64%
- DSCR
- 1.16
- GRM
- 9.5
CMA / ARV
- ARV (on-the-fly)
- $503,775
- Comps found
- 12
Show comp detail 12 sales within ~0.75 mi
| Address | Dist | Beds/Ba | Sqft | Sold | Price | $/sf | Match |
|---|---|---|---|---|---|---|---|
| 9412 Pouder Ln | 0.30mi | 4/2.0 | 2,337 (+4%) | 0mo | $465,000 | $199 | 74 |
| 2345 Prytania Cir | 0.18mi | 4/3.0 | 2,481 (+11%) | 2mo | $430,000 | $173 | 72 |
| 9283 Ridge Dr | 0.22mi | 4/2.0 | 2,015 (-10%) | 5mo | $489,900 | $243 | 65 |
| 2078 Wiregrass St | 0.62mi | 4/2.5 | 2,296 (+2%) | 1mo | $469,900 | $205 | 64 |
| 2102 Palmetto Lake Dr | 0.67mi | 4/3.0 | 2,318 (+4%) | 2mo | $570,000 | $246 | 61 |
| 2310 Miami Ct | 0.56mi | 4/2.0 | 2,322 (+4%) | 7mo | $459,900 | $198 | 58 |
| 9119 Timber Ln | 0.72mi | 4/2.0 | 2,182 (-2%) | 3mo | $430,000 | $197 | 56 |
| 2548 Bluewater Dr | 0.67mi | 4/3.5 | 2,409 (+8%) | 3mo | $570,000 | $237 | 52 |
| 9152 Timber Ln | 0.60mi | 4/2.0 | 2,019 (-10%) | 1mo | $441,500 | $219 | 51 |
| 1955 Wiregrass St | 0.63mi | 5/3.0 (+1) | 2,043 (-9%) | 1mo | $462,400 | $226 | 50 |
| 2086 Wiregrass St | 0.62mi | 5/3.0 (+1) | 2,043 (-9%) | 2mo | $459,310 | $225 | 50 |
| 2066 Wiregrass St | 0.73mi | 5/3.0 (+1) | 2,043 (-9%) | 0mo | $459,900 | $225 | 46 |
Match score weights: distance 35% · size 25% · config 20% · recency 20%. Top-matched comps best support the ARV.
Projected returns pro-forma
-3.0% appreciation · 2.74% rent growth · sell at horizon
- IRR
- -10.9%
- Equity multiple
- 0.61×
- Total profit
- $-29,851
- Equity at exit
- $40,243
- IRR
- -2.0%
- Equity multiple
- 0.87×
- Total profit
- $-10,126
- Equity at exit
- $23,336
Cash invested: $75,572 (down + closing). Projections, not guarantees.
Landlord ↔ Tenant lean methodology
- Overall (STATE)
- 87 Strongly Landlord-Friendly
- State Florida
- 87 Strongly Landlord-Friendly · R+3
- County
- — inherits STATE
- City
- — inherits STATE
ZIP-level market 32566
- Home prices YoY
- -26.2%
- Rents YoY
- 2.7%
- Active inventory
- 768
- Price-to-rent
- 9.5×
Monthly cashflow live
- Estimated rent
- $2,364 high interval (Pro) →
- Mortgage (P&I)
- −$1,415
- Tax from tax record
- −$110 /mo · $1,326/yr
- Insurance
- −$112
- HOA
- −$0
- Vacancy / Maint / Mgmt
- −$496
- Net cashflow
- $229
Break-even live
UW: 25.0% down · 7.5% · 30yr · 1.5% tax · 5.0% vac · 8.0% maint · 8.0% mgmt
Financing live
Cash to close
- Down payment
- $67,475
- Closing costs
- $8,097
- Reserves months
- —
- Total cash needed
- —
Loan-product check · same deal, 3 products live
Conventional
25% down · 7.5% · 30yr
- Down + closing
- —
- Monthly P&I
- —
- Monthly cashflow
- —
- DSCR
- —
- Eligible?
- —
Personal DTI + credit; lowest rate.
DSCR
20% down · 8.5% · 30yr
- Down + closing
- —
- Monthly P&I
- —
- Monthly cashflow
- —
- DSCR
- —
- Eligible?
- —
No personal income docs; deal must DSCR.
Hard money
10% down · 12.0% · 12mo
- Down + closing
- —
- Monthly P&I
- —
- Monthly cashflow
- —
- DSCR
- —
- Eligible?
- —
Short-term bridge; refi at stabilization.
Rent comps 22 comps
| Address | Beds | Baths | Sqft | Rent | $/sqft | DOM | Units | Dist |
|---|---|---|---|---|---|---|---|---|
| 2225 Prytania Cir Navarre, FL | 3.0 | 2.0 | 1529 | $2,150 | $1.41 | 23d | 1 | 0.16mi |
| 2225 Prytania Cir Navarre, FL | 3.0 | 2.0 | 1529 | $2,150 | $1.41 | 14d | 1 | 0.16mi |
| 9523 Parker Place Dr Navarre, FL | 3.0 | 2.0 | 1700 | $1,850 | $1.09 | 23d | 1 | 0.46mi |
| 2212 Peachwood Ct Navarre, FL | 3.0 | 2.0 | 1750 | $2,200 | $1.26 | 23d | 1 | 0.48mi |
| 9332 Vandivere Dr Navarre, FL | 4.0 | 2.0 | 2567 | $2,750 | $1.07 | 23d | 1 | 0.53mi |
| 2109 Bellemeade Cir Navarre, FL | 3.0 | 2.0 | 1658 | $1,900 | $1.15 | 14d | 1 | 0.81mi |
| 2109 Bellemeade Cir Navarre, FL | 3.0 | 2.0 | 1658 | $1,900 | $1.15 | 23d | 1 | 0.81mi |
| 2281 Tom St Navarre, FL | 3.0 | 2.0 | 1604 | $2,295 | $1.43 | 23d | 1 | 0.95mi |
| 2170 Tom St Navarre, FL | 3.0 | 2.0 | 1400 | $1,750 | $1.25 | 23d | 1 | 1.02mi |
| 2127 Tom St Unit 2127 Navarre, FL | 3.0 | 2.5 | 1400 | $1,750 | $1.25 | 23d | 1 | 1.03mi |
| 2123 Tom St Navarre, FL | 3.0 | 2.0 | 1400 | $1,900 | $1.36 | 23d | 1 | 1.03mi |
| 2107 Nina St Navarre, FL | 3.0 | 2.0 | 1738 | $2,400 | $1.38 | 14d | 1 | 1.09mi |
| 2244 Hadleigh Hills Ct Navarre, FL | 3.0 | 2.5 | 1664 | $1,995 | $1.20 | 23d | 1 | 1.12mi |
| 8958 Ellen Ct Navarre, FL | 3.0 | 2.0 | 1627 | $2,250 | $1.38 | 14d | 1 | 1.14mi |
| 8934 E River Dr Navarre, FL | 4.0 | 2.0 | 1989 | $2,500 | $1.26 | 23d | 1 | 1.18mi |
| 2121 Wilsons Plover Cir Navarre, FL | 3.0 | 2.0 | 1544 | $2,000 | $1.30 | 23d | 1 | 1.32mi |
| 2345 Ortega St Navarre, FL | 3.0 | 2.0 | 1527 | $2,200 | $1.44 | 14d | 1 | 1.38mi |
| 2345 Ortega St Navarre, FL | 3.0 | 2.0 | 1527 | $2,200 | $1.44 | 23d | 1 | 1.38mi |
| 8740 Brown Pelican Cir Navarre, FL | 3.0 | 2.5 | 1742 | $1,850 | $1.06 | 21d | 1 | 1.43mi |
| 8733 Brown Pelican Cir Navarre, FL | 3.0 | 2.5 | 1500 | $1,950 | $1.30 | 14d | 1 | 1.46mi |
| 8733 Brown Pelican Cir Navarre, FL | 3.0 | 2.5 | 1551 | $1,950 | $1.26 | 23d | 1 | 1.46mi |
| 8776 Brown Pelican Cir Navarre, FL | 3.0 | 2.5 | 1551 | $1,900 | $1.23 | 23d | 1 | 1.48mi |
Listing history 7 events
-
2026-06-18days on market $269,900 Active 8 DOM
-
2026-06-17days on market $269,900 Active 7 DOM
-
2026-06-16days on market $269,900 Active 6 DOM
-
2026-06-15days on market $269,900 Active 5 DOM
-
2026-06-14days on market $269,900 Active 3 DOM
-
2026-06-13remarks 699-char remark
-
2026-06-13$269,900 Active 2 DOM
ⓘ Source: listings_history table (triggers on properties + properties_extension) + one-shot
backfill from property_details.listing_events for pre-trigger history.
Tax reassessment forecast FL · Resets to sale price
- Current annual tax
- $1,326 · $110/mo
- Projected year-2 tax
- $2,240 · $187/mo
- Expected delta
- +$914/yr (+$76/mo · 69.0%)
ⓘ Screening estimate from a state-policy table — verify with the county assessor before closing.
Climate risk First Street
- Flood 1/10 Low FEMA zone X (unshaded) · 0% chance over 30 yrs
- Wildfire 6/10 Major
- Heat 10/10 Extreme 7 d/yr ≥104°F today · 23 d/yr by 30 yrs out
- Wind 9/10 Extreme 99% chance of damaging wind over 30 yrs
- Air quality 2/10 Low 1 unhealthy d/yr today · 2 by 30 yrs out
Nearby sold comps map
Loading sold comps map…
Walkable amenities ~0.75 mi
Loading nearby amenities…
Taxation est. · year 1
- Rental income
- $28,369
- − Mortgage interest
- −$15,119
- − Property taxes
- −$1,326
- − Insurance
- −$1,350
- − Repairs & maintenance
- −$2,270
- − Management
- −$2,270
- − Depreciation
- −$7,852
- Taxable loss
- −$1,815
- Est. tax savings @ 24.0%
- +$436
- After-tax cash flow
- $3,188/yr
For passive investors: Depreciation is non-cash, so a rental often shows a tax loss while cash-flowing — sheltering income. Rental losses are passive: they offset passive income freely, and up to $25,000/yr can offset ordinary (W-2) income if you actively participate and your MAGI is under $100k (phasing out to $0 by $150k); unused losses carry forward. On sale, claimed depreciation is recaptured at up to 25%, and gains may owe capital-gains tax (a 1031 exchange can defer both). Figures are a year-1 estimate at your 24.0% rate — not tax advice; consult a CPA.
Schools (NCES district)
- District
- Santa Rosa
- NCES district ID
- 1201650
- Math proficiency
- 63% ▼ -6.00%
- Reading proficiency
- 60% ▼ -5.00%
- Median HH income
- $58,161
- Composite
- 53.12/100
- National rank
- #1511
- State rank
- #8 of 73 in FL
Livability — Navarre
- Score
- 70/100
- State rank
- #435
- US rank
- #7790
Category grades
Schools grade is shown separately in the Schools card above.
Census & demographics
- Census place
- Navarre, FL
- County
- Santa Rosa County · 194,764 people
- City population
- 43,883
- Metro
- Pensacola-Ferry Pass-Brent, FL
- Population (ZIP)
- 43,883
- Household income
- $105,551
- Rent vs Own
- Severe rent burden
- 608.0
Population outlook (Santa Rosa County) Hauer SSP2
- Today (2025)
- 195,978 people
- By 2030
- 209,782 · +7.0%
- By 2040
- 235,293 · +20.1%
- By 2050
- 256,408 · +30.8%
- By 2075
- 298,074 · +52.1%
- By 2100
- 303,216 · +54.7%
Race, ethnicity, and origin ACS 2023
- Neighborhood character
- Predominantly White (75%)
- Race & ethnicity
- White 75% Two or more races 9% Hispanic / Latino 9% Black 6% Asian 3%
- Hispanic origin (detail)
- Mexican 3% Puerto Rican 2%
- Common ancestry
- Scotch-Irish 3% Lithuanian 3% Romanian 2%
- Foreign-born
- 6% · Canada, Jamaica, Vietnam
- Languages at home
- 92% English-only · Spanish 4% German/W. Germanic 1% Tagalog/Filipino 1%
Political lean MEDSL · Santa Rosa
- 2024 margin
- Solid R (+51.0) · D 24.1% · R 75.0%
- 2008→2024 swing
- -3.0pp toward R · 2008: -47.9pp · 2024: -51.0pp
- All cycles
- 2024: R+51.0 2020: R+46.5 2016: R+53.5 2012: R+52.6 2008: R+47.9
Not yet ingested
- Civics
- —
Market trends
- HPI YoY
- ▼ -105.87%
- Current HPI
- 298.6821
- Rent YoY
- ▲ 2.74%
- Metro
- Pensacola-Ferry Pass-Brent, FL
- State GDP YoY
- ▲ 3.28%
- F500 in state
- 36
Industry mix (Fortune 500 HQ in FL)
| Industry | F500 HQs | Revenue |
|---|---|---|
| Industrial Technology | 2 | $29B |
|
||
| Insurance | 2 | $17B |
|
||
| Retail | 1 | $60B |
|
||
| Technology Distribution | 1 | $58B |
|
||
| Homebuilding | 1 | $35B |
|
||
| Technology Manufacturing | 1 | $35B |
|
||
Price history
+128.9% since first listed4 events — show timeline
- 2026-06-10 Listed $269,900 PARMLS
- 1998-11-05 Sold (Public Records) $119,500 Public Records
- 1998-02-23 Listed $117,900 ECAR
- 1998-02-23 Listed $117,900 ECAR
Property tax history
-1.7%/yrLatest (2025): $1,326 · +4.5% YoY. Source: county tax records.
Cash-flow waterfall
monthlySold comps — $/sqft
last 12 mo · ≤1 miLoading sold comps…