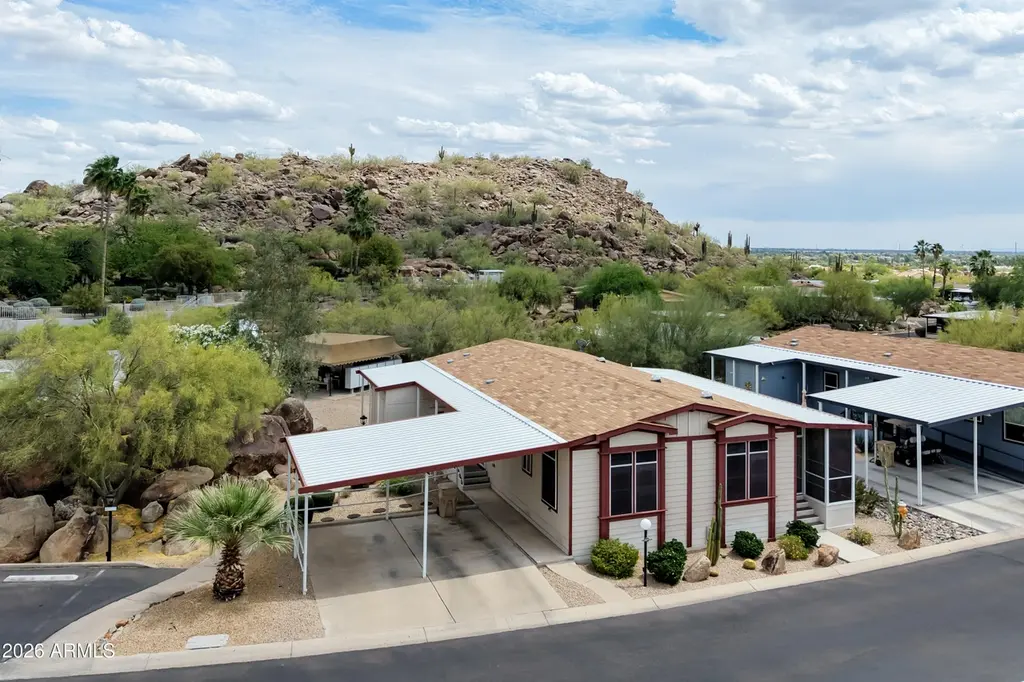
2233 E Behrend Dr #169 · Phoenix, AZ
Flood risk 1/10 · Minimal
- FEMA flood zone
- X (shaded)
- Chance of flooding over 30 yrs
- 0.0%
- Est. flood insurance / yr
- $507 – $1,088
Fire risk 4/10 · Minor
- Est. fire insurance / yr
- $610 – $1,132
Heat risk 8/10 · Major
- Hot days now (above 110°F)
- 5 days/yr
- Hot days in 30 yrs
- 13 days/yr
Wind risk 1/10 · Minimal
- Chance of severe wind over 30 yrs
- —
Air-quality risk 3/10 · Minor
- Unhealthy air days now
- 3 days/yr
- Unhealthy air days in 30 yrs
- 5 days/yr
Risk factors via First Street. Map © Google.
Why this score? — see what drove the C+ grade
The composite is a weighted blend of 9 inputs, each scored 0–100. Each bar is that input's sub-score; the figure is the points it added to the 100-point composite (weight × sub-score).
- Cash flow +30.0/30.0
- DSCR +10.0/10.0
- 1% rule +8.8/10.0
- Condition / age +4.0/5.0
- Schools +3.8/10.0
- Livability +3.8/5.0
- Rent growth +2.9/5.0
- ARV discount +0.0/15.0
- Appreciation +0.0/10.0
$185,000
🖨 Deal sheet 📄 Offer letter ✓ Due diligence
Listing remarks
Beautiful 2015 Champion Home, 1,624 sq. ft. , nestled beside natural boulders with a large screened-in patio and mountain views. Open great room with oversized island, upgraded cabinets with tall uppers, crown molding, and deep drawers. 3 bed, 2 bath with spacious layout. Primary suite features tray ceiling; third bedroom (ideal office/den) has private slider to porch. Side-by-side covered parking. Upgrades include new flooring, skylight tubes, plantation shutters, Toto toilet/bidet, replaced interior A/C system, whole-house water filtration, new water heater, and new microwave. Dining room light conveys. Short walk to pool and clubhouse. Buyer must be park approved: 750+ credit score, 3x l
Key facts
- 2 parking spots
- Community pool
- Built 2015
Property features AI
Finance
- Other: Building area reported by builder
- HOA & community: Land lease (approx. $1,010 monthly); Association covers grounds maintenance, street maintenance, and trash; Community amenities include pool, heated spa, pickleball courts, tennis courts, fitness center, and proximity to bus stop
Exterior
- Parking: 2 covered parking spaces; 2 carport spaces
- Security: Gated community
- Utilities: City water; Public sewer
- Home design: Manufactured/mobile home; Leasehold ownership; Mountain views
- Construction: Wood frame construction; Painted exterior; Composition roof
- Exterior features: Storage; Desert front and back landscaping; Gravel/stone in back yard; Automatic timer irrigation in front
Interior
- Kitchen: Built-in microwave; Laminate counters; Refrigerator; Dishwasher; Garbage disposal; Water purifier
- Bedrooms: Up to 4 possible bedrooms
- Flooring: Laminate flooring
- Bathrooms: 2 full bathrooms
- Heating & cooling: Electric heating; Central air conditioning; Ceiling fans; Programmable thermostat
- Interior features: High-speed internet available; Double vanities; Breakfast bar; No interior steps; Vaulted ceilings; Kitchen island; Pantry; Full bathroom in primary bedroom suite; Skylights; Dual-pane windows
- Laundry & utility: Laundry inside the home
Neighborhood map
What this means for you Summary
Snapshot
- This is a 3-bed/2.0-bath manufactured listed at $185k. Condition is rated good.
Deal economics
- At list price, monthly cash flow is $743 ($9k/yr) — positive.
- The deal already cash-flows at list — no discount required.
- Meets the 1% rule at list price ($3k rent vs $185k).
- Recommended offer: $182k (1.5% below list) — sets the bar for market timing.
- Cap rate 11.1% vs local median 3.3% in Phoenix — top-decile yield for the area; either an underpriced asset or a hidden risk that comps aren't pricing in. Stress-test before assuming the spread holds.
Location & tenants
- Location reads 75/100 on livability (#16 in AZ, #3,924 nationally) — a middle-class / working-renter tenant base. Strengths: amenities A+, commute A+, housing A+; Watch: health & safety C-, crime F.
- Paradise Valley Unified District (4241) (urban): math 39% / reading 46% proficiency, ranked #56 of 249 in AZ (top 22%) — families likely to look elsewhere, expect single-tenant / working-renter base with shorter leases.
- Market conditions: Rents rising (+1.4%/yr); 201 active listings in the ZIP; 40 comparable units currently listed for rent nearby; rentals leasing fast (median 8d on market — plan ~1-2 weeks tenant-placement turnaround); solid renter incomes; 36,011 units permitted in Maricopa County in 2024 (12,801 in 5+ unit buildings).
Forward outlook
- Local home prices are declining (-3.0%/yr); year-one equity from $1k of loan paydown is wiped out by about $6k of value loss. Plan a longer hold.
- Maricopa County population projected at +38% by 2050 — long-run rental-demand tailwind backs the buy-and-hold thesis.
- At projected returns (-3.0% appreciation + 1.4% rent growth), your $52k cash investment doubles in ~8 years — after that, you're playing with house money.
Negotiation context
- It's been on market 25 days — a 2% lower offer ($182k) is reasonable based on typical stale-listing flexibility.
Risks & watch-outs
- Climate carrying-cost: extreme-heat days projected 5→13/yr by 2055 (HVAC capex compounding) — expect insurance premiums to compound above CPI over the hold.
Questions for the listing agent
- Is there a deadline driving the sale (1031 exchange, divorce, estate, relocation)? That informs how much negotiation room exists.
- Crime grade is F in this area — have there been break-ins, vandalism, or insurance claims at this property in the last 3 years? What carrier currently insures it and at what premium?
- What's the average days-on-market for RENTAL listings here right now (not sales)? A rising rental-DOM trend means longer vacancies and softer asking-rent achievability than the comps imply.
- What's the recent tenant-quality profile in this submarket — average credit score on applications, eviction rate, late-payment / NSF rate, and stable-employment percentage? A property-management company in the area should have these aggregated.
- How much new for-sale + rental construction is in the pipeline within 1–3 miles? Heavy new supply typically softens prices + rents 12–24 months out; constrained supply supports both.
Investment metrics
- 1% rule
- 1.38% ✓
- Cap rate
- 11.11%
- Cash-on-cash
- 17.21%
- DSCR
- 1.77
- GRM
- 6.0
CMA / ARV
- ARV (on-the-fly)
- $146,672
- Comps found
- 12
Show comp detail 12 sales within ~0.75 mi
| Address | Dist | Beds/Ba | Sqft | Sold | Price | $/sf | Match |
|---|---|---|---|---|---|---|---|
| 2233 E Behrend Dr #48 | 0.00mi | 2/2.0 (-1) | 1,568 (-5%) | 1mo | $70,000 | $45 | 86 |
| 2233 E Behrend Dr #250 | 0.00mi | 3/2.0 | 1,736 (+5%) | 6mo | $149,500 | $86 | 86 |
| 2233 E Behrend Dr #34 | 0.15mi | 2/2.0 (-1) | 1,680 (+2%) | 1mo | $28,000 | $17 | 84 |
| 2233 E Behrend Dr #203 | 0.14mi | 4/2.0 (+1) | 1,680 (+2%) | 5mo | $170,000 | $101 | 81 |
| 2233 E Behrend Dr #26 | 0.00mi | 3/2.0 | 1,456 (-12%) | 5mo | $125,000 | $86 | 76 |
| 2233 E Behrend Dr #222 | 0.00mi | 3/2.0 | 1,806 (+10%) | 9mo | $170,000 | $94 | 76 |
| 2233 E Behrend Dr #17 | 0.18mi | 3/2.0 | 1,512 (-8%) | 6mo | $135,000 | $89 | 73 |
| 2233 E Behrend Dr #197 | 0.09mi | 2/2.0 (-1) | 1,456 (-12%) | 7mo | $145,000 | $100 | 65 |
| 2233 E Behrend Dr #76 | 0.14mi | 3/2.0 | 1,456 (-12%) | 14mo | $66,000 | $45 | 62 |
| 2431 E Tonto Ln | 0.39mi | 3/2.0 | 1,792 (+9%) | 8mo | $330,000 | $184 | 61 |
| 2120 E Bluefield Ave #123 | 0.67mi | 4/2.0 (+1) | 1,664 (+1%) | 12mo | $135,000 | $81 | 52 |
| 2120 E Bluefield Ave #127 | 0.67mi | 4/2.0 (+1) | 1,458 (-12%) | 13mo | $129,850 | $89 | 34 |
Match score weights: distance 35% · size 25% · config 20% · recency 20%. Top-matched comps best support the ARV.
Projected returns pro-forma
-3.0% appreciation · 1.44% rent growth · sell at horizon
- IRR
- 6.8%
- Equity multiple
- 1.26×
- Total profit
- $13,430
- Equity at exit
- $27,584
- IRR
- 14.7%
- Equity multiple
- 2.10×
- Total profit
- $57,061
- Equity at exit
- $15,995
Cash invested: $51,800 (down + closing). Projections, not guarantees.
Landlord ↔ Tenant lean methodology
- Overall (STATE)
- 87 Strongly Landlord-Friendly
- State Arizona
- 87 Strongly Landlord-Friendly · R+3
- County
- — inherits STATE
- City
- — inherits STATE
ZIP-level market 85024
- Home prices YoY
- -21.0%
- Rents YoY
- 1.4%
- Active inventory
- 201
- Price-to-rent
- 6.0×
Monthly cashflow live
- Estimated rent
- $2,559 high interval (Pro) →
- Mortgage (P&I)
- −$970
- Tax est. 1.5%
- −$231 /mo · $2,775/yr
- Insurance
- −$77
- HOA
- −$0
- Vacancy / Maint / Mgmt
- −$537
- Net cashflow
- $743
Break-even live
UW: 25.0% down · 7.5% · 30yr · 1.5% tax · 5.0% vac · 8.0% maint · 8.0% mgmt
Financing live
Cash to close
- Down payment
- $46,250
- Closing costs
- $5,550
- Reserves months
- —
- Total cash needed
- —
Loan-product check · same deal, 3 products live
Conventional
25% down · 7.5% · 30yr
- Down + closing
- —
- Monthly P&I
- —
- Monthly cashflow
- —
- DSCR
- —
- Eligible?
- —
Personal DTI + credit; lowest rate.
DSCR
20% down · 8.5% · 30yr
- Down + closing
- —
- Monthly P&I
- —
- Monthly cashflow
- —
- DSCR
- —
- Eligible?
- —
No personal income docs; deal must DSCR.
Hard money
10% down · 12.0% · 12mo
- Down + closing
- —
- Monthly P&I
- —
- Monthly cashflow
- —
- DSCR
- —
- Eligible?
- —
Short-term bridge; refi at stabilization.
Rent comps 40 comps
| Address | Beds | Baths | Sqft | Rent | $/sqft | DOM | Units | Dist |
|---|---|---|---|---|---|---|---|---|
| 2104 E Behrend Dr Phoenix, AZ | 4.0 | 2.5 | 2070 | $2,975 | $1.44 | 2d | 1 | 0.15mi |
| 2030 E Wahalla Ln Phoenix, AZ | 3.0 | 2.0 | 1400 | $2,115 | $1.51 | 2d | 1 | 0.25mi |
| 2336 E Utopia Rd Phoenix, AZ | 2.0–3.0 | 2.5 | 1327 | $2,395 | $1.80 | 5d | 1 | 0.27mi |
| 2335 E Utopia Rd Unit 16 Phoenix, AZ | 3.0 | 2.5 | 1426 | $2,550 | $1.79 | 18d | 1 | 0.28mi |
| 20007 N 20th Way Phoenix, AZ | 3.0 | 2.0 | 1251 | $3,900 | $3.12 | 43d | 1 | 0.28mi |
| 20053 N 21st Pl Phoenix, AZ | 4.0 | 2.0 | 1754 | $3,300 | $1.88 | 24d | 1 | 0.35mi |
| 20050 N Cave Creek Rd Phoenix, AZ | 1.0–2.0 | 1.0–2.0 | 909 | $1,770 | $1.95 | 1d | 10 | 0.37mi |
| 19635 N Cave Creek Rd Phoenix, AZ | 3.0 | 1.0–2.0 | 999 | $1,933 | $1.93 | 1d | 22 | 0.43mi |
| 2220 E Beardsley Rd Phoenix, AZ | 4.0 | 1.0–2.0 | 855 | $1,964 | $2.30 | 2d | 62 | 0.46mi |
| 2500 E Marco Polo Rd Phoenix, AZ | 2.0 | 1.0–2.0 | 918 | $2,390 | $2.60 | 2d | 16 | 0.48mi |
| 2239 E Morrow Dr Phoenix, AZ | 3.0 | 3.0 | 1545 | $2,199 | $1.42 | 2d | 1 | 0.49mi |
| 18611 N 22nd St Phoenix, AZ | 3.0 | 3.0 | 1851 | $2,200 | $1.19 | 12d | 1 | 0.54mi |
| 18611 N 22nd St #72 Phoenix, AZ | 3.0 | 2.5 | 1851 | $2,200 | $1.19 | 14d | 1 | 0.55mi |
| 18660 N Cave Creek Rd Phoenix, AZ | 1.0–3.0 | 1.0–2.0 | 961 | $1,955 | $2.03 | 1d | 11 | 0.58mi |
| 20445 N 21st St Phoenix, AZ | 3.0 | 2.5 | 2240 | $2,800 | $1.25 | 2d | 1 | 0.62mi |
| 2636 E Tonto Ln Phoenix, AZ | 3.0 | 2.0 | 1850 | $2,800 | $1.51 | 24d | 1 | 0.64mi |
| 2221 E Union Hills Dr #158 Phoenix, AZ | 3.0 | 2.0 | 1332 | $2,100 | $1.58 | 18d | 1 | 0.71mi |
| 20415 N 17th Pl Phoenix, AZ | 4.0 | 3.0 | 2248 | $2,950 | $1.31 | 7d | 1 | 0.71mi |
| 19460 N 27th Pl Phoenix, AZ | 4.0 | 2.0 | 1598 | $3,300 | $2.07 | 43d | 1 | 0.71mi |
| 1717 E Union Hills Dr Phoenix, AZ | 2.0–3.0 | 2.0 | 1169 | $4,000 | $3.42 | 3d | 3 | 0.80mi |
| 1717 E Union Hills Dr Phoenix, AZ | 2.0–3.0 | 2.0 | 1245 | $4,000 | $3.21 | 21d | 4 | 0.80mi |
| 1510 E Taro Ln Phoenix, AZ | 3.0 | 2.0 | 1136 | $2,149 | $1.89 | 24d | 1 | 0.82mi |
| 1717 E Union Hills Dr #1052 Phoenix, AZ | 2.0 | 2.0 | 1160 | $4,000 | $3.45 | 43d | 1 | 0.85mi |
| 1506 E Wescott Dr Phoenix, AZ | 3.0 | 2.0 | 1136 | $2,045 | $1.80 | 5d | 1 | 0.85mi |
| 1420 E Topeka Dr Phoenix, AZ | 3.0 | 2.5 | 1464 | $2,215 | $1.51 | 7d | 1 | 0.94mi |
| 18633 N 15th St Phoenix, AZ | 3.0 | 2.0 | 1240 | $2,249 | $1.81 | 7d | 1 | 0.95mi |
| 1440 E Renee Dr Phoenix, AZ | 3.0 | 2.0 | 1632 | $2,200 | $1.35 | 24d | 1 | 1.01mi |
| 2934 E Blackhawk Dr Phoenix, AZ | 3.0 | 2.0 | 1467 | $2,280 | $1.55 | 1d | 1 | 1.07mi |
| 3002 E Jeanette Ct Phoenix, AZ | 3.0 | 2.0 | 1748 | $2,700 | $1.54 | 17d | 1 | 1.08mi |
| 2554 E Villa Rita Dr Phoenix, AZ | 2.0 | 1.0 | 1118 | $2,750 | $2.46 | 24d | 1 | 1.09mi |
| 1702 E Michelle Dr Phoenix, AZ | 2.0 | 2.0 | 1300 | $2,200 | $1.69 | 4d | 1 | 1.10mi |
| 18626 N 29th Pl Phoenix, AZ | 4.0 | 2.0 | 1600 | $2,995 | $1.87 | 7d | 1 | 1.10mi |
| 20223 N 30th St Phoenix, AZ | 3.0 | 2.0 | 1467 | $2,300 | $1.57 | 1d | 1 | 1.13mi |
| 2755 E Michigan Ave Phoenix, AZ | 3.0 | 2.0 | 1316 | $2,700 | $2.05 | 17d | 1 | 1.15mi |
| 2602 E Charleston Ave Phoenix, AZ | 3.0 | 2.0 | 1426 | $2,100 | $1.47 | 24d | 1 | 1.16mi |
| 19246 N 31st St Phoenix, AZ | 4.0 | 2.0 | 1370 | $2,375 | $1.73 | 7d | 1 | 1.18mi |
| 17833 N 26th St Phoenix, AZ | 4.0 | 2.0 | 1220 | $2,397 | $1.96 | 1d | 1 | 1.18mi |
| 3039 E Hononegh Dr Phoenix, AZ | 3.0 | 2.0 | 1520 | $2,075 | $1.37 | 14d | 1 | 1.22mi |
| 3056 E Siesta Ln Phoenix, AZ | 3.0 | 2.0 | 1476 | $2,375 | $1.61 | 12d | 1 | 1.22mi |
| 2719 E Charleston Ave Phoenix, AZ | 3.0 | 1.5 | 1670 | $1,891 | $1.13 | 21d | 1 | 1.24mi |
Listing history 3 events
-
2026-05-10status Pending
-
2026-04-30historical Under Contract Accepting Backups
-
2026-04-15$185,000 Active
ⓘ Source: listings_history table (triggers on properties + properties_extension) + one-shot
backfill from property_details.listing_events for pre-trigger history.
Climate risk First Street
- Flood 1/10 Low FEMA zone X (shaded) · 0% chance over 30 yrs
- Wildfire 4/10 Moderate
- Heat 8/10 Severe 5 d/yr ≥110°F today · 13 d/yr by 30 yrs out
- Wind 1/10 Low
- Air quality 3/10 Moderate 3 unhealthy d/yr today · 5 by 30 yrs out
Nearby sold comps map
Loading sold comps map…
Walkable amenities ~0.75 mi
Loading nearby amenities…
Taxation est. · year 1
- Rental income
- $30,707
- − Mortgage interest
- −$10,363
- − Property taxes
- −$2,775
- − Insurance
- −$925
- − Repairs & maintenance
- −$2,457
- − Management
- −$2,457
- − Depreciation
- −$5,382
- Taxable income
- $6,349
- Est. tax owed @ 24.0%
- −$1,524
- After-tax cash flow
- $7,393/yr
For passive investors: Depreciation is non-cash, so a rental often shows a tax loss while cash-flowing — sheltering income. Rental losses are passive: they offset passive income freely, and up to $25,000/yr can offset ordinary (W-2) income if you actively participate and your MAGI is under $100k (phasing out to $0 by $150k); unused losses carry forward. On sale, claimed depreciation is recaptured at up to 25%, and gains may owe capital-gains tax (a 1031 exchange can defer both). Figures are a year-1 estimate at your 24.0% rate — not tax advice; consult a CPA.
Condition & rehab AI · 12 photos
This 2015 Champion home is in excellent condition with upgrades throughout, making it move-in ready for both resale and rental.
Value-add opportunities
- Both Paint exterior and interior — Enhances curb appeal and interior aesthetics.
- Both Replace outdoor lighting — Improves safety and enhances curb appeal.
- Both Upgrade kitchen appliances — Modernizes the kitchen and adds value for both resale and rental.
Renovation cost estimate screening
Value-add ROI direction
- Both Paint exterior and interior — Enhances curb appeal and interior aesthetics. ↑
- Both Replace outdoor lighting — Improves safety and enhances curb appeal. ↑
- Both Upgrade kitchen appliances — Modernizes the kitchen and adds value for both resale and rental. ↑
ⓘ Cost ranges are severity-bucket heuristics (US national rule-of-thumb). Get contractor quotes + a written scope before underwriting a rehab budget.
Schools (NCES district)
- District
- Paradise Valley Unified District (4241)
- NCES district ID
- 0405930
- Math proficiency
- 39% ▼ -11.00%
- Reading proficiency
- 46% ▼ -7.00%
- Median HH income
- $64,106
- Composite
- 37.89/100
- National rank
- #4316
- State rank
- #56 of 249 in AZ
Livability — Phoenix
- Score
- 75/100
- State rank
- #16
- US rank
- #3924
Category grades
Schools grade is shown separately in the Schools card above.
Census & demographics
- Census place
- Phoenix, AZ
- County
- Maricopa County · 4,537,380 people
- City population
- 1,500,198
- Metro
- Phoenix-Mesa-Chandler, AZ
- Population (ZIP)
- 26,199
- Household income
- $106,724
- Rent vs Own
- Severe rent burden
- 547.0
Population outlook (Maricopa County) Hauer SSP2
- Today (2025)
- 4,979,203 people
- By 2030
- 5,378,229 · +8.0%
- By 2040
- 6,156,598 · +23.6%
- By 2050
- 6,872,376 · +38.0%
- By 2075
- 8,401,270 · +68.7%
- By 2100
- 9,247,439 · +85.7%
Race, ethnicity, and origin ACS 2023
- Neighborhood character
- Predominantly White (71%)
- Race & ethnicity
- White 71% Hispanic / Latino 16% Two or more races 12% Asian 6% Black 2%
- Hispanic origin (detail)
- Mexican 13% Puerto Rican 1%
- Common ancestry
- Romanian 3% Italian 3% Portuguese 3%
- Foreign-born
- 12% · Canada, China, South Korea
- Languages at home
- 78% English-only · Spanish 10% Other Indo-European 4% Russian/Polish/Slavic 1%
Political lean MEDSL · Maricopa
- 2024 margin
- Toss-up / Even · D 47.7% · R 51.2% · Other 1.1%
- 2008→2024 swing
- +7.1pp toward D · 2008: -10.6pp · 2024: -3.5pp
- All cycles
- 2024: R+3.5 2020: D+2.2 2016: R+3.5 2012: R+12.0 2008: R+10.6
Not yet ingested
- Civics
- —
Market trends
- HPI YoY
- ▼ -82.95%
- Current HPI
- 312.7238
- Rent YoY
- ▲ 1.44%
- Metro
- Phoenix-Mesa-Chandler, AZ
- State GDP YoY
- ▲ 4.54%
- F500 in state
- 20
Industry mix (Fortune 500 HQ in AZ)
| Industry | F500 HQs | Revenue |
|---|---|---|
| Technology | 2 | $13B |
|
||
| Mining / Metals | 1 | $23B |
|
||
| Environmental Services | 1 | $16B |
|
||
| Metals / Steel | 1 | $14B |
|
||
| Technology Distribution | 1 | $9B |
|
||
| Homebuilding | 1 | $8B |
|
||
Price history
3 events — show timeline
- 2026-05-10 Pending — ARMLS
- 2026-04-30 Contingent — ARMLS
- 2026-04-15 Listed $185,000 ARMLS
Cash-flow waterfall
monthlySold comps — $/sqft
last 12 mo · ≤1 miLoading sold comps…