149 Kim Dr #149 · Berkshire Lakes, FL
Flood risk 5/10 · Moderate
- FEMA flood zone
- X (shaded)
- Chance of flooding over 30 yrs
- 0.26%
- Est. flood insurance / yr
- $507 – $1,088
Fire risk 1/10 · Minimal
- Est. fire insurance / yr
- $947 – $1,759
Heat risk 10/10 · Severe
- Hot days now (above 107°F)
- 7 days/yr
- Hot days in 30 yrs
- 28 days/yr
Wind risk 10/10 · Severe
- Chance of severe wind over 30 yrs
- 99.0%
Air-quality risk 2/10 · Minimal
- Unhealthy air days now
- 2 days/yr
- Unhealthy air days in 30 yrs
- 2 days/yr
Risk factors via First Street. Map © Google.
Why this score? — see what drove the D grade
The composite is a weighted blend of 9 inputs, each scored 0–100. Each bar is that input's sub-score; the figure is the points it added to the 100-point composite (weight × sub-score).
- Cash flow +13.3/30.0
- ARV discount +7.5/15.0
- 1% rule +5.0/10.0
- Schools +5.0/10.0
- DSCR +4.0/10.0
- Condition / age +3.8/5.0
- Livability +2.5/5.0
- Rent growth +2.2/5.0
- Appreciation +0.0/10.0
$250,000
🖨 Deal sheet (PDF) 📄 Offer letter ✓ Due diligence
Listing remarks
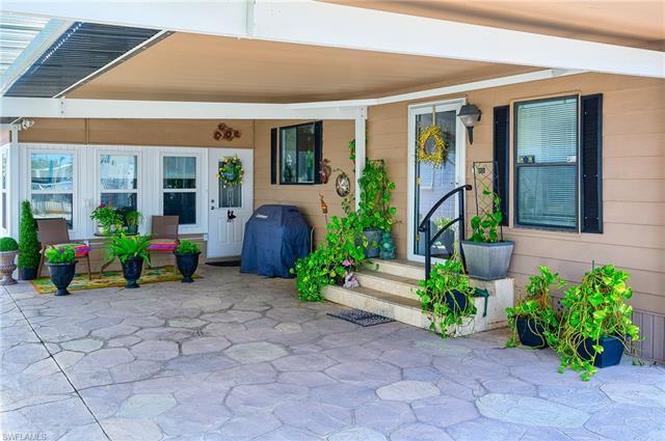
This lovely home has solid tile entry steps and new front door. Walk into living room with luxury vinyl floor which is open to dining room area. Lovely built-ins and chandelier. Walking into your updated kitchen is a Bosch dishwasher (2022), GE Microwave, stove and disposal in 2021.Center island with pull out drawers. A cozy den off kitchen. LG washer/dryer with new exit door. New ceiling fans. Two bedrooms and two baths. Both have walk in closets. Primary has two more closets. Two steps down from den is the family room with all new windows and new entry door. Large glass table with six chairs and a trundle bed couch. New carpeting, too. Storage room entrance at end of room. NO LAND LEASE
Key facts
- Bosch dishwasher
- New front door
- Updated kitchen
Tags
Property features AI
Finance
- Other: Part of a complex with 196 units; this unit is one of 1 unit in building and on a single floor
- HOA & community: Mandatory HOA; Monthly master HOA fee of $250; On-site management; Community amenities include billiards, bocce court, community pool, community room, exercise room, shuffleboard, and tennis court; Maintenance provided: cable, internet/WiFi access, irrigation water, manager, recreation facilities, sewer, street lights, trash removal, water; Total annual recurring fees: $3,000; total one-time fees: $300; Community type: Mobile/Manufactured
Exterior
- Parking: Paved driveway; Attached carport with 2 carport spaces
- Utilities: Central water; Central sewer (assessment paid); Electric service for heat and cooling; Cable available
- Home design: Manufactured residential home; 1-story / ranch; Rear exposure facing east; Located in Blue Skys Mobile Home Park (lot/unit 149)
- Construction: Manufactured construction; Built in 1986; Aluminum siding exterior; Metal roof
- Exterior features: Metal roof; Double-hung and transom windows; Shutters for storm protection; Aluminum siding
Interior
- Kitchen: Cooktop (electric); Range; Self-cleaning oven; Microwave; Dishwasher; Disposal; Refrigerator
- Bedrooms: 2 bedrooms
- Flooring: Vinyl
- Bathrooms: 2 full bathrooms; Master bathroom with shower only
- Heating & cooling: Central electric heat; Central electric cooling; Ceiling fans; Exhaust fan
- Interior features: Built-in cabinets; High-speed internet available; Pantry; Smoke detectors; Walk-in closet; Window coverings; Breakfast bar and formal dining areas; Den (study) and family room; Partially furnished; Laundry in residence; Three ceiling fans
- Laundry & utility: Washer and dryer in unit
Neighborhood map
What this means for you Summary
Snapshot
- This is a 2-bed/2.0-bath manufactured listed at $250k. Condition is rated good.
Deal economics
- At list price, monthly cash flow is $2 ($22/yr) — positive.
- The deal already cash-flows at list — no discount required.
- Meets the 1% rule at list price ($3k rent vs $250k).
- Recommended offer: $220k (12.0% below list) — sets the bar for market timing.
Location & tenants
- Location reads: area grade D — affects rentability + tenant quality, not the cash-flow math above.
- Collier (suburban): math 60% / reading 56% proficiency, ranked #16 of 73 in FL (top 22%) — acceptable for families but not a draw, mixed tenant base, ~2y average lease.
- Zoned schools: Poinciana Elementary School (math 64% / reading 63%, grade B, #564 of 2,144 statewide, top 27%, 507 students, 55% FRL); East Naples Middle School (math 56% / reading 44%, grade C, #254 of 571 statewide, top 45%, 854 students, 63% FRL); Naples High School (math 47% / reading 52%, grade D, #179 of 667 statewide, top 29%, 1,719 students, 39% FRL) — zoned schools at 52% FRL track the district average.
- Market conditions: Rents soft (-1.1%/yr); 438 active listings in the ZIP; 40 comparable units currently listed for rent nearby; rentals at typical pace (median 23d on market — plan ~3-4 weeks tenant-placement turnaround); 3,520 units permitted in Collier County in 2024 (959 in 5+ unit buildings).
- This rent runs 42% of the median local income ($72k/yr) — at the standard rent-burdened threshold; future hikes will face affordability resistance.
Forward outlook
- Local home prices are declining (-3.0%/yr); year-one equity from $2k of loan paydown is wiped out by about $8k of value loss. Plan a longer hold.
- Collier County population projected at +30% by 2050 — long-run rental-demand tailwind backs the buy-and-hold thesis.
Negotiation context
- It's been on market 389 days — a 12% lower offer ($220k) is reasonable based on typical stale-listing flexibility.
Risks & watch-outs
- Climate carrying-cost: moderate flood risk; severe wind risk, 99% chance of damaging wind over 30y; extreme-heat days projected 7→28/yr by 2055 (HVAC capex compounding) — expect insurance premiums to compound above CPI over the hold.
Questions for the listing agent
- It's been on market 389 days. Have you received any prior offers? Is the seller open to a 12% concession, seller financing, or rate buy-down credit?
- What does the HOA fee cover, when was the last increase, and are there any pending special assessments or reserve-fund shortfalls?
- Why hasn't it sold? Are there any deal-killer items the seller is aware of (foundation, flood, title, zoning, code violations)?
- Is there a deadline driving the sale (1031 exchange, divorce, estate, relocation)? That informs how much negotiation room exists.
- The area grade is low — what's the realistic commute time and amenity access for the typical tenant pool here? Any planned neighborhood developments (good or bad) we should know about?
- What's the average days-on-market for RENTAL listings here right now (not sales)? A rising rental-DOM trend means longer vacancies and softer asking-rent achievability than the comps imply.
- What's the recent tenant-quality profile in this submarket — average credit score on applications, eviction rate, late-payment / NSF rate, and stable-employment percentage? A property-management company in the area should have these aggregated.
- How much new for-sale + rental construction is in the pipeline within 1–3 miles? Heavy new supply typically softens prices + rents 12–24 months out; constrained supply supports both.
Investment metrics
- 1% rule
- 1.00% ✓
- Cap rate
- 6.30%
- Cash-on-cash
- 0.03%
- DSCR
- 1.00
- GRM
- 8.3
CMA / ARV
No comps found within radius.
Projected returns pro-forma
-3.0% appreciation · 0.0% rent growth · sell at horizon
- IRR
- -20.1%
- Equity multiple
- 0.32×
- Total profit
- $-47,543
- Equity at exit
- $37,276
- IRR
- -23.1%
- Equity multiple
- 0.02×
- Total profit
- $-68,848
- Equity at exit
- $21,615
Cash invested: $70,000 (down + closing). Projections, not guarantees.
Landlord ↔ Tenant lean methodology
- Overall (STATE)
- 87 Strongly Landlord-Friendly
- State Florida
- 87 Strongly Landlord-Friendly · R+3
- County
- — inherits STATE
- City
- — inherits STATE
ZIP-level market 34104
- Rents YoY
- -1.1%
- Active inventory
- 438
- Price-to-rent
- 8.3×
Monthly cashflow live
- Estimated rent
- $2,506 medium interval (Pro) →
- Mortgage (P&I)
- −$1,311
- Tax est. 1.5%
- −$312 /mo · $3,750/yr
- Insurance
- −$104
- HOA
- −$250
- Vacancy / Maint / Mgmt
- −$526
- Net cashflow
- $2
Break-even live
Sensitivity live
| Price | -10% $175 | -5% $88 | +0% $2 | +5% $-85 | +10% $-171 |
|---|---|---|---|---|---|
| Rent | -10% $-196 | -5% $-97 | +0% $2 | +5% $101 | +10% $200 |
| Rate | -1.0pp $128 | -0.5pp $65 | base $2 | +0.5pp $-63 | +1.0pp $-129 |
UW: 25.0% down · 7.5% · 30yr · 1.5% tax · 5.0% vac · 8.0% maint · 8.0% mgmt
Financing live
Cash to close
- Down payment
- $62,500
- Closing costs
- $7,500
- Reserves months
- —
- Total cash needed
- —
Loan-product check · same deal, 3 products live
Conventional
25% down · 7.5% · 30yr
- Down + closing
- —
- Monthly P&I
- —
- Monthly cashflow
- —
- DSCR
- —
- Eligible?
- —
Personal DTI + credit; lowest rate.
DSCR
20% down · 8.5% · 30yr
- Down + closing
- —
- Monthly P&I
- —
- Monthly cashflow
- —
- DSCR
- —
- Eligible?
- —
No personal income docs; deal must DSCR.
Hard money
10% down · 12.0% · 12mo
- Down + closing
- —
- Monthly P&I
- —
- Monthly cashflow
- —
- DSCR
- —
- Eligible?
- —
Short-term bridge; refi at stabilization.
Rent comps 40 comps
| Address | Beds | Baths | Sqft | Rent | $/sqft | DOM | Units | Dist |
|---|---|---|---|---|---|---|---|---|
| 6726 Sloane Pl Unit 1049716P Naples, FL | 3.0 | 2.0 | 1872 | $5,748 | $3.07 | 15d | 1 | 0.15mi |
| 6643 Craven Hill Way Naples, FL | 3.0 | 2.0 | 1384 | $2,900 | $2.10 | 15d | 1 | 0.26mi |
| 92 Glen Eagle Cir Naples, FL | 3.0 | 2.0 | 1562 | $12,000 | $7.68 | 23d | 1 | 0.42mi |
| 6825 Sterling Greens Dr #102 Naples, FL | 3.0 | 2.0 | 1499 | $4,500 | $3.00 | 25d | 1 | 0.55mi |
| 6871 Sterling Greens Dr #202 Naples, FL | 2.0 | 2.0 | 1727 | $5,500 | $3.18 | 15d | 1 | 0.55mi |
| 6854 Sterling Greens Dr #201 Naples, FL | 3.0 | 2.0 | 1727 | $4,500 | $2.61 | 15d | 1 | 0.56mi |
| 589 Lambton Ln Naples, FL | 3.0 | 2.0 | 1823 | $7,750 | $4.25 | 25d | 1 | 0.57mi |
| 6828 Sterling Greens Dr Unit 4105 Naples, FL | 2.0 | 2.0 | 1242 | $3,750 | $3.02 | 15d | 1 | 0.59mi |
| 6816 Sterling Greens Dr Unit 1306 Naples, FL | 3.0 | 2.0 | 1506 | $2,900 | $1.93 | 15d | 1 | 0.59mi |
| 6816 Sterling Greens Pl #105 Naples, FL | 2.0 | 2.0 | 1243 | $1,895 | $1.52 | 23d | 1 | 0.59mi |
| 6816 Sterling Greens Dr Unit 1105 Naples, FL | 2.0 | 2.0 | 1243 | $1,895 | $1.52 | 15d | 1 | 0.59mi |
| 613 Windsor Sq #101 Naples, FL | 2.0 | 2.0 | 1316 | $3,800 | $2.89 | 25d | 1 | 0.63mi |
| 565 Windsor Sq #201 Naples, FL | 3.0 | 2.0 | 1421 | $3,800 | $2.67 | 23d | 1 | 0.66mi |
| 636 Windsor Sq #102 Naples, FL | 2.0 | 2.0 | 1191 | $3,750 | $3.15 | 25d | 1 | 0.67mi |
| 1466 Vintage Ln Naples, FL | 3.0 | 2.0 | 1905 | $10,500 | $5.51 | 25d | 1 | 0.67mi |
| 800 New Waterford Dr #201 Naples, FL | 2.0 | 2.0 | 1362 | $2,440 | $1.79 | 23d | 1 | 0.68mi |
| 1499 Vintage Ln Naples, FL | 3.0 | 2.0 | 1754 | $9,000 | $5.13 | 25d | 1 | 0.68mi |
| 541 Windsor Sq Unit 9 Naples, FL | 2.0 | 2.0 | 1421 | $2,500 | $1.76 | 15d | 1 | 0.68mi |
| 1507 Vintage Ln Naples, FL | 3.0 | 2.0 | 1874 | $11,000 | $5.87 | 25d | 1 | 0.70mi |
| 697 Crossfield Cir Naples, FL | 3.0 | 2.0 | 1764 | $7,500 | $4.25 | 25d | 1 | 0.70mi |
| 505 Windsor Sq #201 Naples, FL | 3.0 | 2.0 | 1191 | $2,365 | $1.99 | 15d | 1 | 0.73mi |
| 529 Mardel Dr #311 Naples, FL | 2.0 | 2.0 | 1093 | $3,500 | $3.20 | 25d | 1 | 0.75mi |
| 914 Marble Dr Naples, FL | 3.0 | 2.0 | 1715 | $15,000 | $8.75 | 15d | 1 | 0.76mi |
| 431 Dundee Ct Naples, FL | 3.0 | 2.0 | 1906 | $6,500 | $3.41 | 23d | 1 | 0.76mi |
| 431 Dundee Ct Naples, FL | 3.0 | 2.0 | 1906 | $6,500 | $3.41 | 25d | 1 | 0.76mi |
| 1526 Vintage Ln Naples, FL | 3.0 | 2.0 | 1737 | $10,000 | $5.76 | 25d | 1 | 0.77mi |
| 443 Dundee Ct Naples, FL | 3.0 | 2.0 | 1766 | $8,000 | $4.53 | 25d | 1 | 0.77mi |
| 1025 Jardin Dr Naples, FL | 3.0 | 3.0 | 1756 | $5,000 | $2.85 | 15d | 1 | 0.78mi |
| 449 Dundee Ct Naples, FL | 3.0 | 2.0 | 1900 | $6,500 | $3.42 | 25d | 1 | 0.78mi |
| 717 Landover Cir #103 Naples, FL | 2.0 | 2.0 | 1300 | $3,800 | $2.92 | 25d | 1 | 0.80mi |
| 2026 Terrazzo Ln Naples, FL | 3.0 | 2.0 | 1856 | $9,000 | $4.85 | 25d | 1 | 0.80mi |
| 930 Marble Dr Naples, FL | 3.0 | 2.0 | 1850 | $9,000 | $4.86 | 23d | 1 | 0.80mi |
| 915 New Waterford Dr Unit H201 Naples, FL | 2.0 | 2.0 | 1362 | $4,150 | $3.05 | 15d | 1 | 0.80mi |
| 716 Landover Cir #102 Naples, FL | 2.0 | 2.0 | 1300 | $3,200 | $2.46 | 25d | 1 | 0.82mi |
| 7065 Dennis Cir #302 Naples, FL | 2.0 | 2.0 | 1097 | $4,000 | $3.65 | 23d | 1 | 0.82mi |
| 929 Marble Dr Naples, FL | 3.0 | 2.0 | 1803 | $9,000 | $4.99 | 23d | 1 | 0.82mi |
| 1051 Eastham Way Unit B104 Naples, FL | 2.0 | 2.0 | 1091 | $4,300 | $3.94 | 15d | 1 | 0.83mi |
| 661 Squire Cir #101 Naples, FL | 3.0 | 2.0 | 1450 | $2,095 | $1.44 | 15d | 1 | 0.83mi |
| 191 Bennington Dr Unit 12-6 Naples, FL | 2.0 | 2.0 | 1240 | $1,450 | $1.17 | 25d | 1 | 0.84mi |
| 5110 Brixton Ct Naples, FL | 3.0 | 2.0 | 1717 | $9,500 | $5.53 | 23d | 1 | 0.84mi |
HOA detail
- Monthly dues
- $250 · $3,000/yr
Listing history 11 events
-
2026-06-22days on market $250,000 Active 389 DOM
-
2026-06-18days on market $250,000 Active 386 DOM
-
2026-06-17days on market $250,000 Active 385 DOM
-
2026-06-16days on market $250,000 Active 384 DOM
-
2026-06-15days on market $250,000 Active 383 DOM
-
2026-06-10days on market $250,000 Active 378 DOM
-
2026-06-09days on market $250,000 Active 377 DOM
-
2026-06-08days on market $250,000 Active 376 DOM
-
2026-06-07days on market $250,000 Active 375 DOM
-
2026-06-03remarks 699-char remark
-
2026-06-03$250,000 Active 370 DOM
ⓘ Source: listings_history table (triggers on properties + properties_extension) + one-shot
backfill from property_details.listing_events for pre-trigger history.
Climate risk First Street
- Flood 5/10 Major FEMA zone X (shaded) · 26% chance over 30 yrs
- Wildfire 1/10 Low
- Heat 10/10 Extreme 7 d/yr ≥107°F today · 28 d/yr by 30 yrs out
- Wind 10/10 Extreme 99% chance of damaging wind over 30 yrs
- Air quality 2/10 Low 2 unhealthy d/yr today · 2 by 30 yrs out
Nearby sold comps map
Loading sold comps map…
Walkable amenities ~0.75 mi
Loading nearby amenities…
Taxation est. · year 1
- Rental income
- $30,069
- − Mortgage interest
- −$14,004
- − Property taxes
- −$3,750
- − Insurance
- −$1,250
- − Repairs & maintenance
- −$2,406
- − Management
- −$2,406
- − HOA
- −$3,000
- − Depreciation
- −$7,273
- Taxable loss
- −$4,018
- Est. tax savings @ 24.0%
- +$964
- After-tax cash flow
- $987/yr
For passive investors: Depreciation is non-cash, so a rental often shows a tax loss while cash-flowing — sheltering income. Rental losses are passive: they offset passive income freely, and up to $25,000/yr can offset ordinary (W-2) income if you actively participate and your MAGI is under $100k (phasing out to $0 by $150k); unused losses carry forward. On sale, claimed depreciation is recaptured at up to 25%, and gains may owe capital-gains tax (a 1031 exchange can defer both). Figures are a year-1 estimate at your 24.0% rate — not tax advice; consult a CPA.
Condition & rehab AI · 13 photos
This home is in good condition with recent updates and improvements, making it a solid investment opportunity.
Value-add opportunities
- Resale Painting the exterior siding — Fresh paint can significantly improve the curb appeal and resale value of the home.
- Both Upgrading the HVAC system — A new HVAC system can improve comfort and energy efficiency, benefiting both resale and rental value.
Renovation cost estimate screening
Value-add ROI direction
- Resale Painting the exterior siding — Fresh paint can significantly improve the curb appeal and resale value of the home. ↑
- Both Upgrading the HVAC system — A new HVAC system can improve comfort and energy efficiency, benefiting both resale and rental value. ↑
ⓘ Cost ranges are severity-bucket heuristics (US national rule-of-thumb). Get contractor quotes + a written scope before underwriting a rehab budget.
Schools (NCES district)
- District
- Collier
- NCES district ID
- 1200330
- Math proficiency
- 60% ▼ -4.00%
- Reading proficiency
- 56% ▼ -2.00%
- Median HH income
- $58,275
- Composite
- 50.23/100
- National rank
- #1892
- State rank
- #16 of 73 in FL
Livability — Berkshire Lakes
No livability data for this city. (Only ~50 U.S. cities are tracked.)
Census & demographics
- County
- Collier County · 396,295 people
- Metro
- Naples-Marco Island, FL
- Population (ZIP)
- 26,408
- Household income
- $71,686
- Rent vs Own
- Severe rent burden
- 1423.0
Population outlook (Collier County) Hauer SSP2
- Today (2025)
- 420,858 people
- By 2030
- 450,054 · +6.9%
- By 2040
- 502,232 · +19.3%
- By 2050
- 544,932 · +29.5%
- By 2075
- 627,203 · +49.0%
- By 2100
- 659,015 · +56.6%
Race, ethnicity, and origin ACS 2023
- Neighborhood character
- Majority White (62%)
- Race & ethnicity
- White 62% Hispanic / Latino 30% Two or more races 19% Black 4% Asian 2%
- Hispanic origin (detail)
- Mexican 7% Puerto Rican 3% Cuban 6% Dominican 1%
- Common ancestry
- Lithuanian 6% Romanian 3% Hispanic 2%
- Foreign-born
- 30% · Canada, Jamaica, Dominican Republic
- Languages at home
- 66% English-only · Spanish 24% French/Haitian/Cajun 5% Russian/Polish/Slavic 1%
Political lean MEDSL · Collier
- 2024 margin
- Solid R (+33.1) · D 33.1% · R 66.2%
- 2008→2024 swing
- -10.6pp toward R · 2008: -22.5pp · 2024: -33.1pp
- All cycles
- 2024: R+33.1 2020: R+24.7 2016: R+26.0 2012: R+30.1 2008: R+22.5
Not yet ingested
- Civics
- —
Market trends
- HPI YoY
- ▼ -252.48%
- Current HPI
- 259.3498
- Rent YoY
- ▼ -1.10%
- Metro
- Naples-Marco Island, FL
- State GDP YoY
- ▲ 3.28%
- F500 in state
- 36
Industry mix (Fortune 500 HQ in FL)
| Industry | F500 HQs | Revenue |
|---|---|---|
| Industrial Technology | 2 | $29B |
|
||
| Insurance | 2 | $17B |
|
||
| Retail | 1 | $60B |
|
||
| Technology Distribution | 1 | $58B |
|
||
| Homebuilding | 1 | $35B |
|
||
| Technology Manufacturing | 1 | $35B |
|
||
Price history
-3.5% since first listed2 events — show timeline
- 2025-10-04 Price Changed $250,000 NAPLESMLS
- 2025-05-28 Listed $259,000 NAPLESMLS
Cash-flow waterfall
monthlySold comps — $/sqft
last 12 mo · ≤1 miLoading sold comps…