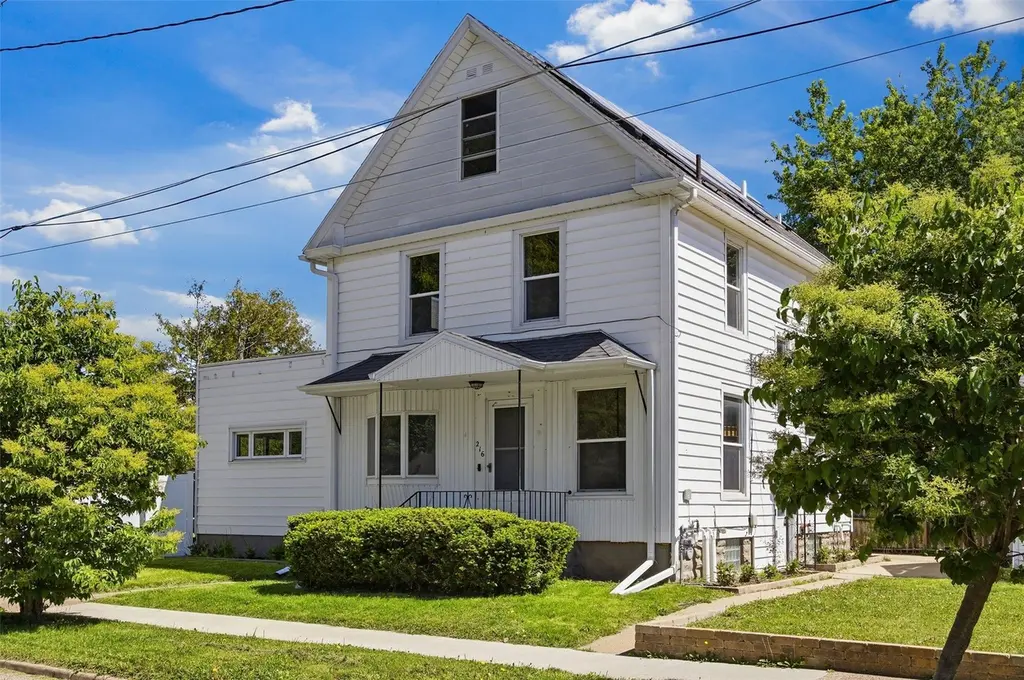
216 17th St NE · Cedar Rapids, IA
Flood risk 1/10 · Minimal
- FEMA flood zone
- X (unshaded)
- Chance of flooding over 30 yrs
- 0.0%
- Est. flood insurance / yr
- $473 – $860
Fire risk 1/10 · Minimal
- Est. fire insurance / yr
- $902 – $1,676
Heat risk 3/10 · Minor
- Hot days now (above 104°F)
- 7 days/yr
- Hot days in 30 yrs
- 15 days/yr
Wind risk 2/10 · Minimal
- Chance of severe wind over 30 yrs
- —
Air-quality risk 2/10 · Minimal
- Unhealthy air days now
- 1 days/yr
- Unhealthy air days in 30 yrs
- 2 days/yr
Risk factors via First Street. Map © Google.
Why this score? — see what drove the D grade
The composite is a weighted blend of 9 inputs, each scored 0–100. Each bar is that input's sub-score; the figure is the points it added to the 100-point composite (weight × sub-score).
- Cash flow +16.7/30.0
- DSCR +5.2/10.0
- Rent growth +5.0/5.0
- Schools +4.7/10.0
- 1% rule +4.2/10.0
- Livability +3.9/5.0
- Condition / age +2.5/5.0
- ARV discount +0.0/15.0
- Appreciation +0.0/10.0
$210,000
🖨 Deal sheet 📄 Offer letter ✓ Due diligence
Listing remarks MLS
Large 2.5+ story home featuring over 2000 square feet, 6 bedrooms, 2 bathrooms, and a 2 car garage! Recent updates include (2011) a new roof on the house and garage, all new flooring and paint, tankless water heat, electrical panel, (2013) central air, and majority of windows replaced. The kitchen has all new hardware, fixtures, counters, and all new appliances. The bathrooms also have all new hardware, fixtures, counters, and tile shower surrounds. The basement is clean and dry with potential to be finished off, and nice laundry area that includes a washer and dryer. Home also has maintenance free siding, a fenced in yard, and additional off street parking. This is a must see in this price range!
Key facts
- Central hvac
- Ethernet wiring
- 6,970 sq ft lot
Tags
Property features AI
Exterior
- Parking: Detached garage; 2-car garage; Off-street parking; Garage door opener
- Utilities: Public water; Public sewer
- Home design: Single-family residence; Two stories; Two levels; Residential property
- Construction: Aluminum siding; Frame construction
- Exterior features: Deck; Patio
Interior
- Kitchen: Dishwasher; Microwave; Range; Refrigerator; Disposal; Gas water heater
- Bathrooms: 2 full bathrooms
- Heating & cooling: Forced air heating; Central air; Window and wall air conditioning units
- Interior features: Full basement
- Laundry & utility: Washer; Dryer
Neighborhood map
What this means for you Summary
Snapshot
- This is a 5-bed/2.0-bath single-family listed at $210k.
Deal economics
- At list price, monthly cash flow is $130 ($2k/yr) — positive.
- The deal already cash-flows at list — no discount required.
- To meet the 1% rule (rent ≥ 1% of price), the offer needs to be $193k (8.1% below list).
- Recommended offer: $193k (8.1% below list) — sets the bar for 1% rule.
- Cap rate 7.0% vs local median 3.5% in Cedar Rapids — top-decile yield for the area; either an underpriced asset or a hidden risk that comps aren't pricing in. Stress-test before assuming the spread holds.
Location & tenants
- Location reads 78/100 on livability (#134 in IA, #2,474 nationally) — a middle-class / working-renter tenant base. Strengths: cost of living A+, housing A+, health & safety A+; Watch: crime C-, commute F.
- Cedar Rapids Community School District (urban): math 50% / reading 59% proficiency, ranked #265 of 289 in IA (top 92%) — acceptable for families but not a draw, mixed tenant base, ~2y average lease.
- Zoned schools: Grant Wood Elementary School (math 47% / reading 52%, grade D, #514 of 616 statewide, top 85%, 361 students, 64% FRL); Franklin Middle School (math 49% / reading 59%, grade B-, #206 of 246 statewide, top 84%, 537 students, 56% FRL); George Washington High School (math 44% / reading 62%, grade C-, #296 of 336 statewide, top 88%, 1,291 students, 49% FRL).
- Market conditions: Rents rising fast (+11.0%/yr); 286 active listings in the ZIP; 1,023 units permitted in Linn County in 2024 (456 in 5+ unit buildings).
- This rent runs 32% of the median local income ($73k/yr) — at the standard rent-burdened threshold; future hikes will face affordability resistance.
Forward outlook
- Local home prices are declining (-3.0%/yr); year-one equity from $1k of loan paydown is wiped out by about $6k of value loss. Plan a longer hold.
- Linn County population projected at +16% by 2050 — long-run rental-demand tailwind backs the buy-and-hold thesis.
- At projected returns (-3.0% appreciation + 8.0% rent growth), your $59k cash investment doubles in ~10 years — after that, you're playing with house money.
Negotiation context
- Only 11 days on market — expect competitive offers; lowballing is unlikely to land.
- 3 sale attempts since 12y ago with the ask held roughly flat each time — persistent listings suggest the price (not the market) is what's stuck; bring a comps-based counter.
- Current owner paid $115k; list at $210k implies a 83% gain — meaningful room to come down on a strong offer.
Risks & watch-outs
- Watch-outs: built in 1902 — expect roof / HVAC / electrical / plumbing capex.
Questions for the listing agent
- Built in 1902 — when were the roof, HVAC, electrical panel, plumbing, and water heater last replaced?
- Is there a deadline driving the sale (1031 exchange, divorce, estate, relocation)? That informs how much negotiation room exists.
- Schools are B-rated — typically a magnet for longer-tenancy family renters. What's the average tenant stay here, and is there a school-zone premium baked into asking?
- The area grade is low — what's the realistic commute time and amenity access for the typical tenant pool here? Any planned neighborhood developments (good or bad) we should know about?
- What's the average days-on-market for RENTAL listings here right now (not sales)? A rising rental-DOM trend means longer vacancies and softer asking-rent achievability than the comps imply.
- What's the recent tenant-quality profile in this submarket — average credit score on applications, eviction rate, late-payment / NSF rate, and stable-employment percentage? A property-management company in the area should have these aggregated.
- How much new for-sale + rental construction is in the pipeline within 1–3 miles? Heavy new supply typically softens prices + rents 12–24 months out; constrained supply supports both.
Investment metrics
- 1% rule
- 0.92% ✗
- Cap rate
- 7.04%
- Cash-on-cash
- 2.65%
- DSCR
- 1.12
- GRM
- 9.1
CMA / ARV
- ARV (median comp)
- $160,707
- List price
- $210,000
- Delta
- 30.67%
- Verdict
- OVERPRICED
- Comps
- 20 within 1.0 mi
Show comp detail 12 sales within ~0.75 mi
| Address | Dist | Beds/Ba | Sqft | Sold | Price | $/sf | Match |
|---|---|---|---|---|---|---|---|
| 1720 2nd Ave Ave SE | 0.20mi | 5/2.0 | 2,340 (-4%) | 2mo | $250,000 | $107 | 83 |
| 1727 B Ave NE | 0.05mi | 5/2.5 | 2,117 (-13%) | 1mo | $225,000 | $106 | 73 |
| 1408 B Ave NE | 0.34mi | 4/2.0 (-1) | 2,491 (+2%) | 11mo | $56,000 | $22 | 66 |
| 1971 B Ave NE | 0.47mi | 5/2.0 | 2,341 (-4%) | 9mo | $153,500 | $66 | 64 |
| 8907 Zeppelin Ave NE | 0.05mi | 4/3.0 (-1) | 2,191 (-10%) | 11mo | $455,529 | $208 | 63 |
| 1112 Elmhurst Dr NE | 0.59mi | 5/1.5 | 2,464 (+1%) | 10mo | $160,000 | $65 | 60 |
| 1838 Blake Blvd SE | 0.40mi | 4/1.5 (-1) | 2,330 (-4%) | 11mo | $150,000 | $64 | 58 |
| 225 Crescent St SE | 0.43mi | 4/2.5 (-1) | 2,688 (+10%) | 4mo | $385,000 | $143 | 53 |
| 1522 6th Ave SE | 0.69mi | 5/2.0 | 2,268 (-7%) | 6mo | $125,000 | $55 | 52 |
| 1920 Blake Blvd Blvd SE | 0.46mi | 4/2.5 (-1) | 2,642 (+8%) | 15mo | $320,000 | $121 | 45 |
| 1554 4th Ave SE | 0.56mi | 6/2.5 (+1) | 2,152 (-12%) | 9mo | $99,000 | $46 | 40 |
| 2020 Grande Ave SE | 0.60mi | 4/2.5 (-1) | 2,155 (-12%) | 7mo | $294,950 | $137 | 40 |
Match score weights: distance 35% · size 25% · config 20% · recency 20%. Top-matched comps best support the ARV.
Projected returns pro-forma
-3.0% appreciation · 8.0% rent growth · sell at horizon
- IRR
- -6.8%
- Equity multiple
- 0.74×
- Total profit
- $-15,551
- Equity at exit
- $31,312
- IRR
- 8.0%
- Equity multiple
- 1.74×
- Total profit
- $43,539
- Equity at exit
- $18,157
Cash invested: $58,800 (down + closing). Projections, not guarantees.
Landlord ↔ Tenant lean methodology
- Overall (STATE)
- 83 Strongly Landlord-Friendly
- State Iowa
- 83 Strongly Landlord-Friendly · R+6
- County
- — inherits STATE
- City
- — inherits STATE
ZIP-level market 52402
- Rents YoY
- 11.0%
- Active inventory
- 286
- Price-to-rent
- 9.1×
Monthly cashflow live
- Estimated rent
- $1,931 medium interval (Pro) →
- Mortgage (P&I)
- −$1,101
- Tax from tax record
- −$206 /mo · $2,478/yr
- Insurance
- −$88
- HOA
- −$0
- Vacancy / Maint / Mgmt
- −$405
- Net cashflow
- $130
Break-even live
UW: 25.0% down · 7.5% · 30yr · 1.5% tax · 5.0% vac · 8.0% maint · 8.0% mgmt
Financing live
Cash to close
- Down payment
- $52,500
- Closing costs
- $6,300
- Reserves months
- —
- Total cash needed
- —
Loan-product check · same deal, 3 products live
Conventional
25% down · 7.5% · 30yr
- Down + closing
- —
- Monthly P&I
- —
- Monthly cashflow
- —
- DSCR
- —
- Eligible?
- —
Personal DTI + credit; lowest rate.
DSCR
20% down · 8.5% · 30yr
- Down + closing
- —
- Monthly P&I
- —
- Monthly cashflow
- —
- DSCR
- —
- Eligible?
- —
No personal income docs; deal must DSCR.
Hard money
10% down · 12.0% · 12mo
- Down + closing
- —
- Monthly P&I
- —
- Monthly cashflow
- —
- DSCR
- —
- Eligible?
- —
Short-term bridge; refi at stabilization.
Listing history 9 events
-
2026-06-07statusdays on market $210,000 Pending 11 DOM
-
2026-06-05days on market $210,000 Active 10 DOM
-
2026-06-03days on market $210,000 Active 9 DOM
-
2026-06-02days on market $210,000 Active 8 DOM
-
2026-06-01days on market $210,000 Active 7 DOM
-
2026-06-01status $210,000 Active 6 DOM
-
2026-05-13$210,000 Active 1644-char remark
-
2014-05-06soldstatus $115,000 707-char remark
Show marketing remark (707 chars)
Large 2.5+ story home featuring over 2000 square feet, 6 bedrooms, 2 bathrooms, and a 2 car garage! Recent updates include (2011) a new roof on the house and garage, all new flooring and paint, tankless water heat, electrical panel, (2013) central air, and majority of windows replaced. The kitchen has all new hardware, fixtures, counters, and all new appliances. The bathrooms also have all new hardware, fixtures, counters, and tile shower surrounds. The basement is clean and dry with potential to be finished off, and nice laundry area that includes a washer and dryer. Home also has maintenance free siding, a fenced in yard, and additional off street parking. This is a must see in this price range!
-
2014-02-17$119,900 707-char remark
Show marketing remark (707 chars)
Large 2.5+ story home featuring over 2000 square feet, 6 bedrooms, 2 bathrooms, and a 2 car garage! Recent updates include (2011) a new roof on the house and garage, all new flooring and paint, tankless water heat, electrical panel, (2013) central air, and majority of windows replaced. The kitchen has all new hardware, fixtures, counters, and all new appliances. The bathrooms also have all new hardware, fixtures, counters, and tile shower surrounds. The basement is clean and dry with potential to be finished off, and nice laundry area that includes a washer and dryer. Home also has maintenance free siding, a fenced in yard, and additional off street parking. This is a must see in this price range!
ⓘ Source: listings_history table (triggers on properties + properties_extension) + one-shot
backfill from property_details.listing_events for pre-trigger history.
Tax reassessment forecast IA · Partial reset (capped growth)
- Current annual tax
- $2,478 · $206/mo
- Projected year-2 tax
- $2,888 · $241/mo
- Expected delta
- +$410/yr (+$34/mo · 16.5%)
ⓘ Screening estimate from a state-policy table — verify with the county assessor before closing.
Climate risk First Street
- Flood 1/10 Low FEMA zone X (unshaded) · 0% chance over 30 yrs
- Wildfire 1/10 Low
- Heat 3/10 Moderate 7 d/yr ≥104°F today · 15 d/yr by 30 yrs out
- Wind 2/10 Low
- Air quality 2/10 Low 1 unhealthy d/yr today · 2 by 30 yrs out
Nearby sold comps map
Loading sold comps map…
Walkable amenities ~0.75 mi
Loading nearby amenities…
Taxation est. · year 1
- Rental income
- $23,169
- − Mortgage interest
- −$11,763
- − Property taxes
- −$2,478
- − Insurance
- −$1,050
- − Repairs & maintenance
- −$1,853
- − Management
- −$1,853
- − Depreciation
- −$6,109
- Taxable loss
- −$1,939
- Est. tax savings @ 24.0%
- +$465
- After-tax cash flow
- $2,025/yr
For passive investors: Depreciation is non-cash, so a rental often shows a tax loss while cash-flowing — sheltering income. Rental losses are passive: they offset passive income freely, and up to $25,000/yr can offset ordinary (W-2) income if you actively participate and your MAGI is under $100k (phasing out to $0 by $150k); unused losses carry forward. On sale, claimed depreciation is recaptured at up to 25%, and gains may owe capital-gains tax (a 1031 exchange can defer both). Figures are a year-1 estimate at your 24.0% rate — not tax advice; consult a CPA.
Schools (NCES district)
- District
- Cedar Rapids Community School District
- NCES district ID
- 1906540
- Math proficiency
- 50% ▼ -12.00%
- Reading proficiency
- 59% ▼ -6.00%
- Median HH income
- $53,568
- Composite
- 46.82/100
- National rank
- #2378
- State rank
- #265 of 289 in IA
Livability — Cedar Rapids
- Score
- 78/100
- State rank
- #134
- US rank
- #2474
Category grades
Schools grade is shown separately in the Schools card above.
Census & demographics
- Census place
- Cedar Rapids, IA
- County
- Linn County · 179,860 people
- City population
- 137,154
- Metro
- Cedar Rapids, IA
- Population (ZIP)
- 42,938
- Household income
- $73,439
- Rent vs Own
- Severe rent burden
- 971.0
Population outlook (Linn County) Hauer SSP2
- Today (2025)
- 239,589 people
- By 2030
- 248,587 · +3.8%
- By 2040
- 264,817 · +10.5%
- By 2050
- 278,685 · +16.3%
- By 2075
- 311,754 · +30.1%
- By 2100
- 336,773 · +40.6%
Race, ethnicity, and origin ACS 2023
- Neighborhood character
- Predominantly White (77%)
- Race & ethnicity
- White 77% Two or more races 7% Black 6% Asian 6% Hispanic / Latino 4%
- Common ancestry
- Portuguese 4% Lithuanian 2% Iranian 2%
- Foreign-born
- 8% · Canada, Philippines, China
- Languages at home
- 89% English-only · Spanish 3% Other Indo-European 3% Other Asian/Pacific 2%
Political lean MEDSL · Linn
- 2024 margin
- Lean D (+9.9) · D 54.2% · R 44.3% · Other 1.4%
- 2008→2024 swing
- -11.6pp toward R · 2008: 21.5pp · 2024: 9.9pp
- All cycles
- 2024: D+9.9 2020: D+13.7 2016: D+9.0 2012: D+17.6 2008: D+21.5
Not yet ingested
- Civics
- —
Market trends
- HPI YoY
- ▼ -133.31%
- Current HPI
- 201.7061
- Rent YoY
- ▲ 10.97%
- Metro
- Cedar Rapids, IA
- State GDP YoY
- ▲ 2.48%
- F500 in state
- 4
Industry mix (Fortune 500 HQ in IA)
| Industry | F500 HQs | Revenue |
|---|---|---|
| Financial Services | 1 | $16B |
|
||
| Retail / Convenience | 1 | $15B |
|
||
Price history
+75.1% since first listed6 events — show timeline
- 2026-06-05 Pending — CRAAR, CDRMLS
- 2026-05-31 Relisted — CRAAR, CDRMLS
- 2026-05-20 Pending — CRAAR, CDRMLS
- 2026-05-13 Listed $210,000 CRAAR, CDRMLS
- 2014-05-06 Sold (MLS) $115,000 CRAAR, CDRMLS
- 2014-02-17 Listed $119,900 CRAAR, CDRMLS
Property tax history
+1.4%/yrLatest (2025): $2,478 · +13.6% YoY. Source: county tax records.
Cash-flow waterfall
monthlySold comps — $/sqft
last 12 mo · ≤1 miLoading sold comps…