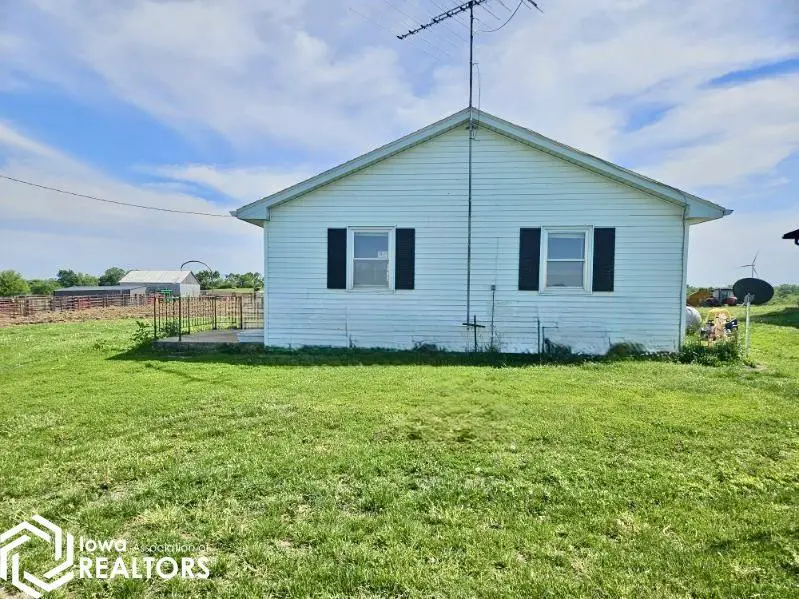
1762 270th St · Bedford, IA
Flood risk 1/10 · Minimal
- FEMA flood zone
- X (unshaded)
- Chance of flooding over 30 yrs
- 0.0%
- Est. flood insurance / yr
- $473 – $860
Fire risk 3/10 · Minor
- Est. fire insurance / yr
- $902 – $1,676
Heat risk 3/10 · Minor
- Hot days now (above 105°F)
- 7 days/yr
- Hot days in 30 yrs
- 15 days/yr
Wind risk 2/10 · Minimal
- Chance of severe wind over 30 yrs
- —
Air-quality risk 1/10 · Minimal
- Unhealthy air days now
- 0 days/yr
- Unhealthy air days in 30 yrs
- 0 days/yr
Risk factors via First Street. Map © Google.
Why this score? — see what drove the A- grade
The composite is a weighted blend of 9 inputs, each scored 0–100. Each bar is that input's sub-score; the figure is the points it added to the 100-point composite (weight × sub-score).
- Cash flow +30.0/30.0
- 1% rule +10.0/10.0
- DSCR +10.0/10.0
- Appreciation +10.0/10.0
- ARV discount +7.5/15.0
- Schools +7.0/10.0
- Livability +4.1/5.0
- Rent growth +2.5/5.0
- Condition / age +2.2/5.0
$25,995
🖨 Deal sheet 📄 Offer letter ✓ Due diligence
Listing remarks
This HOME is be MOVED by BUYER. NO land is included. Buyer Pays all expenses to move to new site. Cash sale only to Seller before it can be MOVED by BUYER.
Key facts
- Built 1972
- Listed 16 days
Property features AI
Exterior
- Parking: No parking
- Utilities: No water source; No sewer
- Home design: Single-family residential; Residential property
- Construction: Wood siding
- Exterior features: House is to be moved by buyer; no land is included
Interior
- Bathrooms: 1 full bathroom
- Heating & cooling: No heating; No cooling
- Interior features: One full bathroom
Neighborhood map
What this means for you Summary
Snapshot
- This is a 2-bed/1.0-bath single-family listed at $26k. Condition is rated fair.
Deal economics
- At list price, monthly cash flow is $525 ($6k/yr) — positive.
- The deal already cash-flows at list — no discount required.
- Meets the 1% rule at list price ($892 rent vs $26k).
- Recommended offer: $26k (1.5% below list) — sets the bar for market timing.
Location & tenants
- Location reads 82/100 on livability (#50 in IA, #1,245 nationally) — a professional / high-income tenant draw. Strengths: schools A+, crime A+, cost of living A+; Watch: amenities F, commute F.
- Bedford Community School District (rural): math 81% / reading 85% proficiency, ranked #23 of 289 in IA (top 8%) — strong family-tenant draw, lease renewals of 3-5y typical.
- Market conditions: 33 active listings in the ZIP; 4 units permitted in Taylor County in 2024 (0 in 5+ unit buildings).
Forward outlook
- In year one you build about $3k of equity ($179 loan paydown + $3k appreciation (10.0% local appreciation)).
- At projected returns (10.0% appreciation + 3.0% rent growth), your $7k cash investment doubles in ~1 year — after that, you're playing with house money.
- By year 10, paydown + projected appreciation supports a ~$34k cash-out refi (75% LTV) — recoverable capital for the next deal without selling this one.
Negotiation context
- It's been on market 17 days — a 2% lower offer ($26k) is reasonable based on typical stale-listing flexibility.
Questions for the listing agent
- Have any recent inspections been done? Can we get a copy of the seller's disclosures and any deferred-maintenance estimates?
- Built in 1972 — when were the roof, HVAC, electrical panel, plumbing, and water heater last replaced?
- Is there a deadline driving the sale (1031 exchange, divorce, estate, relocation)? That informs how much negotiation room exists.
- Schools are A-rated — typically a magnet for longer-tenancy family renters. What's the average tenant stay here, and is there a school-zone premium baked into asking?
- What's the average days-on-market for RENTAL listings here right now (not sales)? A rising rental-DOM trend means longer vacancies and softer asking-rent achievability than the comps imply.
- What's the recent tenant-quality profile in this submarket — average credit score on applications, eviction rate, late-payment / NSF rate, and stable-employment percentage? A property-management company in the area should have these aggregated.
- How much new for-sale + rental construction is in the pipeline within 1–3 miles? Heavy new supply typically softens prices + rents 12–24 months out; constrained supply supports both.
Investment metrics
- 1% rule
- 3.43% ✓
- Cap rate
- 30.52%
- Cash-on-cash
- 86.51%
- DSCR
- 4.85
- GRM
- 2.4
CMA / ARV
No comps found within radius.
Projected returns pro-forma
10.0% appreciation · 3.0% rent growth · sell at horizon
- IRR
- 95.9%
- Equity multiple
- 7.54×
- Total profit
- $47,592
- Equity at exit
- $23,418
- IRR
- 91.0%
- Equity multiple
- 16.65×
- Total profit
- $113,896
- Equity at exit
- $50,503
Cash invested: $7,279 (down + closing). Projections, not guarantees.
Landlord ↔ Tenant lean methodology
- Overall (STATE)
- 83 Strongly Landlord-Friendly
- State Iowa
- 83 Strongly Landlord-Friendly · R+6
- County
- — inherits STATE
- City
- — inherits STATE
ZIP-level market 50833
- Home prices YoY
- 12.5%
- Active inventory
- 33
- Price-to-rent
- 2.4×
Monthly cashflow live
- Estimated rent
- $892 medium interval (Pro) →
- Mortgage (P&I)
- −$136
- Tax est. 1.5%
- −$32 /mo · $390/yr
- Insurance
- −$11
- HOA
- −$0
- Vacancy / Maint / Mgmt
- −$187
- Net cashflow
- $525
Break-even live
UW: 25.0% down · 7.5% · 30yr · 1.5% tax · 5.0% vac · 8.0% maint · 8.0% mgmt
Financing live
Cash to close
- Down payment
- $6,499
- Closing costs
- $780
- Reserves months
- —
- Total cash needed
- —
Loan-product check · same deal, 3 products live
Conventional
25% down · 7.5% · 30yr
- Down + closing
- —
- Monthly P&I
- —
- Monthly cashflow
- —
- DSCR
- —
- Eligible?
- —
Personal DTI + credit; lowest rate.
DSCR
20% down · 8.5% · 30yr
- Down + closing
- —
- Monthly P&I
- —
- Monthly cashflow
- —
- DSCR
- —
- Eligible?
- —
No personal income docs; deal must DSCR.
Hard money
10% down · 12.0% · 12mo
- Down + closing
- —
- Monthly P&I
- —
- Monthly cashflow
- —
- DSCR
- —
- Eligible?
- —
Short-term bridge; refi at stabilization.
Listing history 13 events
-
2026-06-18days on market $25,995 Active 17 DOM
-
2026-06-17days on market $25,995 Active 16 DOM
-
2026-06-16days on market $25,995 Active 15 DOM
-
2026-06-15days on market $25,995 Active 14 DOM
-
2026-06-13days on market $25,995 Active 12 DOM
-
2026-06-12days on market $25,995 Active 11 DOM
-
2026-06-09days on market $25,995 Active 8 DOM
-
2026-06-08days on market $25,995 Active 7 DOM
-
2026-06-07days on market $25,995 Active 6 DOM
-
2026-06-05days on market $25,995 Active 4 DOM
-
2026-06-04days on market $25,995 Active 2 DOM
-
2026-06-02remarks 155-char remark
-
2026-06-02$25,995 Active 1 DOM
ⓘ Source: listings_history table (triggers on properties + properties_extension) + one-shot
backfill from property_details.listing_events for pre-trigger history.
Climate risk First Street
- Flood 1/10 Low FEMA zone X (unshaded) · 0% chance over 30 yrs
- Wildfire 3/10 Moderate
- Heat 3/10 Moderate 7 d/yr ≥105°F today · 15 d/yr by 30 yrs out
- Wind 2/10 Low
- Air quality 1/10 Low 0 unhealthy d/yr today · 0 by 30 yrs out
Nearby sold comps map
Loading sold comps map…
Walkable amenities ~0.75 mi
Loading nearby amenities…
Taxation est. · year 1
- Rental income
- $10,700
- − Mortgage interest
- −$1,456
- − Property taxes
- −$390
- − Insurance
- −$130
- − Repairs & maintenance
- −$856
- − Management
- −$856
- − Depreciation
- −$756
- Taxable income
- $6,255
- Est. tax owed @ 24.0%
- −$1,501
- After-tax cash flow
- $4,796/yr
For passive investors: Depreciation is non-cash, so a rental often shows a tax loss while cash-flowing — sheltering income. Rental losses are passive: they offset passive income freely, and up to $25,000/yr can offset ordinary (W-2) income if you actively participate and your MAGI is under $100k (phasing out to $0 by $150k); unused losses carry forward. On sale, claimed depreciation is recaptured at up to 25%, and gains may owe capital-gains tax (a 1031 exchange can defer both). Figures are a year-1 estimate at your 24.0% rate — not tax advice; consult a CPA.
Condition & rehab AI · 10 photos
This home requires moderate renovations to improve its condition and increase its value. The kitchen and bathroom need significant updates, including new cabinets, flooring, and paint. The exterior siding and landscaping also need attention.
Repairs flagged
- Major kitchen cabinets — Severe wear and tear
- Major bathroom cabinets — Severe wear and tear
- Major kitchen flooring — Severe wear and tear
- Major bathroom flooring — Severe wear and tear
- Major interior walls — Severe wear and tear
Value-add opportunities
- Resale Paint interior walls — Fresh paint can make a significant difference in the home's appearance
- Resale Replace kitchen cabinets — New cabinets can greatly improve the kitchen's functionality and aesthetics
- Resale Replace bathroom cabinets — New cabinets can greatly improve the bathroom's functionality and aesthetics
- Resale Replace kitchen flooring — New flooring can greatly improve the kitchen's functionality and aesthetics
- Resale Replace bathroom flooring — New flooring can greatly improve the bathroom's functionality and aesthetics
Renovation cost estimate screening
| Repair item | Severity | Est. cost |
|---|---|---|
| kitchen cabinets · Severe wear and tear | Major | $15,000–50,000 |
| bathroom cabinets · Severe wear and tear | Major | $15,000–50,000 |
| kitchen flooring · Severe wear and tear | Major | $15,000–50,000 |
| bathroom flooring · Severe wear and tear | Major | $15,000–50,000 |
| interior walls · Severe wear and tear | Major | $15,000–50,000 |
| Total estimated repair cost · 5 items | $75,000–250,000 |
Value-add ROI direction
- Resale Paint interior walls — Fresh paint can make a significant difference in the home's appearance ↑
- Resale Replace kitchen cabinets — New cabinets can greatly improve the kitchen's functionality and aesthetics ↑
- Resale Replace bathroom cabinets — New cabinets can greatly improve the bathroom's functionality and aesthetics ↑
- Resale Replace kitchen flooring — New flooring can greatly improve the kitchen's functionality and aesthetics ↑
- Resale Replace bathroom flooring — New flooring can greatly improve the bathroom's functionality and aesthetics ↑
ⓘ Cost ranges are severity-bucket heuristics (US national rule-of-thumb). Get contractor quotes + a written scope before underwriting a rehab budget.
Schools (NCES district)
- District
- Bedford Community School District
- NCES district ID
- 1904560
- Math proficiency
- 81% ▬ 0.00%
- Reading proficiency
- 85% ▲ 3.00%
- Median HH income
- $43,547
- Composite
- 69.52/100
- National rank
- #305
- State rank
- #23 of 289 in IA
Livability — Bedford
- Score
- 82/100
- State rank
- #50
- US rank
- #1245
Category grades
Schools grade is shown separately in the Schools card above.
Census & demographics
- Population (ZIP)
- 2,085
Population outlook (Taylor County) Hauer SSP2
- Today (2025)
- 6,143 people
- By 2030
- 6,100 · -0.7%
- By 2040
- 6,080 · -1.0%
- By 2050
- 6,146 · +0.0%
- By 2075
- 6,596 · +7.4%
- By 2100
- 6,954 · +13.2%
Race, ethnicity, and origin ACS 2023
- Neighborhood character
- Predominantly White (95%)
- Race & ethnicity
- White 95% Hispanic / Latino 2% Two or more races 2%
- Common ancestry
- Slovak 2% Iranian 1% Italian 1%
- Foreign-born
- 1% · Canada
- Languages at home
- 99% English-only · Spanish 1%
Political lean MEDSL · Taylor
- 2024 margin
- Solid R (+55.7) · D 21.6% · R 77.4% · Other 1.0%
- 2008→2024 swing
- -47.1pp toward R · 2008: -8.6pp · 2024: -55.7pp
- All cycles
- 2024: R+55.7 2020: R+52.9 2016: R+45.1 2012: R+14.1 2008: R+8.6
Not yet ingested
- Civics
- —
Market trends
- HPI YoY
- ▲ 15.13%
- Current HPI
- 136.32
- Rent YoY
- —
- Metro
- —
- State GDP YoY
- ▲ 2.48%
- F500 in state
- 4
Industry mix (Fortune 500 HQ in IA)
| Industry | F500 HQs | Revenue |
|---|---|---|
| Financial Services | 1 | $16B |
|
||
| Retail / Convenience | 1 | $15B |
|
||
Price history
1 event — show timeline
- 2026-05-31 Listed $25,995 IAR
Cash-flow waterfall
monthlySold comps — $/sqft
last 12 mo · ≤1 miLoading sold comps…