1659 Lyman Rd · Chinquapin, NC
Flood risk 1/10 · Minimal
- FEMA flood zone
- X (unshaded)
- Chance of flooding over 30 yrs
- 0.0%
- Est. flood insurance / yr
- $507 – $1,088
Fire risk 4/10 · Minor
- Est. fire insurance / yr
- $906 – $1,684
Heat risk 8/10 · Major
- Hot days now (above 105°F)
- 7 days/yr
- Hot days in 30 yrs
- 18 days/yr
Wind risk 8/10 · Major
- Chance of severe wind over 30 yrs
- 80.0%
Air-quality risk 2/10 · Minimal
- Unhealthy air days now
- 1 days/yr
- Unhealthy air days in 30 yrs
- 2 days/yr
Risk factors via First Street. Map © Google.
Why this score? — see what drove the B+ grade
The composite is a weighted blend of 9 inputs, each scored 0–100. Each bar is that input's sub-score; the figure is the points it added to the 100-point composite (weight × sub-score).
- Cash flow +30.0/30.0
- 1% rule +10.0/10.0
- DSCR +10.0/10.0
- Appreciation +8.2/10.0
- ARV discount +7.5/15.0
- Rent growth +2.5/5.0
- Livability +2.5/5.0
- Condition / age +2.5/5.0
- Schools +2.3/10.0
$49,000
🖨 Deal sheet (PDF) 📄 Offer letter ✓ Due diligence
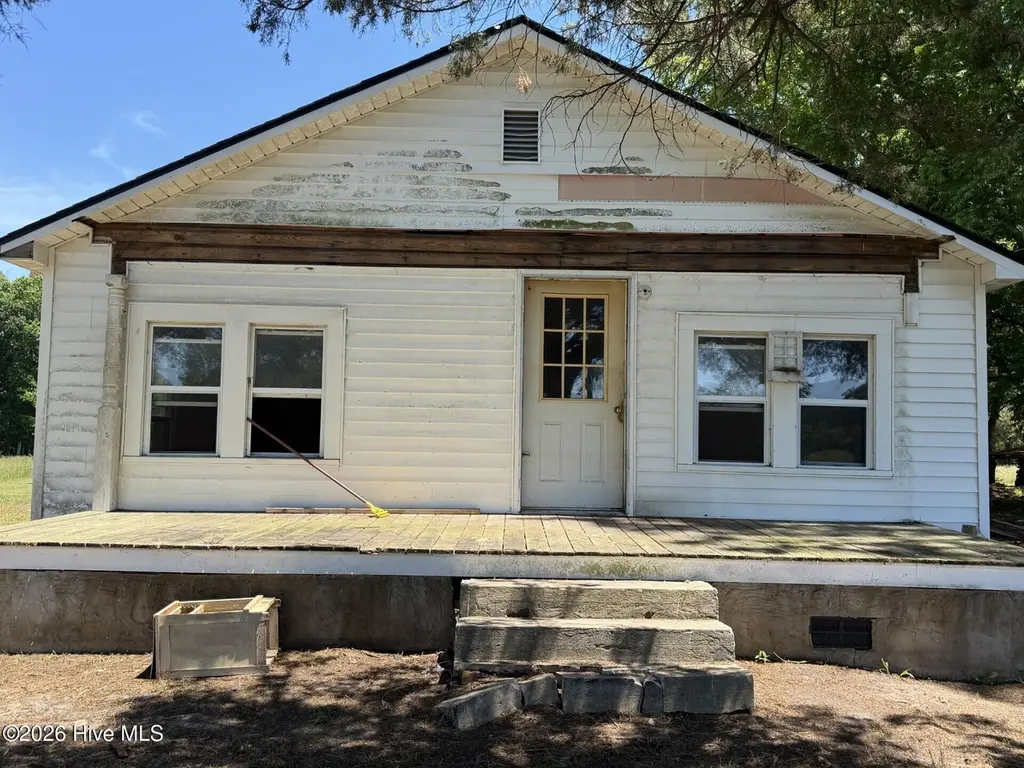
Listing remarks
Calling all investors!!! This property is full of potential and ready for your vision. Situated on approximately a half-acre lot in Chinquapin, NC. Featuring 2 bedrooms and 1 bathroom, the home has a functional layout with city water, septic system, and a roof installed in 2026. Property is being sold AS-IS and will require repairs and updates, making it an excellent opportunity for a fix-and-flip, rental investment, or renovation project. No HOA. Convenient location just 15 minutes from Wallace and approximately 30 minutes to Jacksonville.
Key facts
- Half-acre lot
- City water
- Convenient location
Tags
Property features AI
Exterior
- Parking: Unpaved parking
- Utilities: Water available; Septic tank
- Home design: Single-family residence; One-story entry (ground level); One level total
- Construction: Vinyl siding and frame construction; Shingle roof
- Exterior features: Front porch; Rear porch; Paved road access
Interior
- Bathrooms: 1 full bathroom
- Heating & cooling: No heating; No cooling
- Interior features: Crawl space basement; Total of 5 rooms; Has a view
Neighborhood map
What this means for you Summary
Snapshot
- This is a 2-bed/1.0-bath single-family listed at $49k.
Deal economics
- At list price, monthly cash flow is $768 ($9k/yr) — positive.
- The deal already cash-flows at list — no discount required.
- Meets the 1% rule at list price ($1k rent vs $49k).
- Recommended offer: $48k (1.5% below list) — sets the bar for market timing.
Location & tenants
- Location reads: area grade B — affects rentability + tenant quality, not the cash-flow math above.
- Duplin County Schools (rural): math 23% / reading 32% proficiency, ranked #153 of 178 in NC (top 86%) — low school quality limits family demand, transient renter base, plan for 1-2y turnover; 74% free/reduced lunch — lower-income household profile, screen leases tightly.
- Zoned schools: Chinquapin Elementary (math 32% / reading 47%, grade F, #694 of 1,410 statewide, top 53%, 532 students, 99% FRL); East Duplin High (math 47% / reading 47%, grade D-, #334 of 535 statewide, top 64%, 861 students, 100% FRL) — zoned schools average 99% FRL vs 74% district-wide (25 pts higher); higher-poverty schools than district average — tighter screening recommended.
- Zoned-school proficiency averages 43% at this address vs 28% district-wide (+16 pts) — the actual schools serving this property are materially stronger than the Duplin County Schools average implies; a family-tenant draw the district grade alone would hide.
- Market conditions: 10 active listings in the ZIP; 134 units permitted in Duplin County in 2024 (0 in 5+ unit buildings).
Forward outlook
- In year one you build about $3k of equity ($339 loan paydown + $3k appreciation (6.3% local appreciation)).
- Duplin County population projected at -16% by 2050 — secular population decline; favor cash flow + early exit over multi-decade hold.
- At projected returns (6.3% appreciation + 3.0% rent growth), your $14k cash investment doubles in ~2 years — after that, you're playing with house money.
- By year 9, paydown + projected appreciation supports a ~$31k cash-out refi (75% LTV) — recoverable capital for the next deal without selling this one.
Negotiation context
- It's been on market 23 days — a 2% lower offer ($48k) is reasonable based on typical stale-listing flexibility.
- Current owner paid $12k; list at $49k implies a 308% gain — meaningful room to come down on a strong offer.
Risks & watch-outs
- Watch-outs: built in 1940 — expect roof / HVAC / electrical / plumbing capex.
- Climate carrying-cost: severe wind risk, 80% chance of damaging wind over 30y; extreme-heat days projected 7→18/yr by 2055 (HVAC capex compounding) — expect insurance premiums to compound above CPI over the hold.
Questions for the listing agent
- Built in 1940 — when were the roof, HVAC, electrical panel, plumbing, and water heater last replaced?
- Is there a deadline driving the sale (1031 exchange, divorce, estate, relocation)? That informs how much negotiation room exists.
- What's the average days-on-market for RENTAL listings here right now (not sales)? A rising rental-DOM trend means longer vacancies and softer asking-rent achievability than the comps imply.
- What's the recent tenant-quality profile in this submarket — average credit score on applications, eviction rate, late-payment / NSF rate, and stable-employment percentage? A property-management company in the area should have these aggregated.
- How much new for-sale + rental construction is in the pipeline within 1–3 miles? Heavy new supply typically softens prices + rents 12–24 months out; constrained supply supports both.
Investment metrics
- 1% rule
- 2.77% ✓
- Cap rate
- 25.11%
- Cash-on-cash
- 67.19%
- DSCR
- 3.99
- GRM
- 3.0
CMA / ARV
No comps found within radius.
Projected returns pro-forma
6.33% appreciation · 3.0% rent growth · sell at horizon
- IRR
- 75.0%
- Equity multiple
- 5.67×
- Total profit
- $64,054
- Equity at exit
- $31,842
- IRR
- 71.9%
- Equity multiple
- 11.92×
- Total profit
- $149,860
- Equity at exit
- $58,663
Cash invested: $13,720 (down + closing). Projections, not guarantees.
Landlord ↔ Tenant lean methodology
- Overall (STATE)
- 85 Strongly Landlord-Friendly
- State North Carolina
- 85 Strongly Landlord-Friendly · R+3
- County
- — inherits STATE
- City
- — inherits STATE
ZIP-level market 28521
- Home prices YoY
- 2.1%
- Active inventory
- 10
- Price-to-rent
- 3.0×
Monthly cashflow live
- Estimated rent
- $1,359 medium interval (Pro) →
- Mortgage (P&I)
- −$257
- Tax from tax record
- −$28 /mo · $333/yr
- Insurance
- −$20
- HOA
- −$0
- Vacancy / Maint / Mgmt
- −$285
- Net cashflow
- $768
Break-even live
Sensitivity live
| Price | -10% $796 | -5% $782 | +0% $768 | +5% $754 | +10% $741 |
|---|---|---|---|---|---|
| Rent | -10% $661 | -5% $715 | +0% $768 | +5% $822 | +10% $876 |
| Rate | -1.0pp $793 | -0.5pp $781 | base $768 | +0.5pp $756 | +1.0pp $743 |
UW: 25.0% down · 7.5% · 30yr · 1.5% tax · 5.0% vac · 8.0% maint · 8.0% mgmt
Financing live
Cash to close
- Down payment
- $12,250
- Closing costs
- $1,470
- Reserves months
- —
- Total cash needed
- —
Loan-product check · same deal, 3 products live
Conventional
25% down · 7.5% · 30yr
- Down + closing
- —
- Monthly P&I
- —
- Monthly cashflow
- —
- DSCR
- —
- Eligible?
- —
Personal DTI + credit; lowest rate.
DSCR
20% down · 8.5% · 30yr
- Down + closing
- —
- Monthly P&I
- —
- Monthly cashflow
- —
- DSCR
- —
- Eligible?
- —
No personal income docs; deal must DSCR.
Hard money
10% down · 12.0% · 12mo
- Down + closing
- —
- Monthly P&I
- —
- Monthly cashflow
- —
- DSCR
- —
- Eligible?
- —
Short-term bridge; refi at stabilization.
Listing history 20 events
-
2026-06-21days on market $49,000 Active 23 DOM
-
2026-06-19days on market $49,000 Active 21 DOM
-
2026-06-18days on market $49,000 Active 20 DOM
-
2026-06-17days on market $49,000 Active 19 DOM
-
2026-06-16days on market $49,000 Active 18 DOM
-
2026-06-15days on market $49,000 Active 17 DOM
-
2026-06-14days on market $49,000 Active 15 DOM
-
2026-06-13days on market $49,000 Active 14 DOM
-
2026-06-10days on market $49,000 Active 12 DOM
-
2026-06-09days on market $49,000 Active 11 DOM
-
2026-06-09price $49,000 Active 10 DOM
-
2026-06-08days on market $55,000 Active 10 DOM
-
2026-06-07days on market $55,000 Active 9 DOM
-
2026-06-05days on market $55,000 Active 6 DOM
-
2026-06-03days on market $55,000 Active 5 DOM
-
2026-06-02days on market $55,000 Active 4 DOM
-
2026-06-01pricedays on market $55,000 Active 3 DOM
-
2026-05-31days on market $65,000 Active 2 DOM
-
2026-05-30remarks 546-char remark
-
2026-05-30$65,000 Active 1 DOM
ⓘ Source: listings_history table (triggers on properties + properties_extension) + one-shot
backfill from property_details.listing_events for pre-trigger history.
Tax reassessment forecast NC · Resets to sale price
- Current annual tax
- $333 · $28/mo
- Projected year-2 tax
- $402 · $33/mo
- Expected delta
- +$69/yr (+$6/mo · 20.7%)
ⓘ Screening estimate from a state-policy table — verify with the county assessor before closing.
Climate risk First Street
- Flood 1/10 Low FEMA zone X (unshaded) · 0% chance over 30 yrs
- Wildfire 4/10 Moderate
- Heat 8/10 Severe 7 d/yr ≥105°F today · 18 d/yr by 30 yrs out
- Wind 8/10 Severe 80% chance of damaging wind over 30 yrs
- Air quality 2/10 Low 1 unhealthy d/yr today · 2 by 30 yrs out
Nearby sold comps map
Loading sold comps map…
Walkable amenities ~0.75 mi
Loading nearby amenities…
Taxation est. · year 1
- Rental income
- $16,305
- − Mortgage interest
- −$2,745
- − Property taxes
- −$333
- − Insurance
- −$245
- − Repairs & maintenance
- −$1,304
- − Management
- −$1,304
- − Depreciation
- −$1,425
- Taxable income
- $8,948
- Est. tax owed @ 24.0%
- −$2,147
- After-tax cash flow
- $7,072/yr
For passive investors: Depreciation is non-cash, so a rental often shows a tax loss while cash-flowing — sheltering income. Rental losses are passive: they offset passive income freely, and up to $25,000/yr can offset ordinary (W-2) income if you actively participate and your MAGI is under $100k (phasing out to $0 by $150k); unused losses carry forward. On sale, claimed depreciation is recaptured at up to 25%, and gains may owe capital-gains tax (a 1031 exchange can defer both). Figures are a year-1 estimate at your 24.0% rate — not tax advice; consult a CPA.
Schools (NCES district)
- District
- Duplin County Schools
- NCES district ID
- 3701200
- Math proficiency
- 23% ▼ -5.00%
- Reading proficiency
- 32% ▼ -1.00%
- Median HH income
- $34,900
- Composite
- 22.66/100
- National rank
- #8052
- State rank
- #153 of 178 in NC
Livability — Chinquapin
No livability data for this city. (Only ~50 U.S. cities are tracked.)
Census & demographics
- Population (ZIP)
- 1,554
Population outlook (Duplin County) Hauer SSP2
- Today (2025)
- 57,701 people
- By 2030
- 56,333 · -2.4%
- By 2040
- 52,736 · -8.6%
- By 2050
- 48,426 · -16.1%
- By 2075
- 36,339 · -37.0%
- By 2100
- 23,866 · -58.6%
Race, ethnicity, and origin ACS 2023
- Neighborhood character
- Predominantly White (75%)
- Race & ethnicity
- White 75% Black 12% Two or more races 8% Hispanic / Latino 6% Native American 1%
- Hispanic origin (detail)
- Mexican 6%
- Common ancestry
- Italian 1% Serbian 1% Lithuanian 1%
- Foreign-born
- 3% · Canada
- Languages at home
- 94% English-only · Spanish 6%
Political lean MEDSL · Duplin
- 2024 margin
- Strong R (+28.9) · D 35.2% · R 64.2%
- 2008→2024 swing
- -19.5pp toward R · 2008: -9.4pp · 2024: -28.9pp
- All cycles
- 2024: R+28.9 2020: R+22.1 2016: R+19.2 2012: R+11.8 2008: R+9.4
Not yet ingested
- Civics
- —
Market trends
- HPI YoY
- ▲ 6.33%
- Current HPI
- 310.3811
- Rent YoY
- —
- Metro
- —
- State GDP YoY
- ▲ 3.28%
- F500 in state
- 26
Industry mix (Fortune 500 HQ in NC)
| Industry | F500 HQs | Revenue |
|---|---|---|
| Financial Services | 2 | $213B |
|
||
| Retail | 2 | $95B |
|
||
| Industrial Conglomerate | 1 | $38B |
|
||
| Metals / Steel | 1 | $35B |
|
||
| Utilities | 1 | $30B |
|
||
| Industrial Machinery | 1 | $19B |
|
||
Price history
+441.7% since first listed2 events — show timeline
- 2026-05-29 Listed $65,000 Hive MLS
- 2001-08-07 Sold (Public Records) $12,000 Public Records
Property tax history
-0.7%/yrLatest (2025): $333 · -18.7% YoY. Source: county tax records.
Cash-flow waterfall
monthlySold comps — $/sqft
last 12 mo · ≤1 miLoading sold comps…