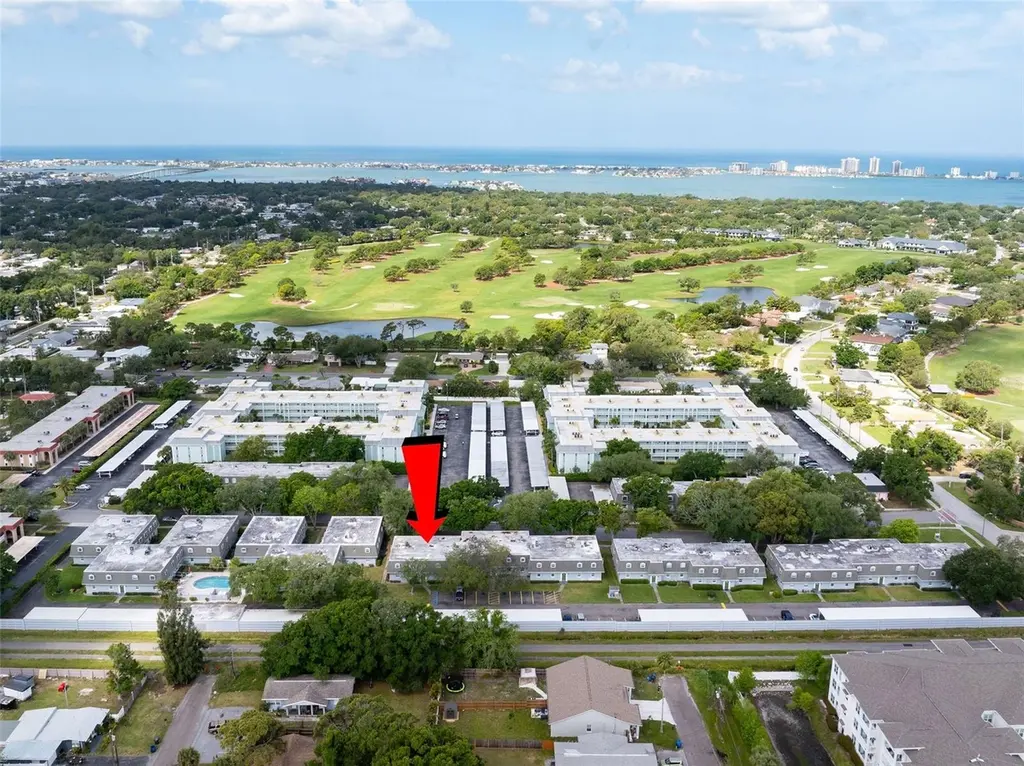
1715 Belleair Forest Dr Unit A · Belleair, FL
Flood risk 1/10 · Minimal
- FEMA flood zone
- X (unshaded)
- Chance of flooding over 30 yrs
- 0.0%
- Est. flood insurance / yr
- $507 – $1,088
Fire risk 1/10 · Minimal
- Est. fire insurance / yr
- $947 – $1,759
Heat risk 10/10 · Severe
- Hot days now (above 108°F)
- 7 days/yr
- Hot days in 30 yrs
- 25 days/yr
Wind risk 10/10 · Severe
- Chance of severe wind over 30 yrs
- 99.0%
Air-quality risk 3/10 · Minor
- Unhealthy air days now
- 2 days/yr
- Unhealthy air days in 30 yrs
- 3 days/yr
Risk factors via First Street. Map © Google.
Why this score? — see what drove the D- grade
The composite is a weighted blend of 9 inputs, each scored 0–100. Each bar is that input's sub-score; the figure is the points it added to the 100-point composite (weight × sub-score).
- Cash flow +10.4/30.0
- ARV discount +7.5/15.0
- 1% rule +6.1/10.0
- Schools +4.3/10.0
- Livability +4.0/5.0
- DSCR +3.0/10.0
- Condition / age +2.5/5.0
- Rent growth +1.9/5.0
- Appreciation +0.0/10.0
$175,000
🖨 Deal sheet (PDF) 📄 Offer letter ✓ Due diligence
Listing remarks MLS
MUST OWN 1 YEAR BEFORE LEASING. MAX PET WEIGHT 20 LBS FOR 1 PET.
Key facts
- First-floor condo
- Ample cabinetry
- In-unit laundry
Tags
Property features AI
Finance
- Other: Irrigation equipment
- Financial info: Total monthly fees $593.50; Total annual fees $7,122; Lease restrictions apply
- HOA & community: Homeowners association managed by Proactive Property Management; Monthly HOA dues $593.50 (includes cable TV, common area taxes, pool, escrow reserves, insurance, internet, structure and grounds maintenance, management, pest control, sewer, trash, water); Association approval required; Buyer approval required; Pets allowed with restrictions (breed restrictions, cats and dogs OK, number limit)
Exterior
- Parking: Carport with 1 space
- Utilities: Public sewer; Cable available; Electricity connected; Water connected
- Home design: Residential condominium; One story; Faces west; Entry on floor 1
- Construction: Block construction; Membrane roof; Slab foundation; Built as part of building 1715
- Exterior features: Sidewalk; Gunite in-ground private pool
Interior
- Kitchen: Dishwasher; Disposal; Range; Refrigerator
- Bedrooms: 2 bedrooms
- Flooring: Vinyl flooring
- Bathrooms: 2 full bathrooms
- Heating & cooling: Central heating; Central air conditioning
- Interior features: Ceiling fans
- Laundry & utility: In-unit laundry room with washer and dryer
Neighborhood map
What this means for you Summary
Snapshot
- This is a 2-bed/2.0-bath condo listed at $175k.
Deal economics
- At list price, monthly cash flow is $-91 ($-1k/yr) — negative.
- To cash-flow at today's rent, offer at most $159k (9.2% below list).
- Meets the 1% rule at list price ($2k rent vs $175k).
- Recommended offer: $159k (9.2% below list) — sets the bar for cash-flow.
- Cap rate 5.7% vs local median 1.1% in Belleair — top-decile yield for the area; either an underpriced asset or a hidden risk that comps aren't pricing in. Stress-test before assuming the spread holds.
Location & tenants
- Location reads 81/100 on livability (#93 in FL, #1,439 nationally) — a professional / high-income tenant draw. Strengths: crime A+, commute A+, employment A+; Watch: amenities F, cost of living F.
- Pinellas (suburban): math 51% / reading 51% proficiency, ranked #31 of 73 in FL (top 42%) — acceptable for families but not a draw, mixed tenant base, ~2y average lease.
- Market conditions: Rents soft (-2.2%/yr); 363 active listings in the ZIP; 40 comparable units currently listed for rent nearby; rentals at typical pace (median 16d on market — plan ~3-4 weeks tenant-placement turnaround); 2,676 units permitted in Pinellas County in 2024 (1,422 in 5+ unit buildings).
- This rent runs 38% of the median local income ($62k/yr) — at the standard rent-burdened threshold; future hikes will face affordability resistance.
Forward outlook
- Local home prices are declining (-3.0%/yr); year-one equity from $1k of loan paydown is wiped out by about $5k of value loss. Plan a longer hold.
- Pinellas County population projected at +14% by 2050 — modest demand growth; plan on rents tracking national, not racing it.
Negotiation context
- It's been on market 62 days — a 6% lower offer ($164k) is reasonable based on typical stale-listing flexibility.
- 2 sale attempts since 20y ago; this cycle's ask has dropped $18k (9%) from the opening price — seller is motivated, your offer sets the floor, not the list.
- Current owner paid $134k; 31% above their basis — modest negotiation headroom, anchor on the comps not their cost.
Risks & watch-outs
- Watch-outs: HOA is 30% of rent.
- Climate carrying-cost: severe wind risk, 99% chance of damaging wind over 30y; extreme-heat days projected 7→25/yr by 2055 (HVAC capex compounding) — expect insurance premiums to compound above CPI over the hold.
Questions for the listing agent
- What do current leases actually rent for vs. the listed asking? Can we see a recent rent roll and the last 12 months of T-12 income?
- It's been on market 62 days. Have you received any prior offers? Is the seller open to a 9% concession, seller financing, or rate buy-down credit?
- Built in 1978 — when were the roof, HVAC, electrical panel, plumbing, and water heater last replaced?
- What does the HOA fee cover, when was the last increase, and are there any pending special assessments or reserve-fund shortfalls?
- Any open or pending special assessments — roof, HVAC, plumbing, elevator, façade? What's the per-unit balance and payoff schedule, and is the seller paying it off at close or rolling it to the buyer?
- Why hasn't it sold? Are there any deal-killer items the seller is aware of (foundation, flood, title, zoning, code violations)?
- Is there a deadline driving the sale (1031 exchange, divorce, estate, relocation)? That informs how much negotiation room exists.
- The area grade is low — what's the realistic commute time and amenity access for the typical tenant pool here? Any planned neighborhood developments (good or bad) we should know about?
- What's the average days-on-market for RENTAL listings here right now (not sales)? A rising rental-DOM trend means longer vacancies and softer asking-rent achievability than the comps imply.
- What's the recent tenant-quality profile in this submarket — average credit score on applications, eviction rate, late-payment / NSF rate, and stable-employment percentage? A property-management company in the area should have these aggregated.
- How much new apartment / multifamily construction is in the pipeline within 1–3 miles? Heavy new supply (>2% of stock underway) typically softens rents 12–24 months out; light construction supports rent growth.
Investment metrics
- 1% rule
- 1.11% ✓
- Cap rate
- 5.67%
- Cash-on-cash
- -2.24%
- DSCR
- 0.90
- GRM
- 7.5
CMA / ARV
No comps found within radius.
Projected returns pro-forma
-3.0% appreciation · 0.0% rent growth · sell at horizon
- IRR
- -24.6%
- Equity multiple
- 0.19×
- Total profit
- $-39,601
- Equity at exit
- $26,093
- IRR
- -40.1%
- Equity multiple
- -0.28×
- Total profit
- $-62,879
- Equity at exit
- $15,131
Cash invested: $49,000 (down + closing). Projections, not guarantees.
Landlord ↔ Tenant lean methodology
- Overall (STATE)
- 87 Strongly Landlord-Friendly
- State Florida
- 87 Strongly Landlord-Friendly · R+3
- County
- — inherits STATE
- City
- — inherits STATE
ZIP-level market 33756
- Rents YoY
- -2.2%
- Active inventory
- 363
- Price-to-rent
- 7.5×
Monthly cashflow live
- Estimated rent
- $1,949 high interval (Pro) →
- Mortgage (P&I)
- −$918
- Tax from tax record
- −$47 /mo · $567/yr
- Insurance
- −$73
- HOA
- −$593
- Vacancy / Maint / Mgmt
- −$409
- Net cashflow
- $-91
Break-even live
Sensitivity live
| Price | -10% $8 | -5% $-42 | +0% $-91 | +5% $-141 | +10% $-190 |
|---|---|---|---|---|---|
| Rent | -10% $-245 | -5% $-168 | +0% $-91 | +5% $-14 | +10% $63 |
| Rate | -1.0pp $-3 | -0.5pp $-47 | base $-91 | +0.5pp $-137 | +1.0pp $-183 |
UW: 25.0% down · 7.5% · 30yr · 1.5% tax · 5.0% vac · 8.0% maint · 8.0% mgmt
Financing live
Cash to close
- Down payment
- $43,750
- Closing costs
- $5,250
- Reserves months
- —
- Total cash needed
- —
Loan-product check · same deal, 3 products live
Conventional
25% down · 7.5% · 30yr
- Down + closing
- —
- Monthly P&I
- —
- Monthly cashflow
- —
- DSCR
- —
- Eligible?
- —
Personal DTI + credit; lowest rate.
DSCR
20% down · 8.5% · 30yr
- Down + closing
- —
- Monthly P&I
- —
- Monthly cashflow
- —
- DSCR
- —
- Eligible?
- —
No personal income docs; deal must DSCR.
Hard money
10% down · 12.0% · 12mo
- Down + closing
- —
- Monthly P&I
- —
- Monthly cashflow
- —
- DSCR
- —
- Eligible?
- —
Short-term bridge; refi at stabilization.
Rent comps 40 comps
| Address | Beds | Baths | Sqft | Rent | $/sqft | DOM | Units | Dist |
|---|---|---|---|---|---|---|---|---|
| 1712 Belleair Forest Dr Unit D Belleair, FL | 2.0 | 1.0 | 931 | $1,495 | $1.61 | 25d | 1 | 0.06mi |
| 1753 Belleair Forest Dr Unit D7 Belleair, FL | 2.0 | 2.0 | 1068 | $1,800 | $1.69 | 25d | 1 | 0.08mi |
| 1006 14th Ave NW Largo, FL | 3.0 | 2.0 | 1444 | $2,450 | $1.70 | 25d | 1 | 0.28mi |
| 811 Rosery Rd NW Largo, FL | 1.0–3.0 | 1.0–3.0 | 1050 | $2,538 | $2.42 | 4d | 20 | 0.29mi |
| 821 14th Ave NW Largo, FL | 3.0 | 1.0 | 900 | $1,795 | $1.99 | 25d | 1 | 0.33mi |
| 1030 Clearwater Largo Rd N Largo, FL | 2.0 | 1.0 | 849 | $1,875 | $2.21 | 25d | 1 | 0.33mi |
| 641 Mehlenbacher Rd Unit 1/2 Belleair Bluffs, FL | 2.0 | 1.0 | 900 | $1,350 | $1.50 | 4d | 1 | 0.37mi |
| 556 Clearwater Largo Rd Unit 1 Largo, FL | 2.0 | 1.0 | 750 | $1,600 | $2.13 | 3d | 1 | 0.43mi |
| 813 4th Ave NW Largo, FL | 3.0 | 1.0 | 1295 | $2,000 | $1.54 | 19d | 1 | 0.47mi |
| 301 Velma Dr E Largo, FL | 2.0 | 2.0 | 1346 | $2,950 | $2.19 | 25d | 1 | 0.52mi |
| 1320 1st Ave NW Largo, FL | 2.0 | 1.0 | 1100 | $2,100 | $1.91 | 25d | 1 | 0.56mi |
| 605 4th Ave NW Largo, FL | 1.0–2.0 | 1.0–2.0 | 1032 | $2,350 | $2.28 | 4d | 6 | 0.57mi |
| 264 Ridge Rd N Largo, FL | 3.0 | 1.5 | 981 | $2,400 | $2.45 | 25d | 1 | 0.60mi |
| 423 4th St NW Largo, FL | 3.0 | 1.0 | 960 | $1,500 | $1.56 | 5d | 1 | 0.61mi |
| 250 Rosery Rd NW Largo, FL | 1.0 | 1.0 | 672 | $1,295 | $1.93 | 4d | 1 | 0.64mi |
| 158 Ridge Rd N Largo, FL | 2.0 | 2.0 | 1155 | $1,925 | $1.67 | 23d | 2 | 0.64mi |
| 158 Ridge Rd N Largo, FL | 2.0 | 2.0 | 1155 | $1,925 | $1.67 | 25d | 1 | 0.64mi |
| 158 Ridge Rd N Largo, FL | 2.0 | 2.0 | 1155 | $1,925 | $1.67 | 16d | 1 | 0.64mi |
| 1500 West Bay Dr Largo, FL | 2.0 | 1.0 | 740 | $1,595 | $2.16 | 16d | 1 | 0.64mi |
| 250 Rosery Rd NW #283 Largo, FL | 2.0 | 1.0 | 764 | $1,395 | $1.83 | 21d | 1 | 0.65mi |
| 428 4th St NW Largo, FL | 2.0 | 1.0 | 850 | $1,900 | $2.24 | 25d | 1 | 0.65mi |
| 162 6th St NW Largo, FL | 2.0 | 2.0 | 1230 | $2,900 | $2.36 | 5d | 1 | 0.70mi |
| 2141 Indian Ave S Belleair Bluffs, FL | 3.0 | 2.0 | 1252 | $2,999 | $2.40 | 13d | 1 | 0.72mi |
| 675 Indian Rocks Rd N Belleair Bluffs, FL | 1.0–2.0 | 1.0–2.0 | 770 | $1,650 | $2.14 | 9d | 4 | 0.76mi |
| 1701 Laurie Ln Belleair, FL | 2.0 | 2.0 | 1260 | $3,750 | $2.98 | 5d | 1 | 0.76mi |
| 2242 Indian Ave S Belleair Bluffs, FL | 3.0 | 2.0 | 1336 | $2,800 | $2.10 | 5d | 1 | 0.78mi |
| 2501 Renatta Dr Unit 1 Belleair Bluffs, FL | 2.0 | 2.0 | 950 | $1,575 | $1.66 | 9d | 1 | 0.81mi |
| 489 Jewel Ct Unit 1 Belleair Bluffs, FL | 2.0 | 2.0 | 950 | $1,800 | $1.89 | 19d | 1 | 0.82mi |
| 911 Washington Ave #212 Largo, FL | 2.0 | 2.0 | 885 | $1,675 | $1.89 | 5d | 1 | 0.83mi |
| 713 Smith St Clearwater, FL | 1.0 | 1.0 | 814 | $1,595 | $1.96 | 4d | 1 | 0.83mi |
| 833 Hall St Clearwater, FL | 1.0 | 1.0 | 700 | $1,350 | $1.93 | 18d | 1 | 0.86mi |
| 833 Hall St Clearwater, FL | 1.0 | 1.0 | 700 | $1,350 | $1.93 | 25d | 1 | 0.86mi |
| 2101 West Bay Dr Largo, FL | 2.0 | 1.0 | 1000 | $1,650 | $1.65 | 5d | 1 | 0.86mi |
| 1632 Clearwater Largo Rd Clearwater, FL | 3.0 | 1.0–2.0 | 961 | $2,499 | $2.60 | 3d | 25 | 0.87mi |
| 1007 Hawkins St Unit A Clearwater, FL | 2.0 | 1.0 | 784 | $1,845 | $2.35 | 25d | 1 | 0.91mi |
| 610 Indian Rocks Rd N #103 Belleair Bluffs, FL | 2.0 | 2.0 | 1230 | $2,300 | $1.87 | 5d | 1 | 0.93mi |
| 1571 S Myrtle Ave Clearwater, FL | 3.0 | 2.0 | 1202 | $2,400 | $2.00 | 25d | 1 | 1.01mi |
| 1552 S Myrtle Ave Clearwater, FL | 2.0 | 1.5 | 750 | $1,750 | $2.33 | 16d | 1 | 1.05mi |
| 1552 S Myrtle Ave Clearwater, FL | 3.0 | 2.0 | 900 | $1,950 | $2.17 | 9d | 1 | 1.05mi |
| 1574 Ewing Ave Clearwater, FL | 3.0 | 2.0 | 1324 | $2,700 | $2.04 | 5d | 1 | 1.09mi |
HOA detail condo
- Monthly dues
- $593 · $7,116/yr
- Assessments
- None detected in remarks — confirm with the listing agent.
Listing history 20 events
-
2026-06-18days on market $175,000 Active 62 DOM
-
2026-06-17days on market $175,000 Active 61 DOM
-
2026-06-16days on market $175,000 Active 60 DOM
-
2026-06-15days on market $175,000 Active 59 DOM
-
2026-06-13days on market $175,000 Active 57 DOM
-
2026-06-09pricedays on market $175,000 Active 53 DOM
-
2026-06-08days on market $179,000 Active 52 DOM
-
2026-06-07days on market $179,000 Active 51 DOM
-
2026-06-04days on market $179,000 Active 48 DOM
-
2026-06-03days on market $179,000 Active 47 DOM
-
2026-06-01days on market $179,000 Active 45 DOM
-
2026-05-31days on market $179,000 Active 44 DOM
-
2026-05-22price $184,000
-
2026-05-13price $187,000
-
2026-04-28price $189,900
-
2026-04-17$193,000 Active
-
2006-09-18soldstatus $133,800
-
2006-08-30soldstatus $133,750 64-char remark
Show marketing remark (64 chars)
MUST OWN 1 YEAR BEFORE LEASING. MAX PET WEIGHT 20 LBS FOR 1 PET.
-
2006-05-08$134,900 64-char remark
Show marketing remark (64 chars)
MUST OWN 1 YEAR BEFORE LEASING. MAX PET WEIGHT 20 LBS FOR 1 PET.
-
1982-09-01soldstatus $55,000
ⓘ Source: listings_history table (triggers on properties + properties_extension) + one-shot
backfill from property_details.listing_events for pre-trigger history.
Tax reassessment forecast FL · Resets to sale price
- Current annual tax
- $567 · $47/mo
- Projected year-2 tax
- $1,452 · $121/mo
- Expected delta
- +$886/yr (+$74/mo · 156.3%)
ⓘ Screening estimate from a state-policy table — verify with the county assessor before closing.
Climate risk First Street
- Flood 1/10 Low FEMA zone X (unshaded) · 0% chance over 30 yrs
- Wildfire 1/10 Low
- Heat 10/10 Extreme 7 d/yr ≥108°F today · 25 d/yr by 30 yrs out
- Wind 10/10 Extreme 99% chance of damaging wind over 30 yrs
- Air quality 3/10 Moderate 2 unhealthy d/yr today · 3 by 30 yrs out
Nearby sold comps map
Loading sold comps map…
Walkable amenities ~0.75 mi
Loading nearby amenities…
Taxation est. · year 1
- Rental income
- $23,384
- − Mortgage interest
- −$9,803
- − Property taxes
- −$567
- − Insurance
- −$875
- − Repairs & maintenance
- −$1,871
- − Management
- −$1,871
- − HOA
- −$7,116
- − Depreciation
- −$5,091
- Taxable loss
- −$3,809
- Est. tax savings @ 24.0%
- +$914
- After-tax cash flow
- $-183/yr
For passive investors: Depreciation is non-cash, so a rental often shows a tax loss while cash-flowing — sheltering income. Rental losses are passive: they offset passive income freely, and up to $25,000/yr can offset ordinary (W-2) income if you actively participate and your MAGI is under $100k (phasing out to $0 by $150k); unused losses carry forward. On sale, claimed depreciation is recaptured at up to 25%, and gains may owe capital-gains tax (a 1031 exchange can defer both). Figures are a year-1 estimate at your 24.0% rate — not tax advice; consult a CPA.
Schools (NCES district)
- District
- Pinellas
- NCES district ID
- 1201560
- Math proficiency
- 51% ▼ -5.00%
- Reading proficiency
- 51% ▼ -3.00%
- Median HH income
- $46,270
- Composite
- 43.27/100
- National rank
- #3046
- State rank
- #31 of 73 in FL
Livability — Belleair
- Score
- 81/100
- State rank
- #93
- US rank
- #1439
Category grades
Schools grade is shown separately in the Schools card above.
Census & demographics
- Census place
- Belleair, FL
- County
- Pinellas County · 939,478 people
- Metro
- Tampa-St. Petersburg-Clearwater, FL
- Population (ZIP)
- 32,201
- Household income
- $61,872
- Rent vs Own
- Severe rent burden
- 1868.0
Population outlook (Pinellas County) Hauer SSP2
- Today (2025)
- 1,027,532 people
- By 2030
- 1,063,586 · +3.5%
- By 2040
- 1,125,020 · +9.5%
- By 2050
- 1,168,637 · +13.7%
- By 2075
- 1,265,188 · +23.1%
- By 2100
- 1,260,357 · +22.7%
Race, ethnicity, and origin ACS 2023
- Neighborhood character
- Majority White (64%)
- Race & ethnicity
- White 64% Hispanic / Latino 18% Black 11% Two or more races 9% Asian 3%
- Hispanic origin (detail)
- Mexican 8% Puerto Rican 5%
- Common ancestry
- Romanian 3% Lithuanian 2% Slovak 2%
- Foreign-born
- 16% · Canada
- Languages at home
- 79% English-only · Spanish 14% Other Indo-European 2% Russian/Polish/Slavic 2%
Political lean MEDSL · Pinellas
- 2024 margin
- Lean R (+5.2) · D 46.9% · R 52.1%
- 2008→2024 swing
- -13.5pp toward R · 2008: 8.3pp · 2024: -5.2pp
- All cycles
- 2024: R+5.2 2020: D+0.2 2016: R+1.1 2012: D+5.6 2008: D+8.3
Not yet ingested
- Civics
- —
Market trends
- HPI YoY
- ▼ -438.74%
- Current HPI
- 354.6792
- Rent YoY
- ▼ -2.22%
- Metro
- Tampa-St. Petersburg-Clearwater, FL
- State GDP YoY
- ▲ 3.28%
- F500 in state
- 36
Industry mix (Fortune 500 HQ in FL)
| Industry | F500 HQs | Revenue |
|---|---|---|
| Industrial Technology | 2 | $29B |
|
||
| Insurance | 2 | $17B |
|
||
| Retail | 1 | $60B |
|
||
| Technology Distribution | 1 | $58B |
|
||
| Homebuilding | 1 | $35B |
|
||
| Technology Manufacturing | 1 | $35B |
|
||
Price history
+234.5% since first listed8 events — show timeline
- 2026-05-22 Price Changed $184,000 Stellar MLS as Distributed by MLS Grid
- 2026-05-13 Price Changed $187,000 Stellar MLS as Distributed by MLS Grid
- 2026-04-28 Price Changed $189,900 Stellar MLS as Distributed by MLS Grid
- 2026-04-17 Listed $193,000 Stellar MLS as Distributed by MLS Grid
- 2006-09-18 Sold (Public Records) $133,800 Public Records
- 2006-08-30 Sold (MLS) $133,750 Stellar MLS as Distributed by MLS Grid
- 2006-05-08 Listed $134,900 Stellar MLS as Distributed by MLS Grid
- 1982-09-01 Sold (Public Records) $55,000 Public Records
Property tax history
-4.3%/yrLatest (2025): $567 · +4.4% YoY. Source: county tax records.
Cash-flow waterfall
monthlySold comps — $/sqft
last 12 mo · ≤1 miLoading sold comps…