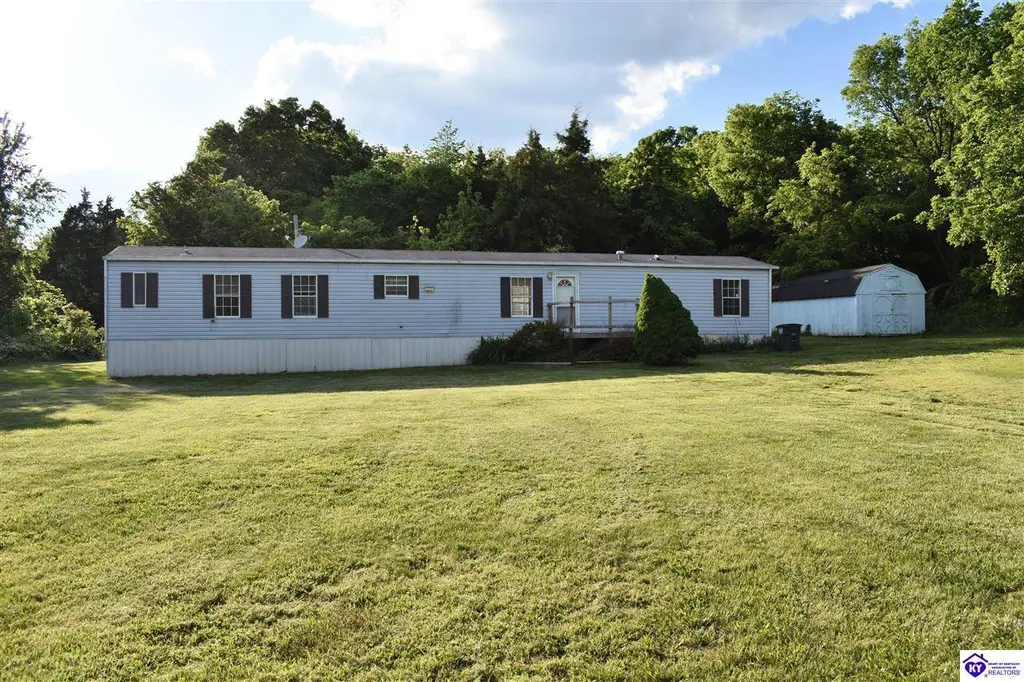
398 Guy Ct · Irvington, KY
Flood risk 1/10 · Minimal
- FEMA flood zone
- X (unshaded)
- Chance of flooding over 30 yrs
- 0.0%
- Est. flood insurance / yr
- $507 – $1,088
Fire risk 4/10 · Minor
- Est. fire insurance / yr
- $839 – $1,559
Heat risk 4/10 · Minor
- Hot days now (above 105°F)
- 7 days/yr
- Hot days in 30 yrs
- 19 days/yr
Wind risk 2/10 · Minimal
- Chance of severe wind over 30 yrs
- 3.0%
Air-quality risk 2/10 · Minimal
- Unhealthy air days now
- 1 days/yr
- Unhealthy air days in 30 yrs
- 1 days/yr
Risk factors via First Street. Map © Google.
Why this score? — see what drove the C- grade
The composite is a weighted blend of 9 inputs, each scored 0–100. Each bar is that input's sub-score; the figure is the points it added to the 100-point composite (weight × sub-score).
- Cash flow +17.3/30.0
- Appreciation +8.1/10.0
- ARV discount +7.5/15.0
- DSCR +5.4/10.0
- Schools +3.8/10.0
- 1% rule +3.6/10.0
- Livability +3.2/5.0
- Rent growth +2.5/5.0
- Condition / age +2.5/5.0
$135,000
🖨 Deal sheet (PDF) 📄 Offer letter ✓ Due diligence
Listing remarks
* * First Time Homeowners * * Quiet, peaceful country living is where you'll be with this home. Renovations and upgrades have been completed: New front and rear porch/deck, New bathroom vanities with a new tub/shower combo, New kitchen cabinets and appliances, New floors, and fresh paint throughout! You'll love the large front yard with pine grove to create a private space perfect for you. Storage is no problem with the large 14x30 lofted storage shed.
Key facts
- 1.86 acre lot
- Built 1997
- Listed 47 days
Property features AI
Finance
- Other: Located in Guy Farm Estates
- HOA & community: No association amenities
Exterior
- Parking: Gravel driveway; No designated garage
- Utilities: Well water; Septic tank; Electricity available
- Home design: Mobile home (residential); Single-family style
- Construction: Vinyl siding; Shingle roof; Pillar/post/pier foundation; Built as a mobile home
- Exterior features: Deck; Porch; Shed(s); Wooded lot
Interior
- Kitchen: Electric range; Refrigerator; Electric water heater
- Flooring: Laminate flooring; Vinyl flooring
- Bathrooms: 2 full bathrooms (both on the main level)
- Heating & cooling: Electric heating; Ceiling fan(s); Window air conditioning units
- Interior features: Ceiling fan(s); Therapeutic whirlpool
Neighborhood map
What this means for you Summary
Snapshot
- This is a 3-bed/2.0-bath other listed at $135k.
Deal economics
- At list price, monthly cash flow is $99 ($1k/yr) — positive.
- The deal already cash-flows at list — no discount required.
- To meet the 1% rule (rent ≥ 1% of price), the offer needs to be $116k (13.9% below list).
- Recommended offer: $116k (13.9% below list) — sets the bar for 1% rule.
- Cap rate 7.2% vs local median 4.2% in Irvington — top-decile yield for the area; either an underpriced asset or a hidden risk that comps aren't pricing in. Stress-test before assuming the spread holds.
Location & tenants
- Location reads 63/100 on livability (#332 in KY) — a middle-class / working-renter tenant base. Strengths: crime A+, cost of living A+, housing A+; Watch: schools D+, amenities F, commute F.
- Meade County (rural): math 41% / reading 48% proficiency, ranked #21 of 165 in KY (top 13%) — families likely to look elsewhere, expect single-tenant / working-renter base with shorter leases.
- Market conditions: 21 active listings in the ZIP; 124 units permitted in Meade County in 2024 (0 in 5+ unit buildings).
Forward outlook
- In year one you build about $9k of equity ($933 loan paydown + $8k appreciation (6.1% local appreciation)).
- Meade County population projected at -20% by 2050 — secular population decline; favor cash flow + early exit over multi-decade hold.
- At projected returns (6.1% appreciation + 3.0% rent growth), your $38k cash investment doubles in ~4 years — after that, you're playing with house money.
- By year 4, paydown + projected appreciation supports a ~$31k cash-out refi (75% LTV) — recoverable capital for the next deal without selling this one.
Negotiation context
- It's been on market 47 days — a 3% lower offer ($131k) is reasonable based on typical stale-listing flexibility.
- 4 sale attempts since 12y ago with the ask held roughly flat each time — persistent listings suggest the price (not the market) is what's stuck; bring a comps-based counter.
- Current owner paid $58k; list at $135k implies a 133% gain — meaningful room to come down on a strong offer.
Questions for the listing agent
- It's been on market 47 days. Have you received any prior offers? Is the seller open to a 14% concession, seller financing, or rate buy-down credit?
- Is there a deadline driving the sale (1031 exchange, divorce, estate, relocation)? That informs how much negotiation room exists.
- Schools are D-rated, which usually means shorter tenancies and higher turnover. Who's the typical renter profile here, and what's been the actual vacancy rate?
- What's the average days-on-market for RENTAL listings here right now (not sales)? A rising rental-DOM trend means longer vacancies and softer asking-rent achievability than the comps imply.
- What's the recent tenant-quality profile in this submarket — average credit score on applications, eviction rate, late-payment / NSF rate, and stable-employment percentage? A property-management company in the area should have these aggregated.
- How much new for-sale + rental construction is in the pipeline within 1–3 miles? Heavy new supply typically softens prices + rents 12–24 months out; constrained supply supports both.
Investment metrics
- 1% rule
- 0.86% ✗
- Cap rate
- 7.17%
- Cash-on-cash
- 3.13%
- DSCR
- 1.14
- GRM
- 9.7
CMA / ARV
No comps found within radius.
Projected returns pro-forma
6.13% appreciation · 3.0% rent growth · sell at horizon
- IRR
- 18.2%
- Equity multiple
- 2.22×
- Total profit
- $46,230
- Equity at exit
- $85,948
- IRR
- 17.7%
- Equity multiple
- 4.46×
- Total profit
- $130,689
- Equity at exit
- $156,804
Cash invested: $37,800 (down + closing). Projections, not guarantees.
Landlord ↔ Tenant lean methodology
- Overall (STATE)
- 83 Strongly Landlord-Friendly
- State Kentucky
- 83 Strongly Landlord-Friendly · R+16
- County
- — inherits STATE
- City
- — inherits STATE
ZIP-level market 40142
- Home prices YoY
- 2.5%
- Active inventory
- 21
- Price-to-rent
- 9.7×
Monthly cashflow live
- Estimated rent
- $1,162 medium interval (Pro) →
- Mortgage (P&I)
- −$708
- Tax from tax record
- −$55 /mo · $659/yr
- Insurance
- −$56
- HOA
- −$0
- Vacancy / Maint / Mgmt
- −$244
- Net cashflow
- $99
Break-even live
Sensitivity live
| Price | -10% $175 | -5% $137 | +0% $99 | +5% $61 | +10% $22 |
|---|---|---|---|---|---|
| Rent | -10% $7 | -5% $53 | +0% $99 | +5% $145 | +10% $191 |
| Rate | -1.0pp $167 | -0.5pp $133 | base $99 | +0.5pp $64 | +1.0pp $28 |
UW: 25.0% down · 7.5% · 30yr · 1.5% tax · 5.0% vac · 8.0% maint · 8.0% mgmt
Financing live
Cash to close
- Down payment
- $33,750
- Closing costs
- $4,050
- Reserves months
- —
- Total cash needed
- —
Loan-product check · same deal, 3 products live
Conventional
25% down · 7.5% · 30yr
- Down + closing
- —
- Monthly P&I
- —
- Monthly cashflow
- —
- DSCR
- —
- Eligible?
- —
Personal DTI + credit; lowest rate.
DSCR
20% down · 8.5% · 30yr
- Down + closing
- —
- Monthly P&I
- —
- Monthly cashflow
- —
- DSCR
- —
- Eligible?
- —
No personal income docs; deal must DSCR.
Hard money
10% down · 12.0% · 12mo
- Down + closing
- —
- Monthly P&I
- —
- Monthly cashflow
- —
- DSCR
- —
- Eligible?
- —
Short-term bridge; refi at stabilization.
Listing history 29 events
-
2026-06-21days on market $135,000 Active 47 DOM
-
2026-06-21days on market $135,000 Active 46 DOM
-
2026-06-18days on market $135,000 Active 44 DOM
-
2026-06-17days on market $135,000 Active 43 DOM
-
2026-06-16days on market $135,000 Active 42 DOM
-
2026-06-15days on market $135,000 Active 41 DOM
-
2026-06-13days on market $135,000 Active 39 DOM
-
2026-06-12days on market $135,000 Active 38 DOM
-
2026-06-09days on market $135,000 Active 35 DOM
-
2026-06-08days on market $135,000 Active 34 DOM
-
2026-06-07days on market $135,000 Active 33 DOM
-
2026-06-07days on market $135,000 Active 32 DOM
-
2026-06-04days on market $135,000 Active 29 DOM
-
2026-06-02days on market $135,000 Active 28 DOM
-
2026-06-01days on market $135,000 Active 27 DOM
-
2026-05-31days on market $135,000 Active 26 DOM
-
2026-05-31days on market $135,000 Active 25 DOM
-
2026-05-05$135,000 Active 459-char remark
-
2025-07-10price $125,000
-
2024-12-31historical
-
2024-07-10price $129,000
-
2024-07-10price $129,000
-
2024-06-06$145,000 Active
-
2024-04-08soldstatus $58,000
-
2024-04-05soldstatus $58,000 Closed
-
2024-01-29status Pending
-
2024-01-21$75,000 Active
-
2014-10-16historical
-
2014-08-05$59,000
ⓘ Source: listings_history table (triggers on properties + properties_extension) + one-shot
backfill from property_details.listing_events for pre-trigger history.
Tax reassessment forecast KY · Resets to sale price
- Current annual tax
- $659 · $55/mo
- Projected year-2 tax
- $1,161 · $97/mo
- Expected delta
- +$502/yr (+$42/mo · 76.1%)
ⓘ Screening estimate from a state-policy table — verify with the county assessor before closing.
Climate risk First Street
- Flood 1/10 Low FEMA zone X (unshaded) · 0% chance over 30 yrs
- Wildfire 4/10 Moderate
- Heat 4/10 Moderate 7 d/yr ≥105°F today · 19 d/yr by 30 yrs out
- Wind 2/10 Low 3% chance of damaging wind over 30 yrs
- Air quality 2/10 Low 1 unhealthy d/yr today · 1 by 30 yrs out
Nearby sold comps map
Loading sold comps map…
Walkable amenities ~0.75 mi
Loading nearby amenities…
Taxation est. · year 1
- Rental income
- $13,943
- − Mortgage interest
- −$7,562
- − Property taxes
- −$659
- − Insurance
- −$675
- − Repairs & maintenance
- −$1,115
- − Management
- −$1,115
- − Depreciation
- −$3,927
- Taxable loss
- −$1,112
- Est. tax savings @ 24.0%
- +$267
- After-tax cash flow
- $1,452/yr
For passive investors: Depreciation is non-cash, so a rental often shows a tax loss while cash-flowing — sheltering income. Rental losses are passive: they offset passive income freely, and up to $25,000/yr can offset ordinary (W-2) income if you actively participate and your MAGI is under $100k (phasing out to $0 by $150k); unused losses carry forward. On sale, claimed depreciation is recaptured at up to 25%, and gains may owe capital-gains tax (a 1031 exchange can defer both). Figures are a year-1 estimate at your 24.0% rate — not tax advice; consult a CPA.
Schools (NCES district)
- District
- Meade County
- NCES district ID
- 2104050
- Math proficiency
- 41% ▼ -15.00%
- Reading proficiency
- 48% ▼ -12.00%
- Median HH income
- $49,628
- Composite
- 38.17/100
- National rank
- #4265
- State rank
- #21 of 165 in KY
Livability — Irvington
- Score
- 63/100
- State rank
- #332
- US rank
- #15797
Category grades
Schools grade is shown separately in the Schools card above.
Census & demographics
- Population (ZIP)
- 2,213
Population outlook (Meade County) Hauer SSP2
- Today (2025)
- 26,977 people
- By 2030
- 26,162 · -3.0%
- By 2040
- 24,029 · -10.9%
- By 2050
- 21,658 · -19.7%
- By 2075
- 16,994 · -37.0%
- By 2100
- 15,586 · -42.2%
Race, ethnicity, and origin ACS 2023
- Neighborhood character
- Predominantly White (95%)
- Race & ethnicity
- White 95% Black 3% Two or more races 2%
- Common ancestry
- Lithuanian 1% Iranian 1% Russian 1%
Political lean MEDSL · Meade
- 2024 margin
- Solid R (+52.1) · D 23.2% · R 75.3% · Other 1.5%
- 2008→2024 swing
- -31.1pp toward R · 2008: -20.9pp · 2024: -52.1pp
- All cycles
- 2024: R+52.1 2020: R+46.4 2016: R+46.1 2012: R+22.8 2008: R+20.9
Not yet ingested
- Civics
- —
Market trends
- HPI YoY
- ▲ 6.13%
- Current HPI
- 252.0176
- Rent YoY
- —
- Metro
- —
- State GDP YoY
- ▲ 1.81%
- F500 in state
- 4
Industry mix (Fortune 500 HQ in KY)
| Industry | F500 HQs | Revenue |
|---|---|---|
| Healthcare | 1 | $118B |
|
||
| Food / Beverage | 1 | $7B |
|
||
Price history
+128.8% since first listed12 events — show timeline
- 2026-05-05 Listed $135,000 HKARMLS
- 2025-07-10 Price Changed $125,000 HKARMLS
- 2024-12-31 Listing Removed — Metro Search MLS
- 2024-07-10 Price Changed $129,000 HKARMLS
- 2024-07-10 Price Changed $129,000 Metro Search MLS
- 2024-06-06 Listed $145,000 Metro Search MLS
- 2024-04-08 Sold (Public Records) $58,000 Public Records
- 2024-04-05 Sold (MLS) $58,000 HKARMLS
- 2024-01-29 Pending — HKARMLS
- 2024-01-21 Listed $75,000 HKARMLS
- 2014-10-16 Listing Removed — Metro Search MLS
- 2014-08-05 Listed $59,000 Metro Search MLS
Property tax history
+24.8%/yrLatest (2025): $659 · +52.5% YoY. Source: county tax records.
Cash-flow waterfall
monthlySold comps — $/sqft
last 12 mo · ≤1 miLoading sold comps…