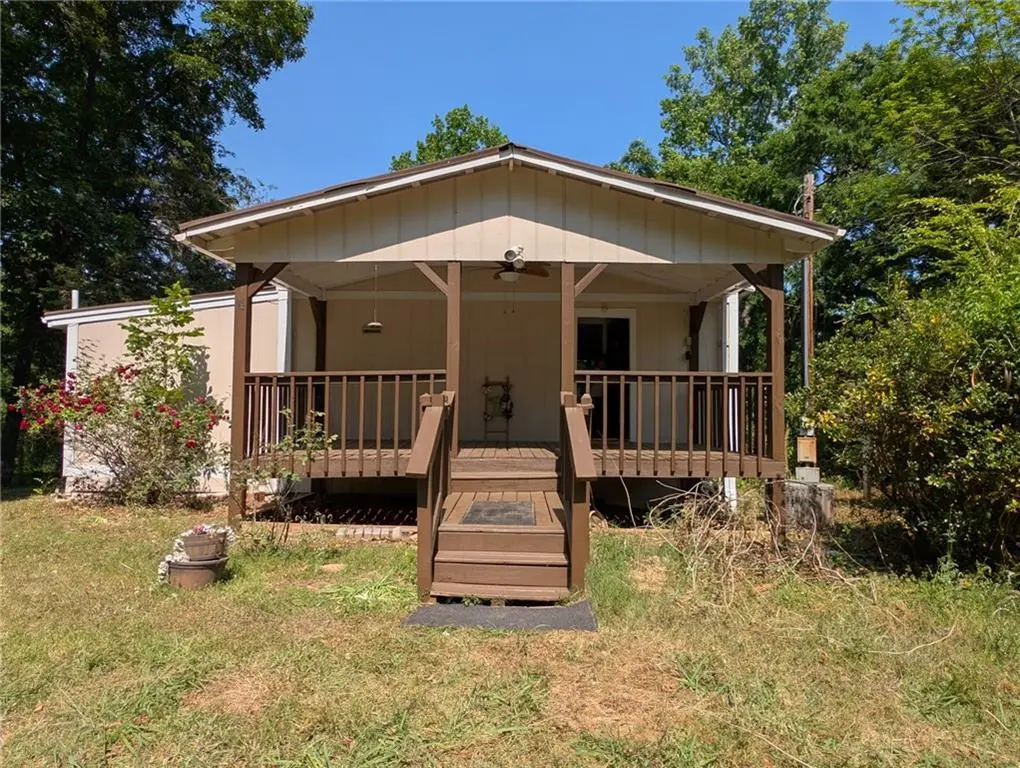
139 Sunset Dr · Eatonton, GA
Flood risk 4/10 · Minor
- FEMA flood zone
- X (unshaded)
- Chance of flooding over 30 yrs
- 0.24%
- Est. flood insurance / yr
- $507 – $1,088
Fire risk 3/10 · Minor
- Est. fire insurance / yr
- $963 – $1,789
Heat risk 7/10 · Major
- Hot days now (above 108°F)
- 7 days/yr
- Hot days in 30 yrs
- 17 days/yr
Wind risk 6/10 · Moderate
- Chance of severe wind over 30 yrs
- 57.0%
Air-quality risk 3/10 · Minor
- Unhealthy air days now
- 3 days/yr
- Unhealthy air days in 30 yrs
- 3 days/yr
Risk factors via First Street. Map © Google.
Why this score? — see what drove the C- grade
The composite is a weighted blend of 9 inputs, each scored 0–100. Each bar is that input's sub-score; the figure is the points it added to the 100-point composite (weight × sub-score).
- Cash flow +16.5/30.0
- ARV discount +15.0/15.0
- DSCR +5.1/10.0
- 1% rule +3.6/10.0
- Livability +3.6/5.0
- Schools +2.7/10.0
- Rent growth +2.5/5.0
- Condition / age +2.5/5.0
- Appreciation +0.0/10.0
$228,800
🖨 Deal sheet 📄 Offer letter ✓ Due diligence
Listing remarks
Sold as is.
Key facts
- 0.57 acre lot
- 2 parking spots
- Built 1982
Property features AI
Exterior
- Parking: Covered carport with 2 spaces
- Utilities: Electric service: 110 volts; Other water source; Other sewer services; Other utilities
- Home design: One-and-a-half story layout; Resale property; Composition roof
- Construction: Other construction materials
- Exterior features: Private yard; Lakefront; Boat launch
Interior
- Kitchen: Cabinets (other)
- Bedrooms: One bedroom on the main level; One bedroom on the lower level
- Flooring: Wood flooring; Other flooring
- Bathrooms: One full bathroom; One half bathroom (lower level)
- Heating & cooling: Other heating
- Interior features: Aluminum-framed windows; No shared/common walls; Basement is bath/stubbed; Other interior features
- Laundry & utility: Electric dryer hookup
Neighborhood map
What this means for you Summary
Snapshot
- This is a 2-bed/2.0-bath single-family listed at $229k.
Deal economics
- At list price, monthly cash flow is $134 ($2k/yr) — positive.
- The deal already cash-flows at list — no discount required.
- To meet the 1% rule (rent ≥ 1% of price), the offer needs to be $197k (13.8% below list).
- Recommended offer: $197k (13.8% below list) — sets the bar for 1% rule.
- Cap rate 7.0% vs local median 4.2% in Eatonton — top-decile yield for the area; either an underpriced asset or a hidden risk that comps aren't pricing in. Stress-test before assuming the spread holds.
Location & tenants
- Location reads 71/100 on livability (#76 in GA) — a middle-class / working-renter tenant base. Strengths: cost of living A+, housing A+, crime A; Watch: amenities F, commute F, employment F.
- Putnam County (rural): math 33% / reading 30% proficiency, ranked #86 of 174 in GA (top 49%) — families likely to look elsewhere, expect single-tenant / working-renter base with shorter leases; 69% free/reduced lunch — lower-income household profile, screen leases tightly.
- Zoned schools: Putnam County Primary School (756 students, 81% FRL); Putnam County Middle School (math 31% / reading 33%, grade F, #229 of 470 statewide, top 49%, 681 students, 81% FRL); Putnam County High School (math 8% / reading 32%, grade F, #238 of 424 statewide, top 57%, 919 students, 81% FRL).
- Market conditions: 522 active listings in the ZIP; 129 units permitted in Putnam County in 2024 (50 in 5+ unit buildings).
- This rent runs 36% of the median local income ($66k/yr) — at the standard rent-burdened threshold; future hikes will face affordability resistance.
Forward outlook
- Local home prices are declining (-3.0%/yr); year-one equity from $2k of loan paydown is wiped out by about $7k of value loss. Plan a longer hold.
- Putnam County population projected at -18% by 2050 — secular population decline; favor cash flow + early exit over multi-decade hold.
Negotiation context
- It's been on market 53 days — a 3% lower offer ($222k) is reasonable based on typical stale-listing flexibility.
Risks & watch-outs
- Climate carrying-cost: major wind risk, 57% chance of damaging wind over 30y; extreme-heat days projected 7→17/yr by 2055 (HVAC capex compounding) — expect insurance premiums to compound above CPI over the hold.
Questions for the listing agent
- It's been on market 53 days. Have you received any prior offers? Is the seller open to a 14% concession, seller financing, or rate buy-down credit?
- Is there a deadline driving the sale (1031 exchange, divorce, estate, relocation)? That informs how much negotiation room exists.
- Schools are F-rated, which usually means shorter tenancies and higher turnover. Who's the typical renter profile here, and what's been the actual vacancy rate?
- What's the average days-on-market for RENTAL listings here right now (not sales)? A rising rental-DOM trend means longer vacancies and softer asking-rent achievability than the comps imply.
- What's the recent tenant-quality profile in this submarket — average credit score on applications, eviction rate, late-payment / NSF rate, and stable-employment percentage? A property-management company in the area should have these aggregated.
- How much new for-sale + rental construction is in the pipeline within 1–3 miles? Heavy new supply typically softens prices + rents 12–24 months out; constrained supply supports both.
Investment metrics
- 1% rule
- 0.86% ✗
- Cap rate
- 7.00%
- Cash-on-cash
- 2.52%
- DSCR
- 1.11
- GRM
- 9.7
CMA / ARV
- ARV (median comp)
- $294,690
- List price
- $228,800
- Delta
- -22.36%
- Verdict
- UNDERPRICED
- Comps
- 20 within 1.0 mi
Show comp detail 10 sales within ~0.75 mi
| Address | Dist | Beds/Ba | Sqft | Sold | Price | $/sf | Match |
|---|---|---|---|---|---|---|---|
| 295 Burtom Rd | 0.21mi | 2/2.0 | 1,200 (+1%) | 10mo | $270,000 | $225 | 80 |
| 156 Anchor Pointe Dr | 0.48mi | 2/2.0 | 1,200 (+1%) | 3mo | $365,000 | $304 | 74 |
| 289 Burtom Rd | 0.20mi | 3/2.0 (+1) | 1,344 (+13%) | 9mo | $299,000 | $222 | 57 |
| 66 Franklin Rd SW | 0.59mi | 2/2.0 | 1,296 (+9%) | 5mo | $400,000 | $309 | 54 |
| 173 Landing Dr | 0.64mi | 3/2.0 (+1) | 1,250 (+5%) | 13mo | $270,000 | $216 | 46 |
| 104 Edgewater Dr | 0.38mi | 3/2.0 (+1) | 1,350 (+13%) | 15mo | $195,000 | $144 | 42 |
| 239 Little River Trl | 0.54mi | 3/2.0 (+1) | 1,300 (+9%) | 17mo | $130,000 | $100 | 41 |
| 280 Anchor Pointe Dr | 0.72mi | 3/2.0 (+1) | 1,280 (+7%) | 12mo | $350,000 | $273 | 40 |
| 103 Little River Run | 0.62mi | 3/2.0 (+1) | 1,280 (+7%) | 18mo | $189,400 | $148 | 39 |
| 153 Edgewater Dr | 0.74mi | 3/2.0 (+1) | 1,296 (+9%) | 13mo | $360,000 | $278 | 35 |
Match score weights: distance 35% · size 25% · config 20% · recency 20%. Top-matched comps best support the ARV.
Projected returns pro-forma
-3.0% appreciation · 3.0% rent growth · sell at horizon
- IRR
- -12.4%
- Equity multiple
- 0.55×
- Total profit
- $-28,582
- Equity at exit
- $34,115
- IRR
- -3.3%
- Equity multiple
- 0.78×
- Total profit
- $-14,139
- Equity at exit
- $19,782
Cash invested: $64,064 (down + closing). Projections, not guarantees.
Landlord ↔ Tenant lean methodology
- Overall (STATE)
- 90 Strongly Landlord-Friendly
- State Georgia
- 90 Strongly Landlord-Friendly · R+3
- County
- — inherits STATE
- City
- — inherits STATE
ZIP-level market 31024
- Active inventory
- 522
- Price-to-rent
- 9.7×
Monthly cashflow live
- Estimated rent
- $1,971 medium interval (Pro) →
- Mortgage (P&I)
- −$1,200
- Tax from tax record
- −$128 /mo · $1,533/yr
- Insurance
- −$95
- HOA
- −$0
- Vacancy / Maint / Mgmt
- −$414
- Net cashflow
- $134
Break-even live
UW: 25.0% down · 7.5% · 30yr · 1.5% tax · 5.0% vac · 8.0% maint · 8.0% mgmt
Financing live
Cash to close
- Down payment
- $57,200
- Closing costs
- $6,864
- Reserves months
- —
- Total cash needed
- —
Loan-product check · same deal, 3 products live
Conventional
25% down · 7.5% · 30yr
- Down + closing
- —
- Monthly P&I
- —
- Monthly cashflow
- —
- DSCR
- —
- Eligible?
- —
Personal DTI + credit; lowest rate.
DSCR
20% down · 8.5% · 30yr
- Down + closing
- —
- Monthly P&I
- —
- Monthly cashflow
- —
- DSCR
- —
- Eligible?
- —
No personal income docs; deal must DSCR.
Hard money
10% down · 12.0% · 12mo
- Down + closing
- —
- Monthly P&I
- —
- Monthly cashflow
- —
- DSCR
- —
- Eligible?
- —
Short-term bridge; refi at stabilization.
Listing history 17 events
-
2026-06-19days on market $228,800 Active 53 DOM
-
2026-06-18days on market $228,800 Active 52 DOM
-
2026-06-17days on market $228,800 Active 51 DOM
-
2026-06-16days on market $228,800 Active 50 DOM
-
2026-06-15days on market $228,800 Active 49 DOM
-
2026-06-14days on market $228,800 Active 47 DOM
-
2026-06-12days on market $228,800 Active 46 DOM
-
2026-06-09days on market $228,800 Active 43 DOM
-
2026-06-08days on market $228,800 Active 42 DOM
-
2026-06-07days on market $228,800 Active 41 DOM
-
2026-06-05days on market $228,800 Active 38 DOM
-
2026-06-03days on market $228,800 Active 37 DOM
-
2026-06-02days on market $228,800 Active 36 DOM
-
2026-06-01days on market $228,800 Active 35 DOM
-
2026-05-31days on market $228,800 Active 34 DOM
-
2026-05-30days on market $228,800 Active 33 DOM
-
2026-04-27$238,800 Active 11-char remark
ⓘ Source: listings_history table (triggers on properties + properties_extension) + one-shot
backfill from property_details.listing_events for pre-trigger history.
Tax reassessment forecast GA · Resets to sale price
- Current annual tax
- $1,533 · $128/mo
- Projected year-2 tax
- $2,105 · $175/mo
- Expected delta
- +$572/yr (+$48/mo · 37.3%)
ⓘ Screening estimate from a state-policy table — verify with the county assessor before closing.
Climate risk First Street
- Flood 4/10 Moderate FEMA zone X (unshaded) · 24% chance over 30 yrs
- Wildfire 3/10 Moderate
- Heat 7/10 Severe 7 d/yr ≥108°F today · 17 d/yr by 30 yrs out
- Wind 6/10 Major 57% chance of damaging wind over 30 yrs
- Air quality 3/10 Moderate 3 unhealthy d/yr today · 3 by 30 yrs out
Nearby sold comps map
Loading sold comps map…
Walkable amenities ~0.75 mi
Loading nearby amenities…
Taxation est. · year 1
- Rental income
- $23,655
- − Mortgage interest
- −$12,816
- − Property taxes
- −$1,533
- − Insurance
- −$1,144
- − Repairs & maintenance
- −$1,892
- − Management
- −$1,892
- − Depreciation
- −$6,656
- Taxable loss
- −$2,278
- Est. tax savings @ 24.0%
- +$547
- After-tax cash flow
- $2,160/yr
For passive investors: Depreciation is non-cash, so a rental often shows a tax loss while cash-flowing — sheltering income. Rental losses are passive: they offset passive income freely, and up to $25,000/yr can offset ordinary (W-2) income if you actively participate and your MAGI is under $100k (phasing out to $0 by $150k); unused losses carry forward. On sale, claimed depreciation is recaptured at up to 25%, and gains may owe capital-gains tax (a 1031 exchange can defer both). Figures are a year-1 estimate at your 24.0% rate — not tax advice; consult a CPA.
Schools (NCES district)
- District
- Putnam County
- NCES district ID
- 1304260
- Math proficiency
- 33% ▼ -5.00%
- Reading proficiency
- 30% ▼ -1.00%
- Median HH income
- $44,038
- Composite
- 26.9/100
- National rank
- #7088
- State rank
- #86 of 174 in GA
Livability — Eatonton
- Score
- 71/100
- State rank
- #76
- US rank
- #6665
Category grades
Schools grade is shown separately in the Schools card above.
Census & demographics
- County
- Putnam County · 21,601 people
- City population
- 21,601
- Metro
- nan
- Population (ZIP)
- 21,601
- Household income
- $65,971
- Rent vs Own
- Severe rent burden
- 696.0
Population outlook (Putnam County) Hauer SSP2
- Today (2025)
- 20,747 people
- By 2030
- 20,163 · -2.8%
- By 2040
- 18,680 · -10.0%
- By 2050
- 17,117 · -17.5%
- By 2075
- 13,269 · -36.0%
- By 2100
- 9,234 · -55.5%
Race, ethnicity, and origin ACS 2023
- Neighborhood character
- Majority White (64%)
- Race & ethnicity
- White 64% Black 26% Hispanic / Latino 7% Two or more races 5%
- Hispanic origin (detail)
- Mexican 4%
- Common ancestry
- Slovak 1% Italian 1% Lithuanian 1%
- Foreign-born
- 6% · Canada
- Languages at home
- 94% English-only · Spanish 5%
Political lean MEDSL · Putnam
- 2024 margin
- Solid R (+42.2) · D 28.7% · R 71.0%
- 2008→2024 swing
- -10.9pp toward R · 2008: -31.4pp · 2024: -42.2pp
- All cycles
- 2024: R+42.2 2020: R+40.9 2016: R+40.0 2012: R+35.8 2008: R+31.4
Not yet ingested
- Civics
- —
Market trends
- HPI YoY
- ▼ -199.84%
- Current HPI
- 269.8265
- Rent YoY
- —
- Metro
- nan
- State GDP YoY
- ▲ 2.66%
- F500 in state
- 28
Industry mix (Fortune 500 HQ in GA)
| Industry | F500 HQs | Revenue |
|---|---|---|
| Paper / Packaging | 2 | $29B |
|
||
| Retail | 1 | $160B |
|
||
| Transportation / Logistics | 1 | $91B |
|
||
| Airlines | 1 | $62B |
|
||
| Consumer Goods | 1 | $47B |
|
||
| Utilities | 1 | $25B |
|
||
Price history
-4.2% since first listed2 events — show timeline
- 2026-05-22 Price Changed $228,800 FMLS
- 2026-04-27 Listed $238,800 FMLS
Property tax history
+2.5%/yrLatest (2025): $1,533 · +5.0% YoY. Source: county tax records.
Cash-flow waterfall
monthlySold comps — $/sqft
last 12 mo · ≤1 miLoading sold comps…