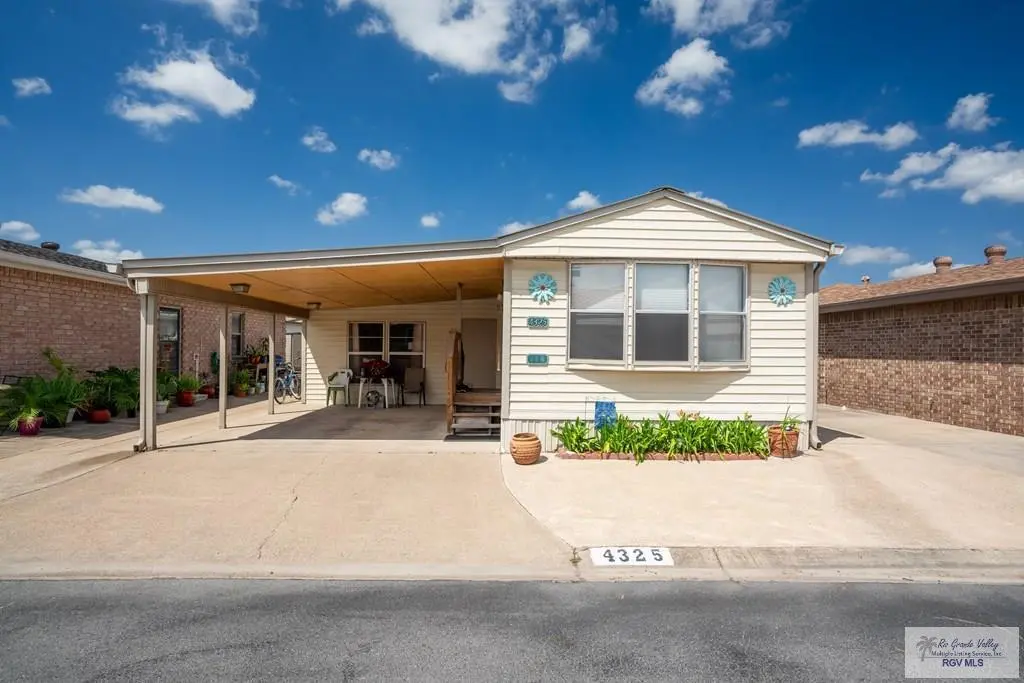
4325 Kansas St · Combes, TX
Flood risk 6/10 · Moderate
- FEMA flood zone
- X (unshaded)
- Chance of flooding over 30 yrs
- 0.74%
- Est. flood insurance / yr
- $507 – $1,088
Fire risk 1/10 · Minimal
- Est. fire insurance / yr
- $1,222 – $2,270
Heat risk 9/10 · Severe
- Hot days now (above 110°F)
- 7 days/yr
- Hot days in 30 yrs
- 22 days/yr
Wind risk 9/10 · Severe
- Chance of severe wind over 30 yrs
- 99.0%
Air-quality risk 1/10 · Minimal
- Unhealthy air days now
- 0 days/yr
- Unhealthy air days in 30 yrs
- 0 days/yr
Risk factors via First Street. Map © Google.
Why this score? — see what drove the B grade
The composite is a weighted blend of 9 inputs, each scored 0–100. Each bar is that input's sub-score; the figure is the points it added to the 100-point composite (weight × sub-score).
- Cash flow +30.0/30.0
- ARV discount +10.1/15.0
- 1% rule +10.0/10.0
- DSCR +10.0/10.0
- Condition / age +3.8/5.0
- Livability +3.2/5.0
- Rent growth +2.5/5.0
- Schools +2.5/10.0
- Appreciation +0.0/10.0
$64,500
🖨 Deal sheet (PDF) 📄 Offer letter ✓ Due diligence
Listing remarks MLS
Move in Ready! Well maintained one bedroom, one bath manufactured home. The second bedroom and bath were added on under the carport. The second bedroom provides room for guests with privacy or could be an office, hobby room, etc. The over 55 community provides many amenities for residents, including golf, swimming, tennis, woodworking shop, pool, library, dog park, and many other activities
Key facts
- Tennis
- Golf
- Swimming
Tags
Neighborhood map
What this means for you Summary
Snapshot
- This is a 2-bed/2.0-bath manufactured listed at $64k. Condition is rated good.
Deal economics
- At list price, monthly cash flow is $534 ($6k/yr) — positive.
- The deal already cash-flows at list — no discount required.
- Meets the 1% rule at list price ($1k rent vs $64k).
- Recommended offer: $61k (6.0% below list) — sets the bar for market timing.
- Cap rate 16.2% vs local median 4.4% in Combes — top-decile yield for the area; either an underpriced asset or a hidden risk that comps aren't pricing in. Stress-test before assuming the spread holds.
Location & tenants
- Location reads 65/100 on livability (#728 in TX) — a middle-class / working-renter tenant base. Strengths: cost of living A+, housing A+, crime A; Watch: schools C-, amenities F, commute F.
- Harlingen CISD (urban): math 25% / reading 35% proficiency, ranked #647 of 826 in TX (top 78%) — families likely to look elsewhere, expect single-tenant / working-renter base with shorter leases; 74% free/reduced lunch — lower-income household profile, screen leases tightly.
- Market conditions: Rents flat; 289 active listings in the ZIP; 10 comparable units currently listed for rent nearby; rentals lingering (median 45d on market — plan ~5-8 weeks vacancy on turnover, expect pricing pressure); 70% of comp listings sitting > 30 days — soft ceiling on asking rent; solid renter incomes; 2,326 units permitted in Cameron County in 2024 (503 in 5+ unit buildings).
- This rent is only 17% of the median local income ($89k/yr) — well below the 30% rent-burden line; pricing power to push rent on renewal without tenant pushback.
Forward outlook
- Local home prices are declining (-3.0%/yr); year-one equity from $446 of loan paydown is wiped out by about $2k of value loss. Plan a longer hold.
- Cameron County population projected at +3% by 2050 — modest demand growth; plan on rents tracking national, not racing it.
- At projected returns (-3.0% appreciation + 0.1% rent growth), your $18k cash investment doubles in ~4 years — after that, you're playing with house money.
Negotiation context
- It's been on market 79 days — a 6% lower offer ($61k) is reasonable based on typical stale-listing flexibility.
Risks & watch-outs
- Climate carrying-cost: major flood risk; severe wind risk, 99% chance of damaging wind over 30y; extreme-heat days projected 7→22/yr by 2055 (HVAC capex compounding) — expect insurance premiums to compound above CPI over the hold.
Questions for the listing agent
- It's been on market 79 days. Have you received any prior offers? Is the seller open to a 6% concession, seller financing, or rate buy-down credit?
- Why hasn't it sold? Are there any deal-killer items the seller is aware of (foundation, flood, title, zoning, code violations)?
- Is there a deadline driving the sale (1031 exchange, divorce, estate, relocation)? That informs how much negotiation room exists.
- What's the average days-on-market for RENTAL listings here right now (not sales)? A rising rental-DOM trend means longer vacancies and softer asking-rent achievability than the comps imply.
- What's the recent tenant-quality profile in this submarket — average credit score on applications, eviction rate, late-payment / NSF rate, and stable-employment percentage? A property-management company in the area should have these aggregated.
- How much new for-sale + rental construction is in the pipeline within 1–3 miles? Heavy new supply typically softens prices + rents 12–24 months out; constrained supply supports both.
Investment metrics
- 1% rule
- 1.92% ✓
- Cap rate
- 16.22%
- Cash-on-cash
- 35.46%
- DSCR
- 2.58
- GRM
- 4.3
CMA / ARV
- ARV (median comp)
- $68,478
- List price
- $64,500
- Delta
- -5.81%
- Verdict
- FAIR
- Comps
- 2 within 1.0 mi
Show comp detail 1 sale within ~0.75 mi
| Address | Dist | Beds/Ba | Sqft | Sold | Price | $/sf | Match |
|---|---|---|---|---|---|---|---|
| 2005 W Montana Ave | 0.27mi | 2/2.0 | 854 (-1%) | 6mo | $95,000 | $111 | 80 |
Match score weights: distance 35% · size 25% · config 20% · recency 20%. Top-matched comps best support the ARV.
Projected returns pro-forma
-3.0% appreciation · 0.08% rent growth · sell at horizon
- IRR
- 27.7%
- Equity multiple
- 2.11×
- Total profit
- $20,015
- Equity at exit
- $9,617
- IRR
- 33.5%
- Equity multiple
- 3.63×
- Total profit
- $47,570
- Equity at exit
- $5,577
Cash invested: $18,060 (down + closing). Projections, not guarantees.
Landlord ↔ Tenant lean methodology
- Overall (STATE)
- 87 Strongly Landlord-Friendly
- State Texas
- 87 Strongly Landlord-Friendly · R+5
- County
- — inherits STATE
- City
- — inherits STATE
ZIP-level market 75052
- Home prices YoY
- -26.3%
- Rents YoY
- 0.1%
- Active inventory
- 289
- Price-to-rent
- 4.3×
Monthly cashflow live
- Estimated rent
- $1,240 high interval (Pro) →
- Mortgage (P&I)
- −$338
- Tax est. 1.5%
- −$81 /mo · $968/yr
- Insurance
- −$27
- HOA
- −$0
- Vacancy / Maint / Mgmt
- −$260
- Net cashflow
- $534
Break-even live
Sensitivity live
| Price | -10% $578 | -5% $556 | +0% $534 | +5% $511 | +10% $489 |
|---|---|---|---|---|---|
| Rent | -10% $436 | -5% $485 | +0% $534 | +5% $583 | +10% $632 |
| Rate | -1.0pp $566 | -0.5pp $550 | base $534 | +0.5pp $517 | +1.0pp $500 |
UW: 25.0% down · 7.5% · 30yr · 1.5% tax · 5.0% vac · 8.0% maint · 8.0% mgmt
Financing live
Cash to close
- Down payment
- $16,125
- Closing costs
- $1,935
- Reserves months
- —
- Total cash needed
- —
Loan-product check · same deal, 3 products live
Conventional
25% down · 7.5% · 30yr
- Down + closing
- —
- Monthly P&I
- —
- Monthly cashflow
- —
- DSCR
- —
- Eligible?
- —
Personal DTI + credit; lowest rate.
DSCR
20% down · 8.5% · 30yr
- Down + closing
- —
- Monthly P&I
- —
- Monthly cashflow
- —
- DSCR
- —
- Eligible?
- —
No personal income docs; deal must DSCR.
Hard money
10% down · 12.0% · 12mo
- Down + closing
- —
- Monthly P&I
- —
- Monthly cashflow
- —
- DSCR
- —
- Eligible?
- —
Short-term bridge; refi at stabilization.
Rent comps 10 comps
| Address | Beds | Baths | Sqft | Rent | $/sqft | DOM | Units | Dist |
|---|---|---|---|---|---|---|---|---|
| 18586 Primera Rd Harlingen, TX | 2.0 | 2.0 | 1100 | $1,095 | $1.00 | 45d | 1 | 0.91mi |
| 2204 Northridge Ave Unit 23 Harlingen, TX | 2.0 | 2.0 | 955 | $1,250 | $1.31 | 22d | 1 | 1.10mi |
| 2204 Northridge Ave Unit 2 Harlingen, TX | 2.0 | 2.0 | 955 | $1,250 | $1.31 | 45d | 1 | 1.10mi |
| 2211 Northridge Ave Unit C Harlingen, TX | 2.0 | 2.0 | 877 | $1,150 | $1.31 | 45d | 1 | 1.14mi |
| 2219 Northridge Ave Harlingen, TX | 2.0 | 2.0 | 830 | $1,000 | $1.20 | 15d | 1 | 1.15mi |
| 2218 Multi National Unit B Harlingen, TX | 2.0 | 2.0 | 877 | $1,100 | $1.25 | 15d | 1 | 1.16mi |
| 2104 Multi National Harlingen, TX | 2.0 | 2.0 | 830 | $1,100 | $1.33 | 45d | 1 | 1.17mi |
| 2205 Multi National Unit A Harlingen, TX | 2.0 | 2.0 | 876 | $1,100 | $1.26 | 45d | 1 | 1.19mi |
| 2209 Multi National Unit D Harlingen, TX | 2.0 | 2.0 | 876 | $1,100 | $1.26 | 45d | 1 | 1.20mi |
| 2005 Southridge Ave Unit A Harlingen, TX | 2.0 | 2.0 | 848 | $1,250 | $1.47 | 45d | 1 | 1.28mi |
Listing history 16 events
-
2026-06-18days on market $64,500 Active 79 DOM
-
2026-06-17days on market $64,500 Active 78 DOM
-
2026-06-16days on market $64,500 Active 77 DOM
-
2026-06-15days on market $64,500 Active 76 DOM
-
2026-06-14days on market $64,500 Active 74 DOM
-
2026-06-10days on market $64,500 Active 71 DOM
-
2026-06-09days on market $64,500 Active 70 DOM
-
2026-06-08days on market $64,500 Active 69 DOM
-
2026-06-07days on market $64,500 Active 68 DOM
-
2026-06-03days on market $64,500 Active 64 DOM
-
2026-06-02days on market $64,500 Active 63 DOM
-
2026-06-01days on market $64,500 Active 62 DOM
-
2026-05-31days on market $64,500 Active 61 DOM
-
2026-05-30days on market $64,500 Active 60 DOM
-
2026-03-30$64,500 Active 394-char remark
Show marketing remark (394 chars)
Move in Ready! Well maintained one bedroom, one bath manufactured home. The second bedroom and bath were added on under the carport. The second bedroom provides room for guests with privacy or could be an office, hobby room, etc. The over 55 community provides many amenities for residents, including golf, swimming, tennis, woodworking shop, pool, library, dog park, and many other activities
-
2025-11-08price $65,500
ⓘ Source: listings_history table (triggers on properties + properties_extension) + one-shot
backfill from property_details.listing_events for pre-trigger history.
Climate risk First Street
- Flood 6/10 Major FEMA zone X (unshaded) · 74% chance over 30 yrs
- Wildfire 1/10 Low
- Heat 9/10 Extreme 7 d/yr ≥110°F today · 22 d/yr by 30 yrs out
- Wind 9/10 Extreme 99% chance of damaging wind over 30 yrs
- Air quality 1/10 Low 0 unhealthy d/yr today · 0 by 30 yrs out
Nearby sold comps map
Loading sold comps map…
Walkable amenities ~0.75 mi
Loading nearby amenities…
Taxation est. · year 1
- Rental income
- $14,877
- − Mortgage interest
- −$3,613
- − Property taxes
- −$968
- − Insurance
- −$322
- − Repairs & maintenance
- −$1,190
- − Management
- −$1,190
- − Depreciation
- −$1,876
- Taxable income
- $5,717
- Est. tax owed @ 24.0%
- −$1,372
- After-tax cash flow
- $5,031/yr
For passive investors: Depreciation is non-cash, so a rental often shows a tax loss while cash-flowing — sheltering income. Rental losses are passive: they offset passive income freely, and up to $25,000/yr can offset ordinary (W-2) income if you actively participate and your MAGI is under $100k (phasing out to $0 by $150k); unused losses carry forward. On sale, claimed depreciation is recaptured at up to 25%, and gains may owe capital-gains tax (a 1031 exchange can defer both). Figures are a year-1 estimate at your 24.0% rate — not tax advice; consult a CPA.
Condition & rehab AI · 14 photos
This move-in ready manufactured home is in good condition with a good condition score of 75. It has a cosmetic rehab level and requires minor repairs to the kitchen cabinets. The home is located in a well-maintained community with many amenities, making it a good investment for both resale and rental.
Repairs flagged
- Minor Kitchen cabinets — Dated design, could be updated for a more modern look.
Value-add opportunities
- Resale Painting exterior siding — Fresh paint can significantly improve curb appeal and home value.
- Resale Updating kitchen cabinets — Modernizing the kitchen can attract more buyers and increase the home's value.
Renovation cost estimate screening
| Repair item | Severity | Est. cost |
|---|---|---|
| Kitchen cabinets · Dated design, could be updated for a more modern look. | Minor | $500–3,000 |
| Total estimated repair cost · 1 items | $500–3,000 |
Value-add ROI direction
- Resale Painting exterior siding — Fresh paint can significantly improve curb appeal and home value. ↑
- Resale Updating kitchen cabinets — Modernizing the kitchen can attract more buyers and increase the home's value. ↑
ⓘ Cost ranges are severity-bucket heuristics (US national rule-of-thumb). Get contractor quotes + a written scope before underwriting a rehab budget.
Schools (NCES district)
- District
- Harlingen CISD
- NCES district ID
- 4822530
- Math proficiency
- 25% ▼ -28.00%
- Reading proficiency
- 35% ▼ -11.00%
- Median HH income
- $37,182
- Composite
- 24.94/100
- National rank
- #7566
- State rank
- #647 of 826 in TX
Livability — Combes
- Score
- 65/100
- State rank
- #728
- US rank
- #13560
Category grades
Schools grade is shown separately in the Schools card above.
Census & demographics
- Census place
- Combes, TX
- County
- Dallas County · 2,612,404 people
- City population
- 435
- Metro
- Dallas-Fort Worth-Arlington, TX
- Population (ZIP)
- 97,278
- Household income
- $89,301
- Rent vs Own
- Severe rent burden
- 3118.0
Population outlook (Cameron County) Hauer SSP2
- Today (2025)
- 441,603 people
- By 2030
- 448,113 · +1.5%
- By 2040
- 456,385 · +3.3%
- By 2050
- 456,294 · +3.3%
- By 2075
- 423,851 · -4.0%
- By 2100
- 342,787 · -22.4%
Race, ethnicity, and origin ACS 2023
- Neighborhood character
- Highly diverse neighborhood (Simpson 0.71)
- Race & ethnicity
- Hispanic / Latino 39% Black 29% White 19% Two or more races 16% Asian 9%
- Hispanic origin (detail)
- Mexican 31% Puerto Rican 1%
- Common ancestry
- Slovak 1% Lithuanian 1% Italian 1%
- Foreign-born
- 21% · Canada, Vietnam, China
- Languages at home
- 62% English-only · Spanish 27% Vietnamese 4% Chinese 1%
Political lean MEDSL · Cameron
- 2024 margin
- Lean R (+5.8) · D 46.7% · R 52.5%
- 2008→2024 swing
- -34.6pp toward R · 2008: 28.8pp · 2024: -5.8pp
- All cycles
- 2024: R+5.8 2020: D+13.2 2016: D+32.5 2012: D+32.4 2008: D+28.8
Not yet ingested
- Civics
- —
Market trends
- HPI YoY
- ▼ -103.08%
- Current HPI
- 289.3711
- Rent YoY
- ▲ 0.08%
- Metro
- Dallas-Fort Worth-Arlington, TX
- State GDP YoY
- ▲ 3.95%
- F500 in state
- 110
Industry mix (Fortune 500 HQ in TX)
| Industry | F500 HQs | Revenue |
|---|---|---|
| Energy | 16 | $1,198B |
|
||
| Technology | 5 | $198B |
|
||
| Engineering / Construction | 4 | $72B |
|
||
| Energy Services | 3 | $60B |
|
||
| Utilities | 3 | $41B |
|
||
| Healthcare | 2 | $330B |
|
||
Price history
-1.5% since first listed2 events — show timeline
- 2026-03-30 Listed $64,500 RGVMLS
- 2025-11-08 Price Changed $65,500 RGVMLS
Cash-flow waterfall
monthlySold comps — $/sqft
last 12 mo · ≤1 miLoading sold comps…