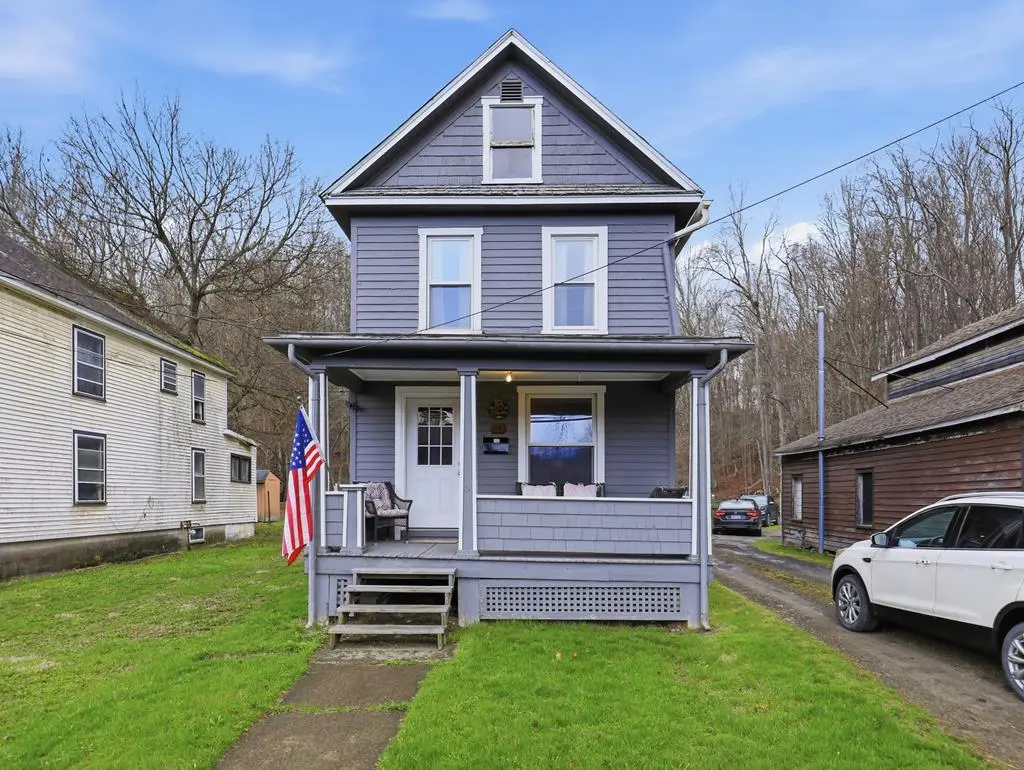
66 Lycoming St · Canton, PA
Flood risk 6/10 · Moderate
- FEMA flood zone
- A
- Chance of flooding over 30 yrs
- 0.71%
- Est. flood insurance / yr
- $1,009 – $1,996
Fire risk 3/10 · Minor
- Est. fire insurance / yr
- $511 – $949
Heat risk 3/10 · Minor
- Hot days now (above 93°F)
- 8 days/yr
- Hot days in 30 yrs
- 17 days/yr
Wind risk 2/10 · Minimal
- Chance of severe wind over 30 yrs
- 2.0%
Air-quality risk 2/10 · Minimal
- Unhealthy air days now
- 0 days/yr
- Unhealthy air days in 30 yrs
- 1 days/yr
Risk factors via First Street. Map © Google.
Why this score? — see what drove the A- grade
The composite is a weighted blend of 9 inputs, each scored 0–100. Each bar is that input's sub-score; the figure is the points it added to the 100-point composite (weight × sub-score).
- Cash flow +30.0/30.0
- ARV discount +15.0/15.0
- DSCR +10.0/10.0
- 1% rule +8.5/10.0
- Appreciation +5.7/10.0
- Schools +3.4/10.0
- Livability +3.3/5.0
- Rent growth +2.5/5.0
- Condition / age +2.5/5.0
$89,999
🖨 Deal sheet 📄 Offer letter ✓ Due diligence
Listing remarks
Charming 3-bedroom, 2-bath home in Canton Borough. Bright and welcoming, this well-kept residence offers a comfortable layout ideal for anyone! Enjoy a functional kitchen, spacious living areas, two full bathrooms, and a yard for outdoor time. Located just minutes from grocery stores, pharmacies, schools, and local amenities, shopping and everyday conveniences are effortless. Excellent value in a friendly neighborhood — schedule a showing today to see this Canton Borough gem.
Key facts
- Functional kitchen
- 0.29 acre lot
- 2 garage spots
Tags
Property features AI
Finance
- Other: Listing broker: Century 21 Jackson Real Estate - Towanda; Listing agent: Alex Schrader
Exterior
- Parking: 2-car garage
- Utilities: Public water; Public sewer
- Home design: Single family residence; 2 stories; Residential property
- Construction: Wood siding construction
- Exterior features: Shingle roof
Interior
- Bathrooms: 1 full bathroom; 1 half bathroom
- Heating & cooling: Baseboard heating; Hot water heating; Natural gas heating
- Interior features: Electric water heater; 6 total rooms
Neighborhood map
What this means for you Summary
Snapshot
- This is a 3-bed/1.5-bath single-family listed at $90k.
Deal economics
- At list price, monthly cash flow is $221 ($3k/yr) — positive.
- The deal already cash-flows at list — no discount required.
- Meets the 1% rule at list price ($1k rent vs $90k).
- Cap rate 10.9% vs local median 4.9% in Canton — top-decile yield for the area; either an underpriced asset or a hidden risk that comps aren't pricing in. Stress-test before assuming the spread holds.
Location & tenants
- Location reads 66/100 on livability (#1,074 in PA) — a middle-class / working-renter tenant base. Strengths: crime A+, cost of living A+, housing A+; Watch: schools D+, employment D, amenities F.
- Canton Area SD (rural): math 31% / reading 49% proficiency, ranked #361 of 539 in PA (top 67%) — families likely to look elsewhere, expect single-tenant / working-renter base with shorter leases.
- Market conditions: 16 active listings in the ZIP; 66 units permitted in Bradford County in 2024 (0 in 5+ unit buildings).
Forward outlook
- In year one you build about $2k of equity ($622 loan paydown + $1k appreciation (1.4% local appreciation)).
- Bradford County population projected at -23% by 2050 — secular population decline; favor cash flow + early exit over multi-decade hold.
- At projected returns (1.4% appreciation + 3.0% rent growth), your $25k cash investment doubles in ~5 years — after that, you're playing with house money.
Negotiation context
- Only 10 days on market — expect competitive offers; lowballing is unlikely to land.
Risks & watch-outs
- Watch-outs: flood insurance adds $125/mo; built in 1910 — expect roof / HVAC / electrical / plumbing capex.
- Climate carrying-cost: in FEMA flood zone A (mandatory federal flood insurance) — expect insurance premiums to compound above CPI over the hold.
Questions for the listing agent
- Built in 1910 — when were the roof, HVAC, electrical panel, plumbing, and water heater last replaced?
- What's the actual annual flood-insurance premium (NFIP or private), and is the property in a SFHA with mandatory coverage?
- Is there a deadline driving the sale (1031 exchange, divorce, estate, relocation)? That informs how much negotiation room exists.
- Schools are D-rated, which usually means shorter tenancies and higher turnover. Who's the typical renter profile here, and what's been the actual vacancy rate?
- What's the average days-on-market for RENTAL listings here right now (not sales)? A rising rental-DOM trend means longer vacancies and softer asking-rent achievability than the comps imply.
- What's the recent tenant-quality profile in this submarket — average credit score on applications, eviction rate, late-payment / NSF rate, and stable-employment percentage? A property-management company in the area should have these aggregated.
- How much new for-sale + rental construction is in the pipeline within 1–3 miles? Heavy new supply typically softens prices + rents 12–24 months out; constrained supply supports both.
Investment metrics
- 1% rule
- 1.35% ✓
- Cap rate
- 10.91%
- Cash-on-cash
- 16.49%
- DSCR
- 1.73
- GRM
- 6.2
CMA / ARV
- ARV (median comp)
- $134,401
- List price
- $89,999
- Delta
- -33.04%
- Verdict
- UNDERPRICED
- Comps
- 20 within 1.0 mi
Show comp detail 4 sales within ~0.75 mi
| Address | Dist | Beds/Ba | Sqft | Sold | Price | $/sf | Match |
|---|---|---|---|---|---|---|---|
| 374 South Minnequa Ave | 0.35mi | 3/1.5 | 1,276 (-4%) | 2mo | $160,000 | $125 | 75 |
| 55 Clinton St | 0.21mi | 2/1.0 (-1) | 1,232 (-7%) | 2mo | $68,000 | $55 | 69 |
| 20 E South Ave | 0.41mi | 4/1.0 (+1) | 1,502 (+13%) | 2mo | $150,000 | $100 | 50 |
| 46 E South Ave | 0.42mi | 3/1.0 | 1,440 (+8%) | 17mo | $32,500 | $23 | 50 |
Match score weights: distance 35% · size 25% · config 20% · recency 20%. Top-matched comps best support the ARV.
Projected returns pro-forma
1.39% appreciation · 3.0% rent growth · sell at horizon
- IRR
- 13.4%
- Equity multiple
- 1.70×
- Total profit
- $17,578
- Equity at exit
- $32,554
- IRR
- 16.6%
- Equity multiple
- 3.10×
- Total profit
- $52,865
- Equity at exit
- $44,713
Cash invested: $25,200 (down + closing). Projections, not guarantees.
Landlord ↔ Tenant lean methodology
- Overall (STATE)
- 62 Landlord-Friendly
- State Pennsylvania
- 62 Landlord-Friendly · EVEN
- County
- — inherits STATE
- City
- — inherits STATE
ZIP-level market 17724
- Home prices YoY
- 0.8%
- Active inventory
- 16
- Price-to-rent
- 6.2×
Monthly cashflow live
- Estimated rent
- $1,217 medium interval (Pro) →
- Mortgage (P&I)
- −$472
- Tax from tax record
- −$105 /mo · $1,265/yr
- Insurance
- −$37
- Flood insurance flood zone
- −$125 /mo · $1,502/yr
- HOA
- −$0
- Vacancy / Maint / Mgmt
- −$256
- Net cashflow
- $221
Break-even live
UW: 25.0% down · 7.5% · 30yr · 1.5% tax · 5.0% vac · 8.0% maint · 8.0% mgmt
Financing live
Cash to close
- Down payment
- $22,500
- Closing costs
- $2,700
- Reserves months
- —
- Total cash needed
- —
Loan-product check · same deal, 3 products live
Conventional
25% down · 7.5% · 30yr
- Down + closing
- —
- Monthly P&I
- —
- Monthly cashflow
- —
- DSCR
- —
- Eligible?
- —
Personal DTI + credit; lowest rate.
DSCR
20% down · 8.5% · 30yr
- Down + closing
- —
- Monthly P&I
- —
- Monthly cashflow
- —
- DSCR
- —
- Eligible?
- —
No personal income docs; deal must DSCR.
Hard money
10% down · 12.0% · 12mo
- Down + closing
- —
- Monthly P&I
- —
- Monthly cashflow
- —
- DSCR
- —
- Eligible?
- —
Short-term bridge; refi at stabilization.
Listing history 2 events
-
2026-05-18status Pending 486-char remark
-
2026-05-07$89,999 Active 486-char remark
ⓘ Source: listings_history table (triggers on properties + properties_extension) + one-shot
backfill from property_details.listing_events for pre-trigger history.
Tax reassessment forecast PA · Partial reset (capped growth)
- Current annual tax
- $1,265 · $105/mo
- Projected year-2 tax
- $1,344 · $112/mo
- Expected delta
- +$78/yr (+$7/mo · 6.2%)
ⓘ Screening estimate from a state-policy table — verify with the county assessor before closing.
Climate risk First Street
- Flood 6/10 Major FEMA zone A · 71% chance over 30 yrs
- Wildfire 3/10 Moderate
- Heat 3/10 Moderate 8 d/yr ≥93°F today · 17 d/yr by 30 yrs out
- Wind 2/10 Low 2% chance of damaging wind over 30 yrs
- Air quality 2/10 Low 0 unhealthy d/yr today · 1 by 30 yrs out
Nearby sold comps map
Loading sold comps map…
Walkable amenities ~0.75 mi
Loading nearby amenities…
Taxation est. · year 1
- Rental income
- $14,601
- − Mortgage interest
- −$5,041
- − Property taxes
- −$1,265
- − Insurance
- −$1,952
- − Repairs & maintenance
- −$1,168
- − Management
- −$1,168
- − Depreciation
- −$2,618
- Taxable income
- $1,388
- Est. tax owed @ 24.0%
- −$333
- After-tax cash flow
- $2,321/yr
For passive investors: Depreciation is non-cash, so a rental often shows a tax loss while cash-flowing — sheltering income. Rental losses are passive: they offset passive income freely, and up to $25,000/yr can offset ordinary (W-2) income if you actively participate and your MAGI is under $100k (phasing out to $0 by $150k); unused losses carry forward. On sale, claimed depreciation is recaptured at up to 25%, and gains may owe capital-gains tax (a 1031 exchange can defer both). Figures are a year-1 estimate at your 24.0% rate — not tax advice; consult a CPA.
Schools (NCES district)
- District
- Canton Area SD
- NCES district ID
- 4204920
- Math proficiency
- 31% ▼ -7.00%
- Reading proficiency
- 49% ▼ -7.00%
- Median HH income
- $42,208
- Composite
- 33.68/100
- National rank
- #5387
- State rank
- #361 of 539 in PA
Livability — Canton
- Score
- 66/100
- State rank
- #1074
- US rank
- #12136
Category grades
Schools grade is shown separately in the Schools card above.
Census & demographics
- Census place
- Canton, PA
- Population (ZIP)
- 4,721
Population outlook (Bradford County) Hauer SSP2
- Today (2025)
- 57,236 people
- By 2030
- 54,660 · -4.5%
- By 2040
- 49,502 · -13.5%
- By 2050
- 44,277 · -22.6%
- By 2075
- 33,420 · -41.6%
- By 2100
- 22,919 · -60.0%
Race, ethnicity, and origin ACS 2023
- Neighborhood character
- Predominantly White (96%)
- Race & ethnicity
- White 96% Two or more races 3% Hispanic / Latino 1%
- Common ancestry
- Romanian 3% Lithuanian 3% Iranian 2%
- Foreign-born
- 1%
- Languages at home
- 99% English-only · German/W. Germanic 1%
Political lean MEDSL · Bradford
- 2024 margin
- Solid R (+47.9) · D 25.6% · R 73.5%
- 2008→2024 swing
- -29.5pp toward R · 2008: -18.4pp · 2024: -47.9pp
- All cycles
- 2024: R+47.9 2020: R+44.9 2016: R+46.0 2012: R+24.6 2008: R+18.4
Not yet ingested
- Civics
- —
Market trends
- HPI YoY
- ▲ 1.39%
- Current HPI
- 180.8366
- Rent YoY
- —
- Metro
- —
- State GDP YoY
- ▲ 1.68%
- F500 in state
- 34
Industry mix (Fortune 500 HQ in PA)
| Industry | F500 HQs | Revenue |
|---|---|---|
| Healthcare | 2 | $309B |
|
||
| Insurance | 2 | $27B |
|
||
| Telecommunications / Media | 1 | $124B |
|
||
| Industrial Distribution | 1 | $22B |
|
||
| Financial Services | 1 | $20B |
|
||
| Chemicals / Materials | 1 | $18B |
|
||
Price history
2 events — show timeline
- 2026-05-18 Pending — NMPA
- 2026-05-07 Listed $89,999 NMPA
Property tax history
+1.2%/yrLatest (2026): $1,265 · +4.2% YoY. Source: county tax records.
Cash-flow waterfall
monthlySold comps — $/sqft
last 12 mo · ≤1 miLoading sold comps…