3929 Dickinson Ave · Celina, TX
Flood risk 1/10 · Minimal
- FEMA flood zone
- X (unshaded)
- Chance of flooding over 30 yrs
- 0.0%
- Est. flood insurance / yr
- $507 – $1,088
Fire risk 5/10 · Moderate
- Est. fire insurance / yr
- $1,222 – $2,270
Heat risk 7/10 · Major
- Hot days now (above 109°F)
- 7 days/yr
- Hot days in 30 yrs
- 23 days/yr
Wind risk 6/10 · Moderate
- Chance of severe wind over 30 yrs
- 27.0%
Air-quality risk 4/10 · Minor
- Unhealthy air days now
- 4 days/yr
- Unhealthy air days in 30 yrs
- 5 days/yr
Risk factors via First Street. Map © Google.
Why this score? — see what drove the D- grade
The composite is a weighted blend of 9 inputs, each scored 0–100. Each bar is that input's sub-score; the figure is the points it added to the 100-point composite (weight × sub-score).
- ARV discount +15.0/15.0
- Cash flow +6.8/30.0
- Schools +5.6/10.0
- Livability +3.4/5.0
- 1% rule +2.8/10.0
- Condition / age +2.5/5.0
- Rent growth +2.0/5.0
- DSCR +1.0/10.0
- Appreciation +0.0/10.0
$323,000
🖨 Deal sheet 📄 Offer letter ✓ Due diligence
Listing remarks MLS
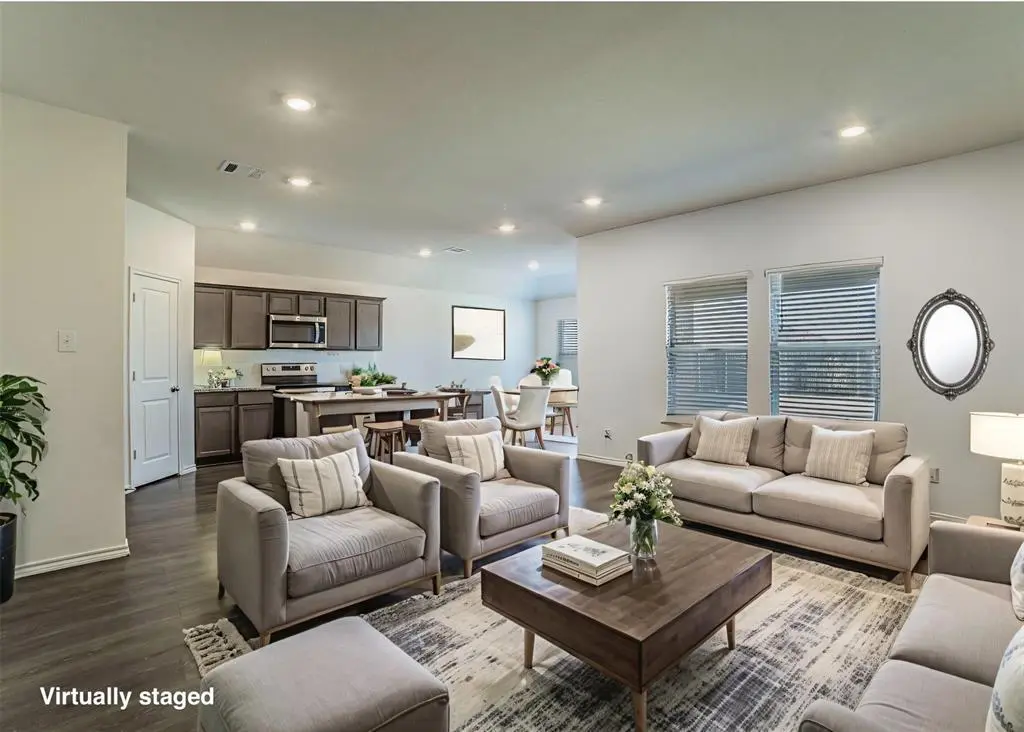
EAST FACING HOME IN PROSPER ISD PRICED BELOW COMPS! This 4-bedroom, 2-bath home is charming. Located in Sutton Fields Master Planned Community. The home features new carpet in all the bedrooms and LVP flooring in the hallways, kitchen, living room, and dining room. Home is piped for natural gas. This home won't last long. Some photos are virtually staged.
Key facts
- East facing home
- New carpet
- Prosper isd
Tags
Neighborhood map
What this means for you Summary
Snapshot
- This is a 4-bed/2.0-bath single-family listed at $323k.
Deal economics
- At list price, monthly cash flow is $-503 ($-6k/yr) — negative.
- To cash-flow at today's rent, offer at most $234k (27.5% below list).
- To meet the 1% rule (rent ≥ 1% of price), the offer needs to be $254k (21.5% below list).
- Recommended offer: $234k (27.5% below list) — sets the bar for cash-flow.
- Cap rate 4.4% vs local median 2.8% in Celina — top-decile yield for the area; either an underpriced asset or a hidden risk that comps aren't pricing in. Stress-test before assuming the spread holds.
Location & tenants
- Location reads 68/100 on livability (#450 in TX) — a middle-class / working-renter tenant base. Strengths: employment A+, housing A+, schools A; Watch: cost of living C-, amenities F, commute F.
- Prosper ISD (rural): math 58% / reading 60% proficiency, ranked #33 of 826 in TX (top 4%) — acceptable for families but not a draw, mixed tenant base, ~2y average lease; only 15% free/reduced lunch — higher-income household profile.
- Market conditions: Rents soft (-1.9%/yr); 1885 active listings in the ZIP; 25 comparable units currently listed for rent nearby; rentals at typical pace (median 19d on market — plan ~3-4 weeks tenant-placement turnaround); high-income renter base; 10,531 units permitted in Denton County in 2024 (2,713 in 5+ unit buildings).
Forward outlook
- Local home prices are declining (-3.0%/yr); year-one equity from $2k of loan paydown is wiped out by about $10k of value loss. Plan a longer hold.
- Denton County population projected at +66% by 2050 — long-run rental-demand tailwind backs the buy-and-hold thesis.
Negotiation context
- It's been on market 155 days — a 12% lower offer ($284k) is reasonable based on typical stale-listing flexibility.
- 5 sale attempts with the ask held roughly flat each time — persistent listings suggest the price (not the market) is what's stuck; bring a comps-based counter.
Risks & watch-outs
- Climate carrying-cost: major wind risk, 27% chance of damaging wind over 30y; moderate wildfire risk; extreme-heat days projected 7→23/yr by 2055 (HVAC capex compounding) — expect insurance premiums to compound above CPI over the hold.
Questions for the listing agent
- What do current leases actually rent for vs. the listed asking? Can we see a recent rent roll and the last 12 months of T-12 income?
- It's been on market 155 days. Have you received any prior offers? Is the seller open to a 28% concession, seller financing, or rate buy-down credit?
- What does the HOA fee cover, when was the last increase, and are there any pending special assessments or reserve-fund shortfalls?
- Why hasn't it sold? Are there any deal-killer items the seller is aware of (foundation, flood, title, zoning, code violations)?
- Is there a deadline driving the sale (1031 exchange, divorce, estate, relocation)? That informs how much negotiation room exists.
- Schools are A-rated — typically a magnet for longer-tenancy family renters. What's the average tenant stay here, and is there a school-zone premium baked into asking?
- The area grade is low — what's the realistic commute time and amenity access for the typical tenant pool here? Any planned neighborhood developments (good or bad) we should know about?
- What's the average days-on-market for RENTAL listings here right now (not sales)? A rising rental-DOM trend means longer vacancies and softer asking-rent achievability than the comps imply.
- What's the recent tenant-quality profile in this submarket — average credit score on applications, eviction rate, late-payment / NSF rate, and stable-employment percentage? A property-management company in the area should have these aggregated.
- How much new for-sale + rental construction is in the pipeline within 1–3 miles? Heavy new supply typically softens prices + rents 12–24 months out; constrained supply supports both.
Investment metrics
- 1% rule
- 0.78% ✗
- Cap rate
- 4.42%
- Cash-on-cash
- -6.68%
- DSCR
- 0.70
- GRM
- 10.6
CMA / ARV
- ARV (median comp)
- $410,759
- List price
- $323,000
- Delta
- -21.37%
- Verdict
- UNDERPRICED
- Comps
- 20 within 1.0 mi
Show comp detail 12 sales within ~0.75 mi
| Address | Dist | Beds/Ba | Sqft | Sold | Price | $/sf | Match |
|---|---|---|---|---|---|---|---|
| 3918 Faulkner Ave | 0.09mi | 4/2.0 | 1,861 (+10%) | 1mo | $350,000 | $188 | 79 |
| 6320 Brunswick Dr | 0.27mi | 3/2.0 (-1) | 1,664 (-2%) | 0mo | $329,900 | $198 | 79 |
| 4748 Pin Oak Ct | 0.46mi | 4/2.0 | 1,783 (+5%) | 16mo | $390,000 | $219 | 57 |
| 6111 Gloucester Dr | 0.60mi | 3/2.0 (-1) | 1,874 (+10%) | 3mo | $340,000 | $181 | 47 |
| 6114 Sutton Fields Trl | 0.58mi | 3/2.0 (-1) | 1,873 (+10%) | 5mo | $360,000 | $192 | 47 |
| 5817 Edward Dr | 0.69mi | 3/2.0 (-1) | 1,868 (+10%) | 6mo | $399,990 | $214 | 41 |
| 3720 American Paint Dr | 0.58mi | 3/2.5 (-1) | 1,944 (+14%) | 2mo | $439,000 | $226 | 40 |
| 4000 Fitzgerald Ave | 0.52mi | 4/2.0 | 1,935 (+14%) | 17mo | $477,990 | $247 | 39 |
| 6041 Tudor Ln | 0.52mi | 4/2.0 | 1,935 (+14%) | 17mo | $475,990 | $246 | 38 |
| 4405 Whitman Ave | 0.71mi | 3/2.0 (-1) | 1,868 (+10%) | 13mo | $464,990 | $249 | 35 |
| 4342 Whitman Ave | 0.71mi | 3/2.0 (-1) | 1,868 (+10%) | 17mo | $502,054 | $269 | 31 |
| 2517 Halter Dr | 0.66mi | 3/2.0 (-1) | 1,944 (+14%) | 16mo | $470,333 | $242 | 27 |
Match score weights: distance 35% · size 25% · config 20% · recency 20%. Top-matched comps best support the ARV.
Projected returns pro-forma
-3.0% appreciation · 0.0% rent growth · sell at horizon
- IRR
- -31.7%
- Equity multiple
- -0.01×
- Total profit
- $-91,622
- Equity at exit
- $48,160
- IRR
- -60.7%
- Equity multiple
- -0.65×
- Total profit
- $-148,936
- Equity at exit
- $27,927
Cash invested: $90,440 (down + closing). Projections, not guarantees.
Landlord ↔ Tenant lean methodology
- Overall (STATE)
- 87 Strongly Landlord-Friendly
- State Texas
- 87 Strongly Landlord-Friendly · R+5
- County
- — inherits STATE
- City
- — inherits STATE
ZIP-level market 76227
- Home prices YoY
- -19.0%
- Rents YoY
- -1.9%
- Active inventory
- 1885
- Price-to-rent
- 10.6×
Monthly cashflow live
- Estimated rent
- $2,535 high interval (Pro) →
- Mortgage (P&I)
- −$1,694
- Tax from tax record
- −$632 /mo · $7,579/yr
- Insurance
- −$135
- HOA
- −$46
- Vacancy / Maint / Mgmt
- −$532
- Net cashflow
- $-503
Break-even live
UW: 25.0% down · 7.5% · 30yr · 1.5% tax · 5.0% vac · 8.0% maint · 8.0% mgmt
Financing live
Cash to close
- Down payment
- $80,750
- Closing costs
- $9,690
- Reserves months
- —
- Total cash needed
- —
Loan-product check · same deal, 3 products live
Conventional
25% down · 7.5% · 30yr
- Down + closing
- —
- Monthly P&I
- —
- Monthly cashflow
- —
- DSCR
- —
- Eligible?
- —
Personal DTI + credit; lowest rate.
DSCR
20% down · 8.5% · 30yr
- Down + closing
- —
- Monthly P&I
- —
- Monthly cashflow
- —
- DSCR
- —
- Eligible?
- —
No personal income docs; deal must DSCR.
Hard money
10% down · 12.0% · 12mo
- Down + closing
- —
- Monthly P&I
- —
- Monthly cashflow
- —
- DSCR
- —
- Eligible?
- —
Short-term bridge; refi at stabilization.
Rent comps 25 comps
| Address | Beds | Baths | Sqft | Rent | $/sqft | DOM | Units | Dist |
|---|---|---|---|---|---|---|---|---|
| 3918 Dickinson Ave Aubrey, TX | 4.0 | 2.0 | 1702 | $2,750 | $1.62 | 44d | 1 | 0.06mi |
| 6217 Bracken Dr Aubrey, TX | 4.0 | 2.0 | 2124 | $2,449 | $1.15 | 19d | 1 | 0.16mi |
| 3304 Lake Palestine Rd Celina, TX | 4.0 | 3.0 | 2179 | $2,650 | $1.22 | 13d | 1 | 0.61mi |
| 6113 Tahoe Winds Dr Celina, TX | 4.0 | 3.5 | 2174 | $2,800 | $1.29 | 24d | 1 | 0.64mi |
| 6214 Halton Dr Aubrey, TX | 4.0 | 2.0 | 2050 | $2,349 | $1.15 | 44d | 1 | 0.66mi |
| 6133 Hightower St Aubrey, TX | 4.0 | 2.0 | 2010 | $2,200 | $1.09 | 5d | 1 | 0.69mi |
| 6125 Hightower St Aubrey, TX | 4.0 | 3.0 | 2119 | $2,495 | $1.18 | 13d | 1 | 0.69mi |
| 6120 Hightower St Aubrey, TX | 3.0 | 2.0 | 1734 | $2,100 | $1.21 | 24d | 1 | 0.72mi |
| 6020 Halton Dr Aubrey, TX | 3.0 | 2.0 | 1900 | $2,150 | $1.13 | 19d | 1 | 0.73mi |
| 6109 White Creek Dr Celina, TX | 4.0 | 3.0 | 2168 | $2,899 | $1.34 | 2d | 1 | 0.73mi |
| 6249 White Creek Dr Celina, TX | 4.0 | 3.0 | 2168 | $2,495 | $1.15 | 11d | 1 | 0.75mi |
| 6108 Shasta Creek Rd Celina, TX | 4.0 | 2.5 | 2123 | $2,700 | $1.27 | 13d | 1 | 0.75mi |
| 6108 Shasta Creek Rd Celina, TX | 4.0 | 2.5 | 2123 | $2,650 | $1.25 | 5d | 1 | 0.75mi |
| 6124 Shasta Creek Rd Celina, TX | 4.0 | 3.0 | 2183 | $2,595 | $1.19 | 4d | 1 | 0.77mi |
| 6122 Heron Dr Aubrey, TX | 4.0 | 3.0 | 2069 | $2,300 | $1.11 | 7d | 1 | 0.78mi |
| 5928 Mustang Creek Ln Celina, TX | 3.0 | 2.5 | 1900 | $2,395 | $1.26 | 13d | 1 | 0.81mi |
| 4805 Cleves Ave Aubrey, TX | 3.0 | 2.0 | 2018 | $2,450 | $1.21 | 44d | 1 | 0.88mi |
| 6233 Lassen Ct Aubrey, TX | 4.0 | 3.0 | 2080 | $2,550 | $1.23 | 13d | 1 | 1.06mi |
| 5948 Prairie Dr Prosper, TX | 3.0 | 2.0 | 1626 | $2,275 | $1.40 | 24d | 1 | 1.13mi |
| 1925 Trace Dr Aubrey, TX | 3.0 | 2.0 | 1989 | $2,395 | $1.20 | 44d | 1 | 1.18mi |
| 5905 Rostherne Dr Aubrey, TX | 4.0 | 2.0 | 2007 | $2,250 | $1.12 | 44d | 1 | 1.18mi |
| 5809 Sandown Dr Aubrey, TX | 4.0 | 3.0 | 2222 | $2,700 | $1.22 | 44d | 1 | 1.26mi |
| 5237 Sandrine Ave Aubrey, TX | 4.0 | 3.0 | 2080 | $2,450 | $1.18 | 44d | 1 | 1.31mi |
| 1810 Aslynn Cir Aubrey, TX | 4.0 | 2.0 | 1585 | $2,475 | $1.56 | 3d | 1 | 1.44mi |
| 1806 Aslynn Cir Aubrey, TX | 4.0 | 3.5 | 2098 | $2,900 | $1.38 | 24d | 1 | 1.44mi |
HOA detail
- Monthly dues
- $46 · $552/yr
- Likely covers
- gas
Listing history 22 events
-
2026-06-09days on market $323,000 Active 155 DOM
-
2026-06-08days on market $323,000 Active 154 DOM
-
2026-06-07days on market $323,000 Active 153 DOM
-
2026-06-04days on market $323,000 Active 150 DOM
-
2026-06-03days on market $323,000 Active 149 DOM
-
2026-06-02days on market $323,000 Active 148 DOM
-
2026-06-01days on market $323,000 Active 147 DOM
-
2026-05-31days on market $323,000 Active 146 DOM
-
2026-04-01price $323,000 365-char remark
Show marketing remark (365 chars)
EAST FACING HOME IN PROSPER ISD PRICED BELOW COMPS! This 4-bedroom, 2-bath home is charming. Located in Sutton Fields Master Planned Community. The home features new carpet in all the bedrooms and LVP flooring in the hallways, kitchen, living room, and dining room. Home is piped for natural gas. This home won't last long. Some photos are virtually staged.
-
2026-01-03$325,000 Active 365-char remark
Show marketing remark (365 chars)
EAST FACING HOME IN PROSPER ISD PRICED BELOW COMPS! This 4-bedroom, 2-bath home is charming. Located in Sutton Fields Master Planned Community. The home features new carpet in all the bedrooms and LVP flooring in the hallways, kitchen, living room, and dining room. Home is piped for natural gas. This home won't last long. Some photos are virtually staged.
-
2025-12-20historical $2,400
-
2025-12-19historical
-
2025-11-19price $339,000
-
2025-10-14$2,400
-
2025-10-11$364,900 Active
-
2025-09-18historical $2,250
-
2025-09-17historical
-
2025-08-07$2,250
-
2025-07-31price $369,900
-
2025-07-29soldstatus
-
2025-05-13$379,000 Active
-
2022-03-21soldstatus
ⓘ Source: listings_history table (triggers on properties + properties_extension) + one-shot
backfill from property_details.listing_events for pre-trigger history.
Tax reassessment forecast TX · Resets to sale price
- Current annual tax
- $7,579 · $632/mo
- Projected year-2 tax
- $7,579 · $632/mo
- Expected delta
- $0/yr ($0/mo · 0.0%)
ⓘ Screening estimate from a state-policy table — verify with the county assessor before closing.
Climate risk First Street
- Flood 1/10 Low FEMA zone X (unshaded) · 0% chance over 30 yrs
- Wildfire 5/10 Major
- Heat 7/10 Severe 7 d/yr ≥109°F today · 23 d/yr by 30 yrs out
- Wind 6/10 Major 27% chance of damaging wind over 30 yrs
- Air quality 4/10 Moderate 4 unhealthy d/yr today · 5 by 30 yrs out
Nearby sold comps map
Loading sold comps map…
Walkable amenities ~0.75 mi
Loading nearby amenities…
Taxation est. · year 1
- Rental income
- $30,420
- − Mortgage interest
- −$18,093
- − Property taxes
- −$7,579
- − Insurance
- −$1,615
- − Repairs & maintenance
- −$2,434
- − Management
- −$2,434
- − HOA
- −$552
- − Depreciation
- −$9,396
- Taxable loss
- −$11,683
- Est. tax savings @ 24.0%
- +$2,804
- After-tax cash flow
- $-3,237/yr
For passive investors: Depreciation is non-cash, so a rental often shows a tax loss while cash-flowing — sheltering income. Rental losses are passive: they offset passive income freely, and up to $25,000/yr can offset ordinary (W-2) income if you actively participate and your MAGI is under $100k (phasing out to $0 by $150k); unused losses carry forward. On sale, claimed depreciation is recaptured at up to 25%, and gains may owe capital-gains tax (a 1031 exchange can defer both). Figures are a year-1 estimate at your 24.0% rate — not tax advice; consult a CPA.
Schools (NCES district)
- District
- Prosper ISD
- NCES district ID
- 4836000
- Math proficiency
- 58% ▼ -16.00%
- Reading proficiency
- 60% ▼ -9.00%
- Median HH income
- $107,993
- Composite
- 55.79/100
- National rank
- #1212
- State rank
- #33 of 826 in TX
Livability — Celina
- Score
- 68/100
- State rank
- #450
- US rank
- #9135
Category grades
Schools grade is shown separately in the Schools card above.
Census & demographics
- Census place
- Celina, TX
- County
- Denton County · 901,654 people
- City population
- 34,260
- Metro
- Dallas-Fort Worth-Arlington, TX
- Population (ZIP)
- 62,127
- Household income
- $111,402
- Rent vs Own
- Severe rent burden
- 959.0
Population outlook (Denton County) Hauer SSP2
- Today (2025)
- 1,053,010 people
- By 2030
- 1,192,269 · +13.2%
- By 2040
- 1,472,920 · +39.9%
- By 2050
- 1,746,506 · +65.9%
- By 2075
- 2,358,497 · +124.0%
- By 2100
- 2,779,183 · +163.9%
Race, ethnicity, and origin ACS 2023
- Neighborhood character
- Diverse neighborhood (Simpson 0.63)
- Race & ethnicity
- White 55% Black 19% Hispanic / Latino 17% Two or more races 13% Asian 4%
- Hispanic origin (detail)
- Mexican 12% Puerto Rican 1%
- Common ancestry
- Lithuanian 4% Slovak 2% Italian 1%
- Foreign-born
- 11% · Canada, Jamaica
- Languages at home
- 82% English-only · Spanish 10% Other Indo-European 2% Other Asian/Pacific 2%
Political lean MEDSL · Denton
- 2024 margin
- R (+13.2) · D 42.7% · R 55.8% · Other 1.5%
- 2008→2024 swing
- +11.0pp toward D · 2008: -24.2pp · 2024: -13.2pp
- All cycles
- 2024: R+13.2 2020: R+8.1 2016: R+20.2 2012: R+31.7 2008: R+24.2
Not yet ingested
- Civics
- —
Market trends
- HPI YoY
- ▼ -59.76%
- Current HPI
- 254.2895
- Rent YoY
- ▼ -1.88%
- Metro
- Dallas-Fort Worth-Arlington, TX
- State GDP YoY
- ▲ 3.95%
- F500 in state
- 110
Industry mix (Fortune 500 HQ in TX)
| Industry | F500 HQs | Revenue |
|---|---|---|
| Energy | 16 | $1,198B |
|
||
| Technology | 5 | $198B |
|
||
| Engineering / Construction | 4 | $72B |
|
||
| Energy Services | 3 | $60B |
|
||
| Utilities | 3 | $41B |
|
||
| Healthcare | 2 | $330B |
|
||
Price history
-14.8% since first listed14 events — show timeline
- 2026-04-01 Price Changed $323,000 NTREIS
- 2026-01-03 Listed $325,000 NTREIS
- 2025-12-20 Rental Removed $2,400 NTREIS
- 2025-12-19 Listing Removed — NTREIS
- 2025-11-19 Price Changed $339,000 NTREIS
- 2025-10-14 Listed for Rent $2,400 NTREIS
- 2025-10-11 Listed $364,900 NTREIS
- 2025-09-18 Rental Removed $2,250 NTREIS
- 2025-09-17 Listing Removed — NTREIS
- 2025-08-07 Listed for Rent $2,250 NTREIS
- 2025-07-31 Price Changed $369,900 NTREIS
- 2025-07-29 Sold (Public Records) — Public Records
- 2025-05-13 Listed $379,000 NTREIS
- 2022-03-21 Sold (Public Records) — Public Records
Property tax history
+52.5%/yrLatest (2025): $7,579 · -4.3% YoY. Source: county tax records.
Cash-flow waterfall
monthlySold comps — $/sqft
last 12 mo · ≤1 miLoading sold comps…