4777 S Texas Ave Unit 4777A · Orlando, FL
Flood risk No data
- FEMA flood zone
- —
- Chance of flooding over 30 yrs
- —
- Est. flood insurance / yr
- —
Fire risk No data
- Est. fire insurance / yr
- —
Heat risk No data
- Hot days now (above threshold)
- —
- Hot days in 30 yrs
- —
Wind risk No data
- Chance of severe wind over 30 yrs
- —
Air-quality risk No data
- Unhealthy air days now
- —
- Unhealthy air days in 30 yrs
- —
Risk factors via First Street. Map © Google.
Why this score? — see what drove the D+ grade
The composite is a weighted blend of 9 inputs, each scored 0–100. Each bar is that input's sub-score; the figure is the points it added to the 100-point composite (weight × sub-score).
- Cash flow +14.9/30.0
- 1% rule +9.6/10.0
- ARV discount +7.5/15.0
- DSCR +4.6/10.0
- Livability +4.3/5.0
- Schools +4.1/10.0
- Condition / age +2.5/5.0
- Rent growth +2.4/5.0
- Appreciation +0.0/10.0
$98,000
🖨 Deal sheet 📄 Offer letter ✓ Due diligence
Listing remarks
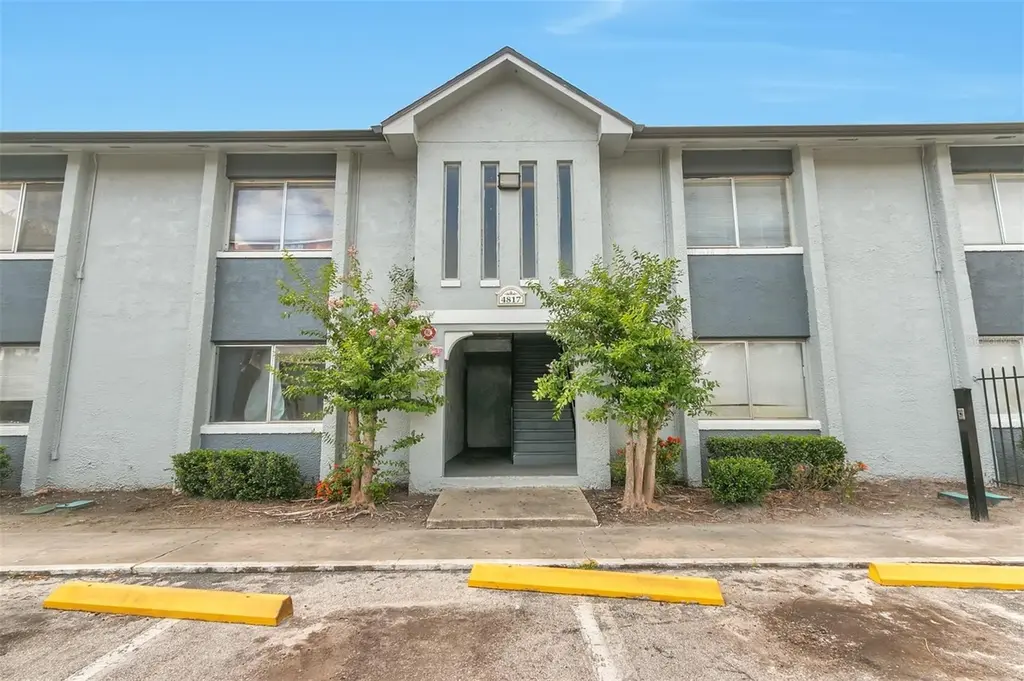
Under contract-accepting backup offers. Easy to show! This well-maintained 2-bedroom, 2-bath unit is in move-in condition and offers comfort and convenience. The home features a functional layout and includes kitchen appliances, plus an in-unit washer and dryer. Ideal for first-time buyers or a great opportunity for rental investors.
Key facts
- Kitchen appliances
- Functional layout
- $409 HOA
Tags
Property features AI
Finance
- Other: Unfurnished
- Financial info: Total annual fees $4,908; Lease restrictions apply
- HOA & community: Monthly condo/HOA fee $409 (monthly); Association covers structure maintenance, pest control, pool, recreational facilities and trash; Association approval required; Community amenities include a pool, sidewalks and owned recreational facilities; Pets allowed with limits (max weight 40 lbs)
Exterior
- Parking: Other parking
- Utilities: Public water; Public sewer; Electricity available; Sewer available; Water available
- Home design: Residential condominium; One story; Faces west; Entry on floor 1
- Construction: Block, concrete and stucco construction; Shingle roof; Block foundation; Built as part of building number 4777
- Exterior features: Sliding doors; Asphalt road access
Interior
- Kitchen: Range; Microwave; Refrigerator; Stone counters
- Bedrooms: 2 bedrooms
- Flooring: Ceramic tile; Vinyl
- Bathrooms: 2 full bathrooms
- Heating & cooling: Central heating; Central air conditioning
- Interior features: Stone counters; Sliding doors
- Laundry & utility: Washer; Dryer; Inside laundry in a laundry closet
Neighborhood map
What this means for you Summary
Snapshot
- This is a 2-bed/2.0-bath condo listed at $98k.
Deal economics
- At list price, monthly cash flow is $29 ($351/yr) — positive.
- The deal already cash-flows at list — no discount required.
- Meets the 1% rule at list price ($1k rent vs $98k).
- Recommended offer: $92k (6.0% below list) — sets the bar for market timing.
- Cap rate 6.7% vs local median 3.0% in Orlando — top-decile yield for the area; either an underpriced asset or a hidden risk that comps aren't pricing in. Stress-test before assuming the spread holds.
Location & tenants
- Location reads 86/100 on livability (#12 in FL, #360 nationally) — a professional / high-income tenant draw. Strengths: amenities A+, commute A+, housing A+.
- Orange (suburban): math 46% / reading 51% proficiency, ranked #43 of 73 in FL (top 59%) — families likely to look elsewhere, expect single-tenant / working-renter base with shorter leases.
- Market conditions: Rents soft (-0.5%/yr); 222 active listings in the ZIP; 40 comparable units currently listed for rent nearby; rentals at typical pace (median 24d on market — plan ~3-4 weeks tenant-placement turnaround); 8,053 units permitted in Orange County in 2024 (3,133 in 5+ unit buildings).
- This rent runs 36% of the median local income ($47k/yr) — at the standard rent-burdened threshold; future hikes will face affordability resistance.
Forward outlook
- Local home prices are declining (-3.0%/yr); year-one equity from $678 of loan paydown is wiped out by about $3k of value loss. Plan a longer hold.
- Orange County population projected at +52% by 2050 — long-run rental-demand tailwind backs the buy-and-hold thesis.
Negotiation context
- It's been on market 79 days — a 6% lower offer ($92k) is reasonable based on typical stale-listing flexibility.
- 2 sale attempts; this cycle's ask has dropped $9k (8%) from the opening price — seller is motivated, your offer sets the floor, not the list.
Risks & watch-outs
- Watch-outs: HOA is 29% of rent.
Questions for the listing agent
- It's been on market 79 days. Have you received any prior offers? Is the seller open to a 6% concession, seller financing, or rate buy-down credit?
- Built in 1973 — when were the roof, HVAC, electrical panel, plumbing, and water heater last replaced?
- What does the HOA fee cover, when was the last increase, and are there any pending special assessments or reserve-fund shortfalls?
- Any open or pending special assessments — roof, HVAC, plumbing, elevator, façade? What's the per-unit balance and payoff schedule, and is the seller paying it off at close or rolling it to the buyer?
- Why hasn't it sold? Are there any deal-killer items the seller is aware of (foundation, flood, title, zoning, code violations)?
- Is there a deadline driving the sale (1031 exchange, divorce, estate, relocation)? That informs how much negotiation room exists.
- Schools are B-rated — typically a magnet for longer-tenancy family renters. What's the average tenant stay here, and is there a school-zone premium baked into asking?
- The area grade is low — what's the realistic commute time and amenity access for the typical tenant pool here? Any planned neighborhood developments (good or bad) we should know about?
- What's the average days-on-market for RENTAL listings here right now (not sales)? A rising rental-DOM trend means longer vacancies and softer asking-rent achievability than the comps imply.
- What's the recent tenant-quality profile in this submarket — average credit score on applications, eviction rate, late-payment / NSF rate, and stable-employment percentage? A property-management company in the area should have these aggregated.
- How much new apartment / multifamily construction is in the pipeline within 1–3 miles? Heavy new supply (>2% of stock underway) typically softens rents 12–24 months out; light construction supports rent growth.
Investment metrics
- 1% rule
- 1.46% ✓
- Cap rate
- 6.65%
- Cash-on-cash
- 1.28%
- DSCR
- 1.06
- GRM
- 5.7
CMA / ARV
No comps found within radius.
Projected returns pro-forma
-3.0% appreciation · 0.0% rent growth · sell at horizon
- IRR
- -19.5%
- Equity multiple
- 0.35×
- Total profit
- $-17,927
- Equity at exit
- $14,612
- IRR
- -28.9%
- Equity multiple
- -0.03×
- Total profit
- $-28,266
- Equity at exit
- $8,473
Cash invested: $27,440 (down + closing). Projections, not guarantees.
Landlord ↔ Tenant lean methodology
- Overall (STATE)
- 87 Strongly Landlord-Friendly
- State Florida
- 87 Strongly Landlord-Friendly · R+3
- County
- — inherits STATE
- City
- — inherits STATE
ZIP-level market 32839
- Home prices YoY
- -20.1%
- Rents YoY
- -0.5%
- Active inventory
- 222
- Price-to-rent
- 5.7×
Monthly cashflow live
- Estimated rent
- $1,430 high interval (Pro) →
- Mortgage (P&I)
- −$514
- Tax from tax record
- −$137 /mo · $1,642/yr
- Insurance
- −$41
- HOA
- −$409
- Vacancy / Maint / Mgmt
- −$300
- Net cashflow
- $29
Break-even live
UW: 25.0% down · 7.5% · 30yr · 1.5% tax · 5.0% vac · 8.0% maint · 8.0% mgmt
Financing live
Cash to close
- Down payment
- $24,500
- Closing costs
- $2,940
- Reserves months
- —
- Total cash needed
- —
Loan-product check · same deal, 3 products live
Conventional
25% down · 7.5% · 30yr
- Down + closing
- —
- Monthly P&I
- —
- Monthly cashflow
- —
- DSCR
- —
- Eligible?
- —
Personal DTI + credit; lowest rate.
DSCR
20% down · 8.5% · 30yr
- Down + closing
- —
- Monthly P&I
- —
- Monthly cashflow
- —
- DSCR
- —
- Eligible?
- —
No personal income docs; deal must DSCR.
Hard money
10% down · 12.0% · 12mo
- Down + closing
- —
- Monthly P&I
- —
- Monthly cashflow
- —
- DSCR
- —
- Eligible?
- —
Short-term bridge; refi at stabilization.
Rent comps 40 comps
| Address | Beds | Baths | Sqft | Rent | $/sqft | DOM | Units | Dist |
|---|---|---|---|---|---|---|---|---|
| 4779 S Texas Ave Unit 4779D Orlando, FL | 2.0 | 2.0 | 976 | $1,450 | $1.49 | 2d | 1 | 0.03mi |
| 4759 S Texas Ave Unit 4759C Orlando, FL | 2.0 | 2.0 | 976 | $1,450 | $1.49 | 16d | 1 | 0.04mi |
| 4791 S Texas Ave Orlando, FL | 2.0 | 2.0 | 976 | $1,300 | $1.33 | 23d | 1 | 0.05mi |
| 4795 S Texas Ave Unit 4795A Orlando, FL | 1.0 | 1.0 | 756 | $1,200 | $1.59 | 23d | 1 | 0.06mi |
| 4733 S Texas Ave Unit 4733B Orlando, FL | 2.0 | 2.0 | 976 | $1,450 | $1.49 | 21d | 1 | 0.07mi |
| 4767 S Texas Ave Unit 4767B Orlando, FL | 2.0 | 2.0 | 976 | $1,450 | $1.49 | 13d | 1 | 0.07mi |
| 4725 S Texas Ave Apt C Orlando, FL | 2.0 | 2.0 | 976 | $1,249 | $1.28 | 23d | 1 | 0.08mi |
| 4801 S Texas Ave Unit 4801D Orlando, FL | 1.0 | 1.0 | 756 | $1,200 | $1.59 | 23d | 1 | 0.09mi |
| 4749 S Texas Ave Unit 4749C Orlando, FL | 2.0 | 2.0 | 976 | $1,450 | $1.49 | 23d | 1 | 0.09mi |
| 4807 S Texas Ave Unit 4807D Orlando, FL | 1.0 | 1.0 | 756 | $1,349 | $1.78 | 23d | 1 | 0.11mi |
| 4807 S Texas Ave Unit 4807C Orlando, FL | 1.0 | 1.0 | 756 | $1,599 | $2.12 | 23d | 1 | 0.11mi |
| 1924 Lake Atriums Cir #62 Orlando, FL | 2.0 | 2.0 | 864 | $1,450 | $1.68 | 23d | 1 | 0.12mi |
| 1916 Lake Atriums Cir Orlando, FL | 1.0 | 1.0 | 593 | $1,172 | $1.98 | 23d | 4 | 0.12mi |
| 4711 S Texas Ave Unit 4711A Orlando, FL | 2.0 | 2.0 | 976 | $1,600 | $1.64 | 23d | 1 | 0.13mi |
| 1908 Lake Atriums Cir Orlando, FL | 1.0 | 1.0 | 593 | $1,124 | $1.90 | 23d | 3 | 0.15mi |
| 1940 Lake Atriums Cir Orlando, FL | 1.0 | 1.0 | 593 | $1,225 | $2.07 | 23d | 4 | 0.16mi |
| 1902 Honour Rd Unit 1902-23 Orlando, FL | 1.0 | 1.0 | 650 | $1,200 | $1.85 | 23d | 1 | 0.16mi |
| 1902 Honour Rd Orlando, FL | 3.0 | 2.0 | 1000 | $1,750 | $1.75 | 23d | 1 | 0.16mi |
| 1916 Honour Rd #1 Orlando, FL | 1.0 | 1.0 | 650 | $1,100 | $1.69 | 23d | 1 | 0.17mi |
| 1926 Honour Rd #4 Orlando, FL | 3.0 | 1.0 | 910 | $1,500 | $1.65 | 23d | 1 | 0.17mi |
| 4703 S Texas Ave Unit A Orlando, FL | 1.0 | 1.0 | 756 | $1,200 | $1.59 | 23d | 1 | 0.18mi |
| 1972 Lake Atriums Cir Orlando, FL | 1.0–2.0 | 1.0–2.0 | 695 | $1,285 | $1.85 | 4d | 2 | 0.18mi |
| 1972 Lake Atriums Cir #181 Orlando, FL | 2.0 | 2.0 | 864 | $1,300 | $1.50 | 23d | 1 | 0.18mi |
| 1948 Lake Atriums Cir Orlando, FL | 2.0–3.0 | 2.0 | 864 | $1,450 | $1.68 | 7d | 3 | 0.19mi |
| 4789 S Texas Ave Apt A Orlando, FL | 2.0 | 2.0 | 976 | $1,500 | $1.54 | 7d | 1 | 0.19mi |
| 1964 Lake Atriums Cir Orlando, FL | 1.0 | 1.0 | 655 | $1,225 | $1.87 | 7d | 3 | 0.20mi |
| 1964 Lake Atriums Cir Orlando, FL | 1.0 | 1.0 | 526 | $1,250 | $2.38 | 10d | 2 | 0.20mi |
| 1717 Holden Ave Orlando, FL | 1.0–3.0 | 1.0–2.5 | 980 | $1,424 | $1.45 | 2d | 26 | 0.21mi |
| 1956 Lake Atriums Cir Orlando, FL | 2.0 | 2.0 | 864 | $1,425 | $1.65 | 14d | 3 | 0.21mi |
| 1956 Lake Atriums Cir Orlando, FL | 2.0 | 2.0 | 864 | $1,425 | $1.65 | 7d | 2 | 0.21mi |
| 1956 Lake Atriums Cir #144 Orlando, FL | 2.0 | 2.0 | 864 | $1,500 | $1.74 | 4d | 1 | 0.21mi |
| 5208 Via Hacienda Cir Unit 101 Orlando, FL | 2.0 | 2.0 | 1073 | $2,000 | $1.86 | 23d | 1 | 0.21mi |
| 5219 Via Hacienda Cir Unit B209 Orlando, FL | 2.0 | 2.0 | 1073 | $1,500 | $1.40 | 16d | 1 | 0.22mi |
| 5214 Via Hacienda Cir Apt 207 Orlando, FL | 2.0 | 2.0 | 1073 | $1,400 | $1.30 | 23d | 1 | 0.24mi |
| 5225 Via Hacienda Cir Unit B115 Orlando, FL | 2.0 | 2.0 | 1073 | $1,480 | $1.38 | 23d | 1 | 0.24mi |
| 5226 Via Hacienda Cir Unit A116 Orlando, FL | 2.0 | 2.0 | 934 | $1,350 | $1.45 | 23d | 1 | 0.25mi |
| 5226 Via Hacienda Cir Unit A215 Orlando, FL | 2.0 | 2.0 | 1073 | $1,550 | $1.44 | 23d | 1 | 0.25mi |
| 5226 Via Hacienda Cir Unit A313 Orlando, FL | 2.0 | 2.0 | 934 | $1,400 | $1.50 | 2d | 1 | 0.25mi |
| 2201 Metropolitan Way Orlando, FL | 2.0 | 2.0 | 874 | $1,475 | $1.69 | 3d | 1 | 0.25mi |
| 4746 Rio Grande Ave Orlando, FL | 1.0–3.0 | 1.0–2.0 | 920 | $1,574 | $1.71 | 2d | 40 | 0.27mi |
HOA detail condo
- Monthly dues
- $409 · $4,908/yr
- Assessments
- None detected in remarks — confirm with the listing agent.
Listing history 21 events
-
2026-06-07remarks 335-char remark
-
2026-06-07statusdays on market $98,000 Pending 79 DOM
-
2026-06-04days on market $98,000 Active 78 DOM
-
2026-06-03days on market $98,000 Active 77 DOM
-
2026-06-02days on market $98,000 Active 76 DOM
-
2026-06-02days on market $98,000 Active 75 DOM
-
2026-05-31days on market $98,000 Active 74 DOM
-
2026-05-21price $98,000
-
2026-04-24price $106,000
-
2026-03-18$107,000 Active
-
2026-02-05historical
-
2026-02-02price $115,000
-
2026-01-21price $119,900
-
2025-11-25price $129,900
-
2025-10-14price $149,000
-
2025-08-19$155,000 Active
-
2021-12-15soldstatus $103,000
-
2019-03-25soldstatus $69,900
-
2018-11-20soldstatus $45,000
-
2011-09-16soldstatus $49,900
-
2011-09-07soldstatus $760,000
ⓘ Source: listings_history table (triggers on properties + properties_extension) + one-shot
backfill from property_details.listing_events for pre-trigger history.
Tax reassessment forecast FL · Resets to sale price
- Current annual tax
- $1,642 · $137/mo
- Projected year-2 tax
- $1,642 · $137/mo
- Expected delta
- $0/yr ($0/mo · -0.0%)
ⓘ Screening estimate from a state-policy table — verify with the county assessor before closing.
Nearby sold comps map
Loading sold comps map…
Walkable amenities ~0.75 mi
Loading nearby amenities…
Taxation est. · year 1
- Rental income
- $17,162
- − Mortgage interest
- −$5,490
- − Property taxes
- −$1,642
- − Insurance
- −$490
- − Repairs & maintenance
- −$1,373
- − Management
- −$1,373
- − HOA
- −$4,908
- − Depreciation
- −$2,851
- Taxable loss
- −$964
- Est. tax savings @ 24.0%
- +$231
- After-tax cash flow
- $582/yr
For passive investors: Depreciation is non-cash, so a rental often shows a tax loss while cash-flowing — sheltering income. Rental losses are passive: they offset passive income freely, and up to $25,000/yr can offset ordinary (W-2) income if you actively participate and your MAGI is under $100k (phasing out to $0 by $150k); unused losses carry forward. On sale, claimed depreciation is recaptured at up to 25%, and gains may owe capital-gains tax (a 1031 exchange can defer both). Figures are a year-1 estimate at your 24.0% rate — not tax advice; consult a CPA.
Schools (NCES district)
- District
- Orange
- NCES district ID
- 1201440
- Math proficiency
- 46% ▼ -9.00%
- Reading proficiency
- 51% ▼ -2.00%
- Median HH income
- $49,350
- Composite
- 41.47/100
- National rank
- #3461
- State rank
- #43 of 73 in FL
Livability — Orlando
- Score
- 86/100
- State rank
- #12
- US rank
- #360
Category grades
Schools grade is shown separately in the Schools card above.
Census & demographics
- County
- Orange County · 1,471,359 people
- City population
- 964,969
- Metro
- Orlando-Kissimmee-Sanford, FL
- Population (ZIP)
- 53,242
- Household income
- $47,313
- Rent vs Own
- Severe rent burden
- 5337.0
Population outlook (Orange County) Hauer SSP2
- Today (2025)
- 1,618,226 people
- By 2030
- 1,787,404 · +10.5%
- By 2040
- 2,125,621 · +31.4%
- By 2050
- 2,454,016 · +51.6%
- By 2075
- 3,173,711 · +96.1%
- By 2100
- 3,607,781 · +122.9%
Race, ethnicity, and origin ACS 2023
- Neighborhood character
- Diverse neighborhood (Simpson 0.69)
- Race & ethnicity
- Hispanic / Latino 39% Black 35% Two or more races 17% White 16% Asian 4%
- Hispanic origin (detail)
- Mexican 5% Puerto Rican 14% Cuban 2% Dominican 3%
- Common ancestry
- Hispanic 8% Estonian 1% Lithuanian 1%
- Foreign-born
- 30% · Canada, Jamaica, Vietnam
- Languages at home
- 51% English-only · Spanish 33% French/Haitian/Cajun 9% Other Indo-European 2%
Political lean MEDSL · Orange
- 2024 margin
- D (+13.6) · D 56.1% · R 42.5% · Other 1.3%
- 2008→2024 swing
- -5.0pp toward R · 2008: 18.6pp · 2024: 13.6pp
- All cycles
- 2024: D+13.6 2020: D+23.1 2016: D+24.6 2012: D+18.2 2008: D+18.6
Not yet ingested
- Civics
- —
Market trends
- HPI YoY
- ▼ -89.65%
- Current HPI
- 357.4828
- Rent YoY
- ▼ -0.50%
- Metro
- Orlando-Kissimmee-Sanford, FL
- State GDP YoY
- ▲ 3.28%
- F500 in state
- 36
Industry mix (Fortune 500 HQ in FL)
| Industry | F500 HQs | Revenue |
|---|---|---|
| Industrial Technology | 2 | $29B |
|
||
| Insurance | 2 | $17B |
|
||
| Retail | 1 | $60B |
|
||
| Technology Distribution | 1 | $58B |
|
||
| Homebuilding | 1 | $35B |
|
||
| Technology Manufacturing | 1 | $35B |
|
||
Price history
-87.1% since first listed14 events — show timeline
- 2026-05-21 Price Changed $98,000 Stellar MLS as Distributed by MLS Grid
- 2026-04-24 Price Changed $106,000 Stellar MLS as Distributed by MLS Grid
- 2026-03-18 Listed $107,000 Stellar MLS as Distributed by MLS Grid
- 2026-02-05 Listing Removed — FORTMLS
- 2026-02-02 Price Changed $115,000 FORTMLS
- 2026-01-21 Price Changed $119,900 FORTMLS
- 2025-11-25 Price Changed $129,900 FORTMLS
- 2025-10-14 Price Changed $149,000 FORTMLS
- 2025-08-19 Listed $155,000 FORTMLS
- 2021-12-15 Sold (Public Records) $103,000 Public Records
- 2019-03-25 Sold (Public Records) $69,900 Public Records
- 2018-11-20 Sold (Public Records) $45,000 Public Records
- 2011-09-16 Sold (Public Records) $49,900 Public Records
- 2011-09-07 Sold (Public Records) $760,000 Public Records
Property tax history
+5.7%/yrLatest (2025): $1,642 · +8.0% YoY. Source: county tax records.
Cash-flow waterfall
monthlySold comps — $/sqft
last 12 mo · ≤1 miLoading sold comps…