 Duplex
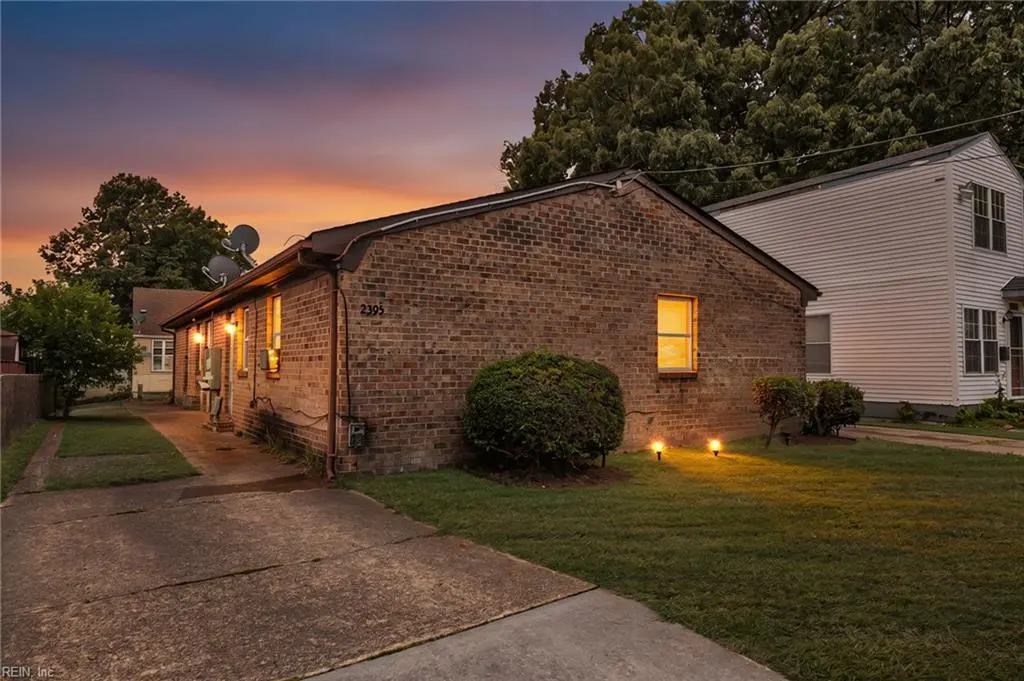
2305 Palmyra St · Norfolk, VA
Flood risk 1/10 · Minimal
- FEMA flood zone
- X (unshaded)
- Chance of flooding over 30 yrs
- 0.0%
- Est. flood insurance / yr
- $507 – $1,088
Fire risk 1/10 · Minimal
- Est. fire insurance / yr
- $666 – $1,236
Heat risk 9/10 · Severe
- Hot days now (above 105°F)
- 7 days/yr
- Hot days in 30 yrs
- 16 days/yr
Wind risk 8/10 · Major
- Chance of severe wind over 30 yrs
- 80.0%
Air-quality risk 3/10 · Minor
- Unhealthy air days now
- 2 days/yr
- Unhealthy air days in 30 yrs
- 3 days/yr
Risk factors via First Street. Map © Google.
Why this score? — see what drove the D- grade
The composite is a weighted blend of 9 inputs, each scored 0–100. Each bar is that input's sub-score; the figure is the points it added to the 100-point composite (weight × sub-score).
- Cash flow +13.0/30.0
- Livability +4.2/5.0
- DSCR +3.9/10.0
- Condition / age +3.8/5.0
- 1% rule +3.7/10.0
- Schools +3.5/10.0
- Rent growth +3.4/5.0
- ARV discount +1.3/15.0
- Appreciation +0.0/10.0
$312,500
🖨 Deal sheet (PDF) 📄 Offer letter ✓ Due diligence
Multi-family units
County records classify this as Multi-Family (2-4 Unit). Listing-text estimate: 2 units. confirmed
Listing remarks
Wonderful opportunity for Owner Occupants and Investors alike! This all brick, side-by-side, slab style duplex is located in Central Norfolk. Each unit is a mirror image of each other, offering a spacious living area, along with an eat-in kitchen with laundry hookups. Each unit has two spacious bedrooms with ample closet space, along with a common hall bath. Enjoy the peace of mind with an upgraded roof and vinyl replacement windows. Seperate private driveways for each unit. Cash flow from day one with unit A rented at $1,400.00/month till 5/31/2027. Unit B is offered vacant, allowing opportunity for an owner-occupant, or investor to fill and see their investment pay off. Seize the opportun
Key facts
- Built 1983
- Listed 5 days
Property features AI
Finance
- Financial info: Unit 1 current rent: $1,400; Unit 1 lease expires 05/31/2027 (year lease); Unit 2 is vacant
Exterior
- Parking: Driveway; Off-street parking
- Utilities: Separate meters for all units; City/County water; City/County sewer; Electric water heater
- Home design: Duplex, side-by-side configuration; Slab foundation; Simple ownership
- Construction: Asphalt shingle roof
- Exterior features: Brick siding; Patio; Chain link, partial, and privacy fencing
Interior
- Kitchen: Electric range; Refrigerator; Pantry (units include pantry)
- Bedrooms: Unit 1: 2 bedrooms (1st-floor master); Unit 2: 2 bedrooms (1st-floor master)
- Flooring: Carpet; Ceramic
- Bathrooms: Unit 1: 1 bathroom; Unit 2: 1 bathroom
- Heating & cooling: Baseboard heating; Window/wall air conditioning
- Interior features: Window treatments; Ceiling fan
- Laundry & utility: Washer hookup (each unit); Dryer hookup (each unit)
Neighborhood map
What this means for you Summary
Snapshot
- This is a 2 × 2-bed/1.0-bath units multifamily listed at $312k. Condition is rated good.
Deal economics
- At list price, monthly cash flow is $-20 ($-234/yr) — negative. Per door: $-10/mo.
- To cash-flow at today's rent, offer at most $310k (0.9% below list).
- To meet the 1% rule (rent ≥ 1% of price), the offer needs to be $271k (13.3% below list).
- Recommended offer: $271k (13.3% below list) — sets the bar for 1% rule.
- Cap rate 6.2% vs local median 4.0% in Norfolk — top-decile yield for the area; either an underpriced asset or a hidden risk that comps aren't pricing in. Stress-test before assuming the spread holds.
Location & tenants
- Location reads 83/100 on livability (#43 in VA, #1,026 nationally) — a professional / high-income tenant draw. Strengths: amenities A+, commute A+, health & safety A+; Watch: employment C-, crime F.
- Norfolk City Public School District (urban): math 27% / reading 56% proficiency, ranked #118 of 131 in VA (top 90%) — families likely to look elsewhere, expect single-tenant / working-renter base with shorter leases.
- Zoned schools: Coleman Place Elementary (math 13% / reading 38%, grade F, #1,046 of 1,108 statewide, top 95%, 617 students, 98% FRL); Norview Middle (math 19% / reading 54%, grade F, #320 of 342 statewide, top 95%, 1,259 students, 89% FRL); Booker T Washington High (math 26% / reading 70%, grade D, #303 of 319 statewide, top 95%, 947 students, 94% FRL) — zoned schools average 94% FRL vs 59% district-wide (35 pts higher); higher-poverty schools than district average — tighter screening recommended.
- Market conditions: Rents rising (+3.4%/yr); 135 active listings in the ZIP; 26 comparable units currently listed for rent nearby; rentals at typical pace (median 26d on market — plan ~3-4 weeks tenant-placement turnaround); 438 units permitted in Norfolk city in 2024 (273 in 5+ unit buildings).
- At $2,709/mo this rent would consume 48% of the median local household income ($68k/yr) (locally 1342% of renters already pay >50% of income on rent) — very limited rent-growth headroom before tenants either downsize or default.
Forward outlook
- Local home prices are declining (-3.0%/yr); year-one equity from $2k of loan paydown is wiped out by about $9k of value loss. Plan a longer hold.
Negotiation context
- Only 5 days on market — expect competitive offers; lowballing is unlikely to land.
Risks & watch-outs
- Climate carrying-cost: severe wind risk, 80% chance of damaging wind over 30y; extreme-heat days projected 7→16/yr by 2055 (HVAC capex compounding) — expect insurance premiums to compound above CPI over the hold.
Questions for the listing agent
- What do current leases actually rent for vs. the listed asking? Can we see a recent rent roll and the last 12 months of T-12 income?
- Can we see the unit-by-unit rent roll, current vacancy, and any below-market leases? What's the average tenancy length?
- What capital expenditures (roof, boiler, parking lot, exteriors) have been made in the last 5 years, and what's planned in the next 2?
- Is there a deadline driving the sale (1031 exchange, divorce, estate, relocation)? That informs how much negotiation room exists.
- Schools are A-rated — typically a magnet for longer-tenancy family renters. What's the average tenant stay here, and is there a school-zone premium baked into asking?
- Crime grade is F in this area — have there been break-ins, vandalism, or insurance claims at this property in the last 3 years? What carrier currently insures it and at what premium?
- The area grade is low — what's the realistic commute time and amenity access for the typical tenant pool here? Any planned neighborhood developments (good or bad) we should know about?
- What's the average days-on-market for RENTAL listings here right now (not sales)? A rising rental-DOM trend means longer vacancies and softer asking-rent achievability than the comps imply.
- What's the recent tenant-quality profile in this submarket — average credit score on applications, eviction rate, late-payment / NSF rate, and stable-employment percentage? A property-management company in the area should have these aggregated.
- How much new apartment / multifamily construction is in the pipeline within 1–3 miles? Heavy new supply (>2% of stock underway) typically softens rents 12–24 months out; light construction supports rent growth.
Investment metrics
- 1% rule
- 0.87% ✗
- Cap rate
- 6.22%
- Cash-on-cash
- -0.27%
- DSCR
- 0.99
- GRM
- 9.6
CMA / ARV
- ARV (on-the-fly)
- $274,512
- Comps found
- 7
Show comp detail 7 sales within ~0.75 mi
| Address | Dist | Beds/Ba | Sqft | Sold | Price | $/sf | Match |
|---|---|---|---|---|---|---|---|
| 1557 Hemlock St | 0.11mi | 4/2.0 | 1,590 (-0%) | 10mo | $295,000 | $186 | 86 |
| 1553 Hemlock St | 0.12mi | 4/2.0 | 1,590 (-0%) | 10mo | $295,000 | $186 | 85 |
| 1552 Birch St | 0.19mi | 4/2.0 | 1,600 (+0%) | 8mo | $260,000 | $163 | 84 |
| 1523 Rush St | 0.14mi | 4/2.0 | 1,508 (-6%) | 5mo | $260,000 | $172 | 80 |
| 3702 Cape Henry Ave | 0.17mi | 4/2.0 | 1,450 (-9%) | 1mo | $300,000 | $207 | 76 |
| 2517 Nevada Ave | 0.34mi | 4/2.0 | 1,624 (+2%) | 12mo | $275,000 | $169 | 71 |
| 4669 Kincaid Ave | 0.46mi | 4/1.0 | 1,600 (+0%) | 9mo | $228,000 | $143 | 67 |
Match score weights: distance 35% · size 25% · config 20% · recency 20%. Top-matched comps best support the ARV.
Projected returns pro-forma
-3.0% appreciation · 3.42% rent growth · sell at horizon
- IRR
- -16.3%
- Equity multiple
- 0.42×
- Total profit
- $-50,690
- Equity at exit
- $46,595
- IRR
- -7.2%
- Equity multiple
- 0.53×
- Total profit
- $-40,816
- Equity at exit
- $27,019
Cash invested: $87,500 (down + closing). Projections, not guarantees.
Landlord ↔ Tenant lean methodology
- Overall (STATE)
- 55 Moderately Landlord-Leaning
- State Virginia
- 55 Moderately Landlord-Leaning · D+2
- County
- — inherits STATE
- City
- — inherits STATE
ZIP-level market 23513
- Home prices YoY
- -9.3%
- Rents YoY
- 3.4%
- Active inventory
- 135
- Price-to-rent
- 19.2×
Monthly cashflow live
- Estimated rent
- $2,709 high interval (Pro) →
- Mortgage (P&I)
- −$1,639
- Tax est. 1.5%
- −$391 /mo · $4,688/yr
- Insurance
- −$130
- HOA
- −$0
- Vacancy / Maint / Mgmt
- −$569
- Net cashflow
- $-20
Break-even live
Sensitivity live
| Price | -10% $196 | -5% $88 | +0% $-20 | +5% $-127 | +10% $-235 |
|---|---|---|---|---|---|
| Rent | -10% $-234 | -5% $-127 | +0% $-20 | +5% $87 | +10% $195 |
| Rate | -1.0pp $138 | -0.5pp $60 | base $-20 | +0.5pp $-100 | +1.0pp $-183 |
2-unit breakdown (identical units grouped — click to expand)
| Units | Beds | Baths | Est. rent |
|---|---|---|---|
| 2× units | 2 | 1 | $2,710 |
| #1 | 2 | 1 | $1,355 |
| #2 | 2 | 1 | $1,355 |
| Total (2 units) | $2,709 | ||
UW: 25.0% down · 7.5% · 30yr · 1.5% tax · 5.0% vac · 8.0% maint · 8.0% mgmt
Financing live
Cash to close
- Down payment
- $78,125
- Closing costs
- $9,375
- Reserves months
- —
- Total cash needed
- —
Loan-product check · same deal, 3 products live
Conventional
25% down · 7.5% · 30yr
- Down + closing
- —
- Monthly P&I
- —
- Monthly cashflow
- —
- DSCR
- —
- Eligible?
- —
Personal DTI + credit; lowest rate.
DSCR
20% down · 8.5% · 30yr
- Down + closing
- —
- Monthly P&I
- —
- Monthly cashflow
- —
- DSCR
- —
- Eligible?
- —
No personal income docs; deal must DSCR.
Hard money
10% down · 12.0% · 12mo
- Down + closing
- —
- Monthly P&I
- —
- Monthly cashflow
- —
- DSCR
- —
- Eligible?
- —
Short-term bridge; refi at stabilization.
Rent comps 26 comps
| Address | Beds | Baths | Sqft | Rent | $/sqft | DOM | Units | Dist |
|---|---|---|---|---|---|---|---|---|
| 1531 Spruce St Unit B Norfolk, VA | 3.0 | 2.0 | 1304 | $1,600 | $1.23 | 45d | 1 | 0.21mi |
| 1531 Spruce St Unit B Norfolk, VA | 3.0 | 2.0 | 1304 | $1,600 | $1.23 | 25d | 1 | 0.21mi |
| 1562 Norcova Ave Norfolk, VA | 3.0 | 1.0 | 1288 | $2,000 | $1.55 | 19d | 1 | 0.62mi |
| 3477 E Bonner Dr Norfolk, VA | 3.0 | 1.0 | 1304 | $2,000 | $1.53 | 25d | 1 | 0.74mi |
| 2531 Vincent Ave Norfolk, VA | 3.0 | 2.0 | 1600 | $2,195 | $1.37 | 45d | 1 | 0.76mi |
| 4563 Shoshone Ct Norfolk, VA | 3.0 | 2.0 | 1600 | $2,500 | $1.56 | 45d | 1 | 0.76mi |
| 1323 W Norcova Dr Norfolk, VA | 3.0 | 1.0 | 1410 | $2,500 | $1.77 | 45d | 1 | 0.79mi |
| 2640 Azalea Garden Rd Norfolk, VA | 3.0 | 1.5 | 1100 | $2,150 | $1.95 | 5d | 1 | 0.82mi |
| 3640 Robin Hood Rd Norfolk, VA | 4.0 | 2.5 | 1400 | $2,999 | $2.14 | 19d | 1 | 0.86mi |
| 3653 Nottaway St Norfolk, VA | 3.0 | 1.5 | 1564 | $2,200 | $1.41 | 19d | 1 | 0.86mi |
| 2815 Keller Ave Norfolk, VA | 3.0 | 2.0 | 1210 | $2,250 | $1.86 | 5d | 1 | 0.90mi |
| 3126 Marne Ave Norfolk, VA | 5.0 | 2.0 | 1943 | $3,000 | $1.54 | 45d | 1 | 1.01mi |
| 3504 Chesapeake Blvd Norfolk, VA | 3.0 | 2.0 | 1624 | $1,995 | $1.23 | 25d | 1 | 1.02mi |
| 3504 Chesapeake Blvd Norfolk, VA | 3.0 | 2.0 | 1624 | $1,995 | $1.23 | 45d | 1 | 1.02mi |
| 1320 Gabriel Dr Norfolk, VA | 4.0 | 1.5 | 1812 | $2,495 | $1.38 | 45d | 1 | 1.08mi |
| 3541 Chesapeake Blvd Norfolk, VA | 5.0 | 1.0 | 1476 | $1,275 | $0.86 | 9d | 1 | 1.11mi |
| 2660 Chesapeake Blvd Norfolk, VA | 3.0 | 2.0 | 1375 | $2,100 | $1.53 | 19d | 1 | 1.13mi |
| 1225 River Oaks Dr Norfolk, VA | 3.0 | 1.5 | 1529 | $1,335 | $0.87 | 25d | 1 | 1.17mi |
| 2914 Peronne Ave Norfolk, VA | 4.0 | 2.0 | 1764 | $2,495 | $1.41 | 25d | 1 | 1.24mi |
| 3521 Brest Ave Norfolk, VA | 3.0 | 2.0 | 1234 | $2,300 | $1.86 | 45d | 1 | 1.37mi |
| 2605 Bapaume Ave Norfolk, VA | 3.0 | 2.0 | 2004 | $2,295 | $1.15 | 45d | 1 | 1.37mi |
| 2201 Pershing Ave Norfolk, VA | 3.0 | 2.5 | 1455 | $2,250 | $1.55 | 5d | 1 | 1.39mi |
| 3301 Vimy Ridge Ave Norfolk, VA | 4.0 | 2.0 | 1300 | $2,150 | $1.65 | 5d | 1 | 1.46mi |
| 2729 Somme Ave Norfolk, VA | 3.0 | 2.5 | 1524 | $2,295 | $1.51 | 16d | 1 | 1.47mi |
| 3819 Pamlico Cir Norfolk, VA | 3.0 | 1.0 | 1250 | $2,000 | $1.60 | 14d | 1 | 1.48mi |
| 1544 Kilmer Ln Norfolk, VA | 4.0 | 2.0 | 1874 | $2,495 | $1.33 | 12d | 1 | 1.49mi |
Listing history 4 events
-
2026-06-21days on market $312,500 Active 5 DOM
-
2026-06-18days on market $312,500 Active 2 DOM
-
2026-06-16remarks 699-char remark
-
2026-06-16$312,500 Active 1 DOM
ⓘ Source: listings_history table (triggers on properties + properties_extension) + one-shot
backfill from property_details.listing_events for pre-trigger history.
Climate risk First Street
- Flood 1/10 Low FEMA zone X (unshaded) · 0% chance over 30 yrs
- Wildfire 1/10 Low
- Heat 9/10 Extreme 7 d/yr ≥105°F today · 16 d/yr by 30 yrs out
- Wind 8/10 Severe 80% chance of damaging wind over 30 yrs
- Air quality 3/10 Moderate 2 unhealthy d/yr today · 3 by 30 yrs out
Nearby sold comps map
Loading sold comps map…
Walkable amenities ~0.75 mi
Loading nearby amenities…
Taxation est. · year 1
- Rental income
- $32,508
- − Mortgage interest
- −$17,505
- − Property taxes
- −$4,688
- − Insurance
- −$1,562
- − Repairs & maintenance
- −$2,601
- − Management
- −$2,601
- − Depreciation
- −$9,091
- Taxable loss
- −$5,539
- Est. tax savings @ 24.0%
- +$1,329
- After-tax cash flow
- $1,095/yr
For passive investors: Depreciation is non-cash, so a rental often shows a tax loss while cash-flowing — sheltering income. Rental losses are passive: they offset passive income freely, and up to $25,000/yr can offset ordinary (W-2) income if you actively participate and your MAGI is under $100k (phasing out to $0 by $150k); unused losses carry forward. On sale, claimed depreciation is recaptured at up to 25%, and gains may owe capital-gains tax (a 1031 exchange can defer both). Figures are a year-1 estimate at your 24.0% rate — not tax advice; consult a CPA.
Condition & rehab AI · 12 photos
This well-maintained, two-unit duplex offers a good investment opportunity with minor cosmetic updates needed to enhance its resale and rental value.
Repairs flagged
- Minor kitchen cabinets — Aesthetic update needed.
- Minor bathroom fixtures — Update needed for dated appearance.
- Minor landscaping — Improve curb appeal with some updates.
Value-add opportunities
- Both Paint interior walls — Fresh paint enhances curb appeal and interior aesthetics.
- Both Replace countertops — Modern countertops improve functionality and aesthetics.
- Both Update bathroom fixtures — New fixtures enhance functionality and aesthetics.
- Both Improve landscaping — Enhances curb appeal and adds value to the property.
Renovation cost estimate screening
| Repair item | Severity | Est. cost |
|---|---|---|
| kitchen cabinets · Aesthetic update needed. | Minor | $500–3,000 |
| bathroom fixtures · Update needed for dated appearance. | Minor | $500–3,000 |
| landscaping · Improve curb appeal with some updates. | Minor | $500–3,000 |
| Total estimated repair cost · 3 items | $1,500–9,000 |
Value-add ROI direction
- Both Paint interior walls — Fresh paint enhances curb appeal and interior aesthetics. ↑
- Both Replace countertops — Modern countertops improve functionality and aesthetics. ↑
- Both Update bathroom fixtures — New fixtures enhance functionality and aesthetics. ↑
- Both Improve landscaping — Enhances curb appeal and adds value to the property. ↑
ⓘ Cost ranges are severity-bucket heuristics (US national rule-of-thumb). Get contractor quotes + a written scope before underwriting a rehab budget.
Schools (NCES district)
- District
- Norfolk City Public School District
- NCES district ID
- 5102670
- Math proficiency
- 27% ▼ -44.00%
- Reading proficiency
- 56% ▼ -10.00%
- Median HH income
- $44,358
- Composite
- 35.08/100
- National rank
- #5026
- State rank
- #118 of 131 in VA
Livability — Norfolk
- Score
- 83/100
- State rank
- #43
- US rank
- #1026
Category grades
Schools grade is shown separately in the Schools card above.
Census & demographics
- Census place
- Norfolk, VA
- County
- Norfolk City · 214,042 people
- City population
- 214,042
- Metro
- Virginia Beach-Norfolk-Newport News, VA-NC
- Population (ZIP)
- 28,628
- Household income
- $68,380
- Rent vs Own
- Severe rent burden
- 1342.0
Population outlook (Norfolk County) Hauer SSP2
- Today (2025)
- 249,032 people
- By 2030
- 252,347 · +1.3%
- By 2040
- 253,644 · +1.9%
- By 2050
- 251,913 · +1.2%
- By 2075
- 245,281 · -1.5%
- By 2100
- 219,548 · -11.8%
Race, ethnicity, and origin ACS 2023
- Neighborhood character
- Diverse neighborhood (Simpson 0.63)
- Race & ethnicity
- Black 55% White 23% Hispanic / Latino 11% Two or more races 7% Asian 5%
- Hispanic origin (detail)
- Mexican 4% Puerto Rican 3%
- Common ancestry
- Romanian 1% Slovak 1% Lithuanian 0%
- Foreign-born
- 10% · Canada
- Languages at home
- 87% English-only · Spanish 6% Tagalog/Filipino 4% French/Haitian/Cajun 1%
Political lean MEDSL · Norfolk
- 2024 margin
- Solid D (+41.5) · D 70.0% · R 28.5% · Other 1.6%
- 2008→2024 swing
- -1.4pp toward R · 2008: 43.0pp · 2024: 41.5pp
- All cycles
- 2024: D+41.5 2020: D+45.6 2016: D+42.0 2012: D+44.0 2008: D+43.0
Not yet ingested
- Civics
- —
Market trends
- HPI YoY
- ▼ -33.67%
- Current HPI
- 329.2241
- Rent YoY
- ▲ 3.42%
- Metro
- Virginia Beach-Norfolk-Newport News, VA-NC
- State GDP YoY
- ▲ 2.40%
- F500 in state
- 50
Industry mix (Fortune 500 HQ in VA)
| Industry | F500 HQs | Revenue |
|---|---|---|
| Aerospace / Defense | 4 | $236B |
|
||
| Technology / Defense | 3 | $32B |
|
||
| Financial Services | 2 | $176B |
|
||
| Utilities | 2 | $27B |
|
||
| Insurance | 2 | $25B |
|
||
| Technology | 2 | $15B |
|
||
Price history
1 event — show timeline
- 2026-06-16 Listed $312,500 REINMLS
Cash-flow waterfall
monthlySold comps — $/sqft
last 12 mo · ≤1 miLoading sold comps…