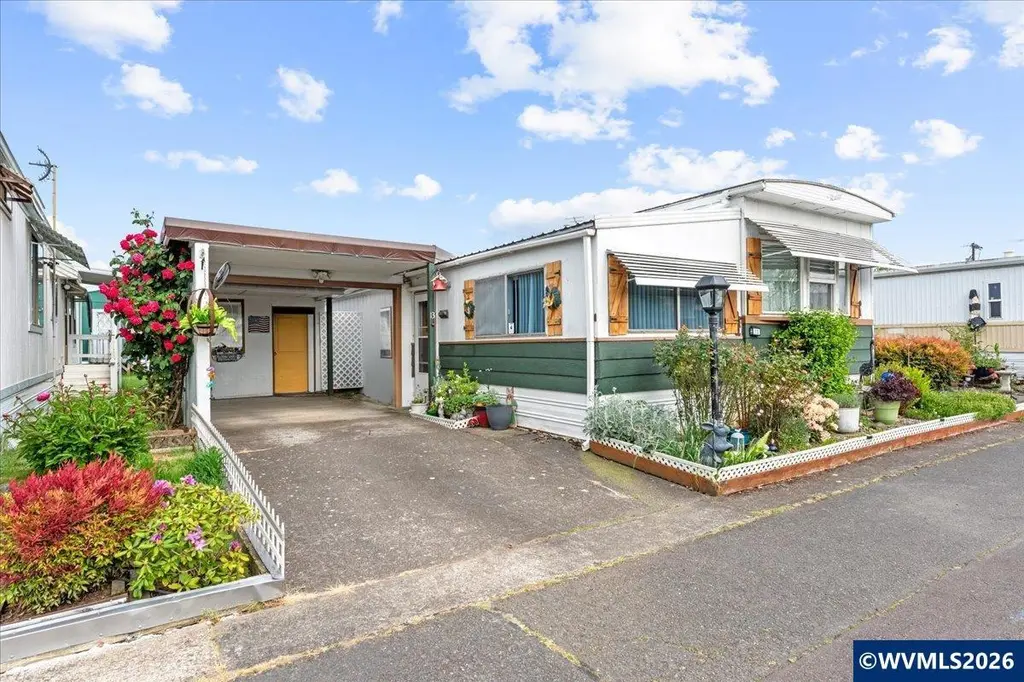
612 N Cascade Dr #13 · Woodburn, OR
Flood risk 1/10 · Minimal
- FEMA flood zone
- X (unshaded)
- Chance of flooding over 30 yrs
- 0.0%
- Est. flood insurance / yr
- $507 – $1,088
Fire risk 3/10 · Minor
- Est. fire insurance / yr
- $498 – $926
Heat risk 3/10 · Minor
- Hot days now (above 92°F)
- 7 days/yr
- Hot days in 30 yrs
- 14 days/yr
Wind risk 1/10 · Minimal
- Chance of severe wind over 30 yrs
- —
Air-quality risk 10/10 · Severe
- Unhealthy air days now
- 14 days/yr
- Unhealthy air days in 30 yrs
- 14 days/yr
Risk factors via First Street. Map © Google.
Why this score? — see what drove the C+ grade
The composite is a weighted blend of 9 inputs, each scored 0–100. Each bar is that input's sub-score; the figure is the points it added to the 100-point composite (weight × sub-score).
- Cash flow +30.0/30.0
- 1% rule +10.0/10.0
- DSCR +10.0/10.0
- Livability +3.7/5.0
- Rent growth +3.2/5.0
- Schools +2.5/10.0
- Condition / age +2.5/5.0
- ARV discount +0.0/15.0
- Appreciation +0.0/10.0
$62,500
🖨 Deal sheet 📄 Offer letter ✓ Due diligence
Listing remarks
Welcome to this spacious 2bed/2ba Marlette located in Driftwood Mobile Home Park in Woodburn with convenient access to amenities. This well-maintained home features A/C, custom interior storage plus a beautiful built-in in the dining room, newer interior paint, a new W/ D and new stove as well as updated lighting throughout. The kitchen has a custom cold cupboard and all appliances, including the portable dishwasher, stay with the home making move-in day easy!
Key facts
- Portable dishwasher
- Custom cold cupboard
- Built-in dining room
Tags
Property features AI
Finance
- Other: No home warranty; No assessments/liens reported; Inclusions: wardrobe/vanity, portable dishwasher, storage shelves; Exclusions: personal property and potted plants; Possession: after COE
- HOA & community: Located in Driftwood Mobile Home Park (adult park); Affordable space rent
Exterior
- Parking: Carport with front-door access; 2 garage spaces
- Utilities: City water; City sewer; Electric water heater
- Home design: Single-wide mobile home; Front door under carport; Exterior painted white; Adult park placement (Driftwood MHP)
- Construction: Built in 1971; T111 siding; Pier foundation; Metal or aluminum roof; Marlette manufactured home (Serial H12265FB3TW)
- Exterior features: Fully fenced yard; Patio; Landscaped with native plants and trees; Custom shutters; Large shed with electrical; Additional garden shed; Outbuilding(s) and storage shelves
Interior
- Kitchen: Electric range (built-in) with microwave included; Dishwasher (portable included); Cold cupboard; All appliances stay with the home
- Bedrooms: Primary bedroom on the main level; Second bedroom on the main level
- Flooring: Vinyl flooring
- Bathrooms: Two bathrooms on the main level
- Heating & cooling: Electric heating; Hot water heating; Central air conditioning
- Interior features: High-speed internet access available; Custom interior storage; Built-in dining room feature; Indoor flex room at the front of the home; Large pantry off the kitchen; Disposal
- Laundry & utility: New washer and dryer; Utility room on the main level
Neighborhood map
What this means for you Summary
Snapshot
- This is a 2-bed/2.0-bath manufactured listed at $62k.
Deal economics
- At list price, monthly cash flow is $885 ($11k/yr) — positive.
- The deal already cash-flows at list — no discount required.
- Meets the 1% rule at list price ($2k rent vs $62k).
- Cap rate 23.3% vs local median 3.1% in Woodburn — top-decile yield for the area; either an underpriced asset or a hidden risk that comps aren't pricing in. Stress-test before assuming the spread holds.
Location & tenants
- Location reads 74/100 on livability (#91 in OR, #4,490 nationally) — a middle-class / working-renter tenant base. Strengths: housing A+, health & safety A+, cost of living B; Watch: crime D+, commute D, amenities F.
- Woodburn SD 103 (town): math 20% / reading 31% proficiency, ranked #169 of 183 in OR (top 92%) — low school quality limits family demand, transient renter base, plan for 1-2y turnover; 71% free/reduced lunch — lower-income household profile, screen leases tightly.
- Zoned schools: Nellie Muir Elementary School (435 students, 72% FRL); Woodburn Success (79 students, 68% FRL) — zoned schools at 70% FRL track the district average.
- Market conditions: Rents rising (+2.9%/yr); 306 active listings in the ZIP; 17 comparable units currently listed for rent nearby; rentals leasing fast (median 14d on market — plan ~1-2 weeks tenant-placement turnaround); 1,591 units permitted in Marion County in 2024 (716 in 5+ unit buildings).
Forward outlook
- Local home prices are declining (-3.0%/yr); year-one equity from $432 of loan paydown is wiped out by about $2k of value loss. Plan a longer hold.
- Marion County population projected at +17% by 2050 — long-run rental-demand tailwind backs the buy-and-hold thesis.
- At projected returns (-3.0% appreciation + 2.9% rent growth), your $18k cash investment doubles in ~2 years — after that, you're playing with house money.
Negotiation context
- Only 7 days on market — expect competitive offers; lowballing is unlikely to land.
- 2 sale attempts with the ask held roughly flat each time — persistent listings suggest the price (not the market) is what's stuck; bring a comps-based counter.
Questions for the listing agent
- Built in 1971 — when were the roof, HVAC, electrical panel, plumbing, and water heater last replaced?
- Is there a deadline driving the sale (1031 exchange, divorce, estate, relocation)? That informs how much negotiation room exists.
- Schools are D-rated, which usually means shorter tenancies and higher turnover. Who's the typical renter profile here, and what's been the actual vacancy rate?
- Crime grade is D in this area — have there been break-ins, vandalism, or insurance claims at this property in the last 3 years? What carrier currently insures it and at what premium?
- What's the average days-on-market for RENTAL listings here right now (not sales)? A rising rental-DOM trend means longer vacancies and softer asking-rent achievability than the comps imply.
- What's the recent tenant-quality profile in this submarket — average credit score on applications, eviction rate, late-payment / NSF rate, and stable-employment percentage? A property-management company in the area should have these aggregated.
- How much new for-sale + rental construction is in the pipeline within 1–3 miles? Heavy new supply typically softens prices + rents 12–24 months out; constrained supply supports both.
Investment metrics
- 1% rule
- 2.55% ✓
- Cap rate
- 23.29%
- Cash-on-cash
- 60.69%
- DSCR
- 3.70
- GRM
- 3.3
CMA / ARV
- ARV (on-the-fly)
- $45,714
- Comps found
- 2
Show comp detail 2 sales within ~0.75 mi
| Address | Dist | Beds/Ba | Sqft | Sold | Price | $/sf | Match |
|---|---|---|---|---|---|---|---|
| 612 N Cascade Dr #19 | 0.00mi | 2/1.0 | 800 (-0%) | 1mo | $40,000 | $50 | 95 |
| 612 N Cascade Dr #10 | 0.00mi | 2/1.0 | 784 (-2%) | 17mo | $45,000 | $57 | 78 |
Match score weights: distance 35% · size 25% · config 20% · recency 20%. Top-matched comps best support the ARV.
Projected returns pro-forma
-3.0% appreciation · 2.94% rent growth · sell at horizon
- IRR
- 59.4%
- Equity multiple
- 3.64×
- Total profit
- $46,133
- Equity at exit
- $9,319
- IRR
- 64.1%
- Equity multiple
- 7.42×
- Total profit
- $112,312
- Equity at exit
- $5,404
Cash invested: $17,500 (down + closing). Projections, not guarantees.
Landlord ↔ Tenant lean methodology
- Overall (STATE)
- 28 Tenant-Leaning
- State Oregon
- 28 Tenant-Leaning · D+6
- County
- — inherits STATE
- City
- — inherits STATE
ZIP-level market 97071
- Rents YoY
- 2.9%
- Active inventory
- 306
- Price-to-rent
- 3.3×
Monthly cashflow live
- Estimated rent
- $1,592 high interval (Pro) →
- Mortgage (P&I)
- −$328
- Tax from tax record
- −$19 /mo · $227/yr
- Insurance
- −$26
- HOA
- −$0
- Vacancy / Maint / Mgmt
- −$334
- Net cashflow
- $885
Break-even live
UW: 25.0% down · 7.5% · 30yr · 1.5% tax · 5.0% vac · 8.0% maint · 8.0% mgmt
Financing live
Cash to close
- Down payment
- $15,625
- Closing costs
- $1,875
- Reserves months
- —
- Total cash needed
- —
Loan-product check · same deal, 3 products live
Conventional
25% down · 7.5% · 30yr
- Down + closing
- —
- Monthly P&I
- —
- Monthly cashflow
- —
- DSCR
- —
- Eligible?
- —
Personal DTI + credit; lowest rate.
DSCR
20% down · 8.5% · 30yr
- Down + closing
- —
- Monthly P&I
- —
- Monthly cashflow
- —
- DSCR
- —
- Eligible?
- —
No personal income docs; deal must DSCR.
Hard money
10% down · 12.0% · 12mo
- Down + closing
- —
- Monthly P&I
- —
- Monthly cashflow
- —
- DSCR
- —
- Eligible?
- —
Short-term bridge; refi at stabilization.
Rent comps 17 comps
| Address | Beds | Baths | Sqft | Rent | $/sqft | DOM | Units | Dist |
|---|---|---|---|---|---|---|---|---|
| 1341 W Hayes St Unit 02 Woodburn, OR | 2.0 | 1.0 | 891 | $1,495 | $1.68 | 43d | 1 | 0.20mi |
| 1560 Newberg Hwy Unit 180-25 Woodburn, OR | 2.0 | 1.0 | 930 | $1,350 | $1.45 | 13d | 1 | 0.23mi |
| 1560 Newberg Hwy Unit 180-29 Woodburn, OR | 2.0 | 1.0 | 930 | $1,350 | $1.45 | 43d | 1 | 0.23mi |
| 770 Evergreen Rd Unit 06 Woodburn, OR | 1.0 | 1.0 | 720 | $1,250 | $1.74 | 23d | 1 | 0.34mi |
| 1208 Newberg Hwy Unit 103-A Woodburn, OR | 2.0 | 1.0 | 960 | $1,795 | $1.87 | 43d | 1 | 0.34mi |
| 1208 Newberg Hwy Woodburn, OR | 2.0 | 1.0 | 960 | $1,795 | $1.87 | 1d | 1 | 0.34mi |
| 300 S Evergreen Rd Woodburn, OR | 1.0–2.0 | 1.0–2.0 | 774 | $1,770 | $2.29 | 12d | 1 | 0.55mi |
| 1123 N 3rd St Unit 1125 Woodburn, OR | 2.0 | 1.0 | 777 | $1,595 | $2.05 | 13d | 1 | 0.78mi |
| 311 S Evergreen Rd Woodburn, OR | 1.0–2.0 | 1.0–2.0 | 882 | $1,780 | $2.02 | 1d | 1 | 0.86mi |
| 477 Broadway St Unit 1 Woodburn, OR | 2.0 | 1.0 | 684 | $1,495 | $2.19 | 43d | 1 | 0.88mi |
| 2100 Arney Ln Woodburn, OR | 1.0–2.0 | 1.0–2.0 | 887 | $1,999 | $2.25 | 3d | 13 | 0.94mi |
| 1601 N Front St Woodburn, OR | 2.0 | 1.0 | 828 | $1,280 | $1.55 | 1d | 1 | 1.00mi |
| 398 Stacy Allison Way Woodburn, OR | 1.0–3.0 | 1.0–2.0 | 1008 | $2,087 | $2.07 | 2d | 108 | 1.00mi |
| 1398 E Cleveland St Woodburn, OR | 2.0 | 1.5 | 992 | $1,595 | $1.61 | 1d | 1 | 1.29mi |
| 1430 E Cleveland St Woodburn, OR | 2.0 | 2.0 | 860 | $1,708 | $1.99 | 1d | 3 | 1.32mi |
| 1458 E Cleveland St Woodburn, OR | 1.0 | 1.0 | 608 | $1,295 | $2.13 | 23d | 1 | 1.36mi |
| 8123 McCormick St Woodburn, OR | 3.0 | 1.0 | 1100 | $2,250 | $2.05 | 13d | 1 | 1.45mi |
Listing history 4 events
-
2026-05-14status Pending
-
2026-05-08$62,500 Active
-
2026-05-08soldstatus Sold
-
2026-04-28$62,500 Active
ⓘ Source: listings_history table (triggers on properties + properties_extension) + one-shot
backfill from property_details.listing_events for pre-trigger history.
Tax reassessment forecast OR · Resets to sale price
- Current annual tax
- $227 · $19/mo
- Projected year-2 tax
- $606 · $51/mo
- Expected delta
- +$379/yr (+$32/mo · 166.6%)
ⓘ Screening estimate from a state-policy table — verify with the county assessor before closing.
Climate risk First Street
- Flood 1/10 Low FEMA zone X (unshaded) · 0% chance over 30 yrs
- Wildfire 3/10 Moderate
- Heat 3/10 Moderate 7 d/yr ≥92°F today · 14 d/yr by 30 yrs out
- Wind 1/10 Low
- Air quality 10/10 Extreme 14 unhealthy d/yr today · 14 by 30 yrs out
Nearby sold comps map
Loading sold comps map…
Walkable amenities ~0.75 mi
Loading nearby amenities…
Taxation est. · year 1
- Rental income
- $19,106
- − Mortgage interest
- −$3,501
- − Property taxes
- −$227
- − Insurance
- −$312
- − Repairs & maintenance
- −$1,528
- − Management
- −$1,528
- − Depreciation
- −$1,818
- Taxable income
- $10,190
- Est. tax owed @ 24.0%
- −$2,446
- After-tax cash flow
- $8,175/yr
For passive investors: Depreciation is non-cash, so a rental often shows a tax loss while cash-flowing — sheltering income. Rental losses are passive: they offset passive income freely, and up to $25,000/yr can offset ordinary (W-2) income if you actively participate and your MAGI is under $100k (phasing out to $0 by $150k); unused losses carry forward. On sale, claimed depreciation is recaptured at up to 25%, and gains may owe capital-gains tax (a 1031 exchange can defer both). Figures are a year-1 estimate at your 24.0% rate — not tax advice; consult a CPA.
Schools (NCES district)
- District
- Woodburn SD 103
- NCES district ID
- 4113530
- Math proficiency
- 20% ▬ 0.00%
- Reading proficiency
- 31% ▼ -1.00%
- Median HH income
- $44,033
- Composite
- 24.9/100
- National rank
- #12993
- State rank
- #169 of 183 in OR
Livability — Woodburn
- Score
- 74/100
- State rank
- #91
- US rank
- #4490
Category grades
Schools grade is shown separately in the Schools card above.
Census & demographics
- Census place
- Woodburn, OR
- County
- Marion County · 258,219 people
- City population
- 33,123
- Metro
- Salem, OR
- Population (ZIP)
- 33,123
- Household income
- $70,938
- Rent vs Own
- Severe rent burden
- 1039.0
Population outlook (Marion County) Hauer SSP2
- Today (2025)
- 360,940 people
- By 2030
- 375,178 · +3.9%
- By 2040
- 400,914 · +11.1%
- By 2050
- 422,187 · +17.0%
- By 2075
- 460,305 · +27.5%
- By 2100
- 464,025 · +28.6%
Race, ethnicity, and origin ACS 2023
- Neighborhood character
- Majority Hispanic (61%)
- Race & ethnicity
- Hispanic / Latino 61% White 34% Two or more races 22% Native American 2% Asian 1%
- Hispanic origin (detail)
- Mexican 51%
- Common ancestry
- Scotch-Irish 2% Lithuanian 2% Romanian 2%
- Foreign-born
- 30% · Canada, China
- Languages at home
- 43% English-only · Spanish 53% Russian/Polish/Slavic 2%
Political lean MEDSL · Marion
- 2024 margin
- Toss-up / Even · D 47.5% · R 49.5% · Other 3.0%
- 2008→2024 swing
- -4.2pp toward R · 2008: 2.2pp · 2024: -2.0pp
- All cycles
- 2024: R+2.0 2020: D+1.1 2016: R+5.0 2012: R+3.5 2008: D+2.2
Not yet ingested
- Civics
- —
Market trends
- HPI YoY
- ▼ -353.43%
- Current HPI
- 297.3113
- Rent YoY
- ▲ 2.94%
- Metro
- Salem, OR
- State GDP YoY
- ▲ 2.05%
- F500 in state
- 2
Industry mix (Fortune 500 HQ in OR)
| Industry | F500 HQs | Revenue |
|---|---|---|
| Consumer Goods | 1 | $51B |
|
||
Price history
+0.0% since first listed4 events — show timeline
- 2026-05-14 Pending — WVMLS
- 2026-05-08 Listed $62,500 WVMLS
- 2026-05-08 Sold (MLS) — WVMLS
- 2026-04-28 Listed $62,500 WVMLS
Property tax history
+5.6%/yrLatest (2017): $227 · +12.0% YoY. Source: county tax records.
Cash-flow waterfall
monthlySold comps — $/sqft
last 12 mo · ≤1 miLoading sold comps…