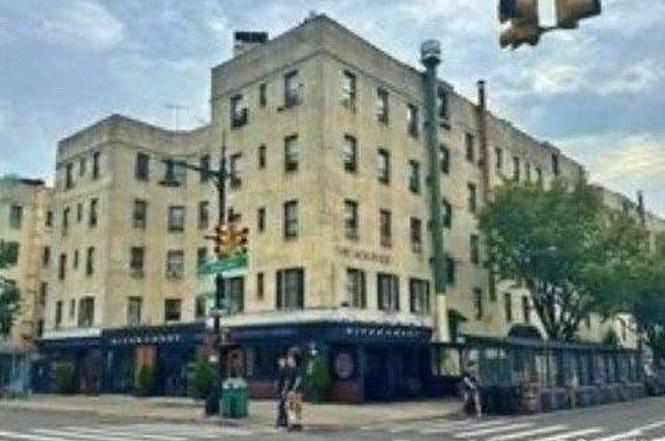
21-78 35 St Unit 5F · New York, NY
Flood risk 6/10 · Moderate
- FEMA flood zone
- X (unshaded)
- Chance of flooding over 30 yrs
- 0.74%
- Est. flood insurance / yr
- $507 – $1,088
Fire risk 1/10 · Minimal
- Est. fire insurance / yr
- $691 – $1,283
Heat risk 7/10 · Major
- Hot days now (above 99°F)
- 7 days/yr
- Hot days in 30 yrs
- 15 days/yr
Wind risk 6/10 · Moderate
- Chance of severe wind over 30 yrs
- 27.0%
Air-quality risk 5/10 · Moderate
- Unhealthy air days now
- 6 days/yr
- Unhealthy air days in 30 yrs
- 8 days/yr
Risk factors via First Street. Map © Google.
Why this score? — see what drove the B grade
The composite is a weighted blend of 9 inputs, each scored 0–100. Each bar is that input's sub-score; the figure is the points it added to the 100-point composite (weight × sub-score).
- Cash flow +30.0/30.0
- 1% rule +10.0/10.0
- DSCR +10.0/10.0
- ARV discount +7.5/15.0
- Schools +5.0/10.0
- Rent growth +4.2/5.0
- Livability +3.8/5.0
- Condition / age +2.5/5.0
- Appreciation +0.0/10.0
$259,000
🖨 Deal sheet 📄 Offer letter ✓ Due diligence
Listing remarks
LOWEST price TWO BEDROOM in ASTORIA is the Best indication of SELLER MOTIVATION!!! The unit is being sold with an established existing tenant paying $2,000 per month on a "No Lease" basis. One of the "Hot Spots" in Astoria on the "quiet top floor". .. No noise above you and views! Washer, dryer, and dishwasher are allowed in the unit. An exceptional 2-bedroom co-op in the desirable Acropolis Astoria. Natural light streams in through large windows in every room, creating a bright and airy ambiance. The Acropolis offers amenities such as a laundry room, a serene private garden, and convenient bike storage. This co-op allows for subletting and co-purchasing, maki
Key facts
- Built 1940
- Listed 132 days
Property features AI
Finance
- HOA & community: Association fee includes grounds care, heat, hot water, sewer and water
Exterior
- Parking: On-street parking available; No carport
- Utilities: Public sewer; Public trash collection
- Home design: Stock cooperative; Entry level: 5; One level listed
- Construction: Brick construction
- Exterior features: Brick construction; Not waterfront; No additional parcels
Interior
- Kitchen: Oil water heater
- Bedrooms: Pets allowed: cats and dogs
- Bathrooms: One full bathroom
- Heating & cooling: Oil heating; Steam heating; No air conditioning
- Interior features: Other interior features; Five total stories; No basement
- Laundry & utility: Oil water heater
Neighborhood map
What this means for you Summary
Snapshot
- This is a 2-bed/1.0-bath condo listed at $259k.
Deal economics
- At list price, monthly cash flow is $2k ($24k/yr) — positive.
- The deal already cash-flows at list — no discount required.
- Meets the 1% rule at list price ($6k rent vs $259k).
- Recommended offer: $228k (12.0% below list) — sets the bar for market timing.
- Cap rate 15.7% vs local median 2.6% in New York — top-decile yield for the area; either an underpriced asset or a hidden risk that comps aren't pricing in. Stress-test before assuming the spread holds.
Location & tenants
- Location reads 75/100 on livability (#268 in NY, #4,188 nationally) — a middle-class / working-renter tenant base. Strengths: amenities A+, commute A+, health & safety A; Watch: crime F, cost of living F.
- Market conditions: Rents rising fast (+6.7%/yr); 112 active listings in the ZIP; 14 comparable units currently listed for rent nearby; rentals leasing fast (median 2d on market — plan ~1-2 weeks tenant-placement turnaround); solid renter incomes; 5,302 units permitted in Queens County in 2024 (4,918 in 5+ unit buildings).
- At $5,685/mo this rent would consume 67% of the median local household income ($102k/yr) (locally 2291% of renters already pay >50% of income on rent) — very limited rent-growth headroom before tenants either downsize or default.
Forward outlook
- Local home prices are declining (-3.0%/yr); year-one equity from $2k of loan paydown is wiped out by about $8k of value loss. Plan a longer hold.
- Queens County population projected at +16% by 2050 — long-run rental-demand tailwind backs the buy-and-hold thesis.
- At projected returns (-3.0% appreciation + 6.7% rent growth), your $73k cash investment doubles in ~4 years — after that, you're playing with house money.
Negotiation context
- It's been on market 132 days — a 12% lower offer ($228k) is reasonable based on typical stale-listing flexibility.
- 3 sale attempts since 3y ago with the ask held roughly flat each time — persistent listings suggest the price (not the market) is what's stuck; bring a comps-based counter.
Risks & watch-outs
- Watch-outs: built in 1940 — expect roof / HVAC / electrical / plumbing capex.
- Climate carrying-cost: major flood risk; major wind risk, 27% chance of damaging wind over 30y; extreme-heat days projected 7→15/yr by 2055 (HVAC capex compounding) — expect insurance premiums to compound above CPI over the hold.
Questions for the listing agent
- It's been on market 132 days. Have you received any prior offers? Is the seller open to a 12% concession, seller financing, or rate buy-down credit?
- Built in 1940 — when were the roof, HVAC, electrical panel, plumbing, and water heater last replaced?
- What does the HOA fee cover, when was the last increase, and are there any pending special assessments or reserve-fund shortfalls?
- Any open or pending special assessments — roof, HVAC, plumbing, elevator, façade? What's the per-unit balance and payoff schedule, and is the seller paying it off at close or rolling it to the buyer?
- Why hasn't it sold? Are there any deal-killer items the seller is aware of (foundation, flood, title, zoning, code violations)?
- Is there a deadline driving the sale (1031 exchange, divorce, estate, relocation)? That informs how much negotiation room exists.
- Schools are B-rated — typically a magnet for longer-tenancy family renters. What's the average tenant stay here, and is there a school-zone premium baked into asking?
- Crime grade is F in this area — have there been break-ins, vandalism, or insurance claims at this property in the last 3 years? What carrier currently insures it and at what premium?
- What's the average days-on-market for RENTAL listings here right now (not sales)? A rising rental-DOM trend means longer vacancies and softer asking-rent achievability than the comps imply.
- What's the recent tenant-quality profile in this submarket — average credit score on applications, eviction rate, late-payment / NSF rate, and stable-employment percentage? A property-management company in the area should have these aggregated.
- How much new apartment / multifamily construction is in the pipeline within 1–3 miles? Heavy new supply (>2% of stock underway) typically softens rents 12–24 months out; light construction supports rent growth.
Investment metrics
- 1% rule
- 2.19% ✓
- Cap rate
- 15.68%
- Cash-on-cash
- 33.51%
- DSCR
- 2.49
- GRM
- 3.8
CMA / ARV
No comps found within radius.
Projected returns pro-forma
-3.0% appreciation · 6.66% rent growth · sell at horizon
- IRR
- 33.7%
- Equity multiple
- 2.51×
- Total profit
- $109,224
- Equity at exit
- $38,618
- IRR
- 42.8%
- Equity multiple
- 5.95×
- Total profit
- $359,276
- Equity at exit
- $22,394
Cash invested: $72,520 (down + closing). Projections, not guarantees.
Landlord ↔ Tenant lean methodology
- Overall (CITY)
- 0 Strongly Tenant-Friendly
- State New York
- 15 Strongly Tenant-Friendly · D+10
- County
- — inherits STATE
- City New York
- 0 Strongly Tenant-Friendly · D+34
ZIP-level market 11105
- Home prices YoY
- -11.2%
- Rents YoY
- 6.7%
- Active inventory
- 112
- Price-to-rent
- 3.8×
Monthly cashflow live
- Estimated rent
- $5,685 high interval (Pro) →
- Mortgage (P&I)
- −$1,358
- Tax est. 1.5%
- −$324 /mo · $3,885/yr
- Insurance
- −$108
- HOA est. from 1 same-building comp
- −$676
- Vacancy / Maint / Mgmt
- −$1,194
- Net cashflow
- $2,025
Break-even live
UW: 25.0% down · 7.5% · 30yr · 1.5% tax · 5.0% vac · 8.0% maint · 8.0% mgmt
Financing live
Cash to close
- Down payment
- $64,750
- Closing costs
- $7,770
- Reserves months
- —
- Total cash needed
- —
Loan-product check · same deal, 3 products live
Conventional
25% down · 7.5% · 30yr
- Down + closing
- —
- Monthly P&I
- —
- Monthly cashflow
- —
- DSCR
- —
- Eligible?
- —
Personal DTI + credit; lowest rate.
DSCR
20% down · 8.5% · 30yr
- Down + closing
- —
- Monthly P&I
- —
- Monthly cashflow
- —
- DSCR
- —
- Eligible?
- —
No personal income docs; deal must DSCR.
Hard money
10% down · 12.0% · 12mo
- Down + closing
- —
- Monthly P&I
- —
- Monthly cashflow
- —
- DSCR
- —
- Eligible?
- —
Short-term bridge; refi at stabilization.
Rent comps 14 comps
| Address | Beds | Baths | Sqft | Rent | $/sqft | DOM | Units | Dist |
|---|---|---|---|---|---|---|---|---|
| 2719 44th Dr Long Island City, NY | 1.0 | 1.0 | 628 | $4,945 | $7.87 | 7d | 2 | 0.19mi |
| 475 48th Ave Long Island City, NY | 3.0 | 1.0–3.0 | 1293 | $7,173 | $5.55 | 1d | 1 | 0.77mi |
| 3705 30th St Long Island City, NY | 2.0 | 1.0–2.0 | 700 | $6,180 | $8.83 | 10d | 3 | 0.92mi |
| 1 Bell Slip Brooklyn, NY | 2.0 | 1.0–2.0 | 766 | $7,462 | $9.74 | 1d | 7 | 0.99mi |
| 1 Blue Slip Brooklyn, NY | 2.0 | 1.0–2.0 | 834 | $7,548 | $9.04 | 1d | 13 | 1.04mi |
| 2 Blue Slip Brooklyn, NY | 2.0 | 1.0–2.0 | 819 | $8,221 | $10.04 | 1d | 7 | 1.07mi |
| 285 Kingsland Ave #2078 Brooklyn, NY | 1.0–2.0 | 1.0–2.0 | 725 | $6,380 | $8.80 | 24d | 2 | 1.22mi |
| 599 E 56th St Unit 1817 New York, NY | 1.0 | 1.0 | 625 | $4,850 | $7.76 | 24d | 1 | 1.32mi |
| 420 E 54th St New York, NY | 3.0 | 1.0–2.5 | 1104 | $10,299 | $9.32 | 1d | 14 | 1.39mi |
| 940 1st Ave Unit 2040 New York, NY | 2.0 | 1.5 | 600 | $7,500 | $12.50 | 2d | 1 | 1.43mi |
| 400 E 57th St #2106 New York, NY | 2.0 | 1.0–2.0 | 903 | $8,590 | $9.51 | 3d | 3 | 1.46mi |
| 34-35 44th St Astoria, NY | 1.0–2.0 | 1.0–2.0 | 613 | $5,794 | $9.45 | 1d | 26 | 1.46mi |
| 959 1st Ave Unit 6X New York, NY | 1.0 | 1.0 | 739 | $6,000 | $8.12 | 24d | 1 | 1.46mi |
| 340 E 52nd St #1527 New York, NY | 1.0 | 1.0 | 575 | $8,080 | $14.05 | 1d | 2 | 1.49mi |
HOA detail condo
- Monthly dues
- $0 · $0/yr
- Assessments
- None detected in remarks — confirm with the listing agent.
Listing history 15 events
-
2026-06-18days on market $259,000 Active 132 DOM
-
2026-06-17days on market $259,000 Active 131 DOM
-
2026-06-15days on market $259,000 Active 129 DOM
-
2026-06-13days on market $259,000 Active 127 DOM
-
2026-06-10days on market $259,000 Active 123 DOM
-
2026-06-08days on market $259,000 Active 122 DOM
-
2026-06-04days on market $259,000 Active 118 DOM
-
2026-06-03days on market $259,000 Active 117 DOM
-
2026-06-01days on market $259,000 Active 115 DOM
-
2026-05-31days on market $259,000 Active 114 DOM
-
2026-02-06$259,000 Active
-
2026-01-01historical
-
2024-05-30$270,000 Active
-
2024-04-27historical
-
2023-10-28$270,000 Active
ⓘ Source: listings_history table (triggers on properties + properties_extension) + one-shot
backfill from property_details.listing_events for pre-trigger history.
Climate risk First Street
- Flood 6/10 Major FEMA zone X (unshaded) · 74% chance over 30 yrs
- Wildfire 1/10 Low
- Heat 7/10 Severe 7 d/yr ≥99°F today · 15 d/yr by 30 yrs out
- Wind 6/10 Major 27% chance of damaging wind over 30 yrs
- Air quality 5/10 Major 6 unhealthy d/yr today · 8 by 30 yrs out
Nearby sold comps map
Loading sold comps map…
Walkable amenities ~0.75 mi
Loading nearby amenities…
Taxation est. · year 1
- Rental income
- $68,220
- − Mortgage interest
- −$14,508
- − Property taxes
- −$3,885
- − Insurance
- −$1,295
- − Repairs & maintenance
- −$5,458
- − Management
- −$5,458
- − HOA
- −$8,112
- − Depreciation
- −$7,535
- Taxable income
- $21,970
- Est. tax owed @ 24.0%
- −$5,273
- After-tax cash flow
- $19,030/yr
For passive investors: Depreciation is non-cash, so a rental often shows a tax loss while cash-flowing — sheltering income. Rental losses are passive: they offset passive income freely, and up to $25,000/yr can offset ordinary (W-2) income if you actively participate and your MAGI is under $100k (phasing out to $0 by $150k); unused losses carry forward. On sale, claimed depreciation is recaptured at up to 25%, and gains may owe capital-gains tax (a 1031 exchange can defer both). Figures are a year-1 estimate at your 24.0% rate — not tax advice; consult a CPA.
Schools (NCES district)
No district data.
Livability — New York
- Score
- 75/100
- State rank
- #268
- US rank
- #4188
Category grades
Schools grade is shown separately in the Schools card above.
Census & demographics
- Census place
- New York, NY
- County
- Queens County · 1,914,869 people
- City population
- 7,731,280
- Metro
- New York-Newark-Jersey City, NY-NJ-PA
- Population (ZIP)
- 37,936
- Household income
- $102,012
- Rent vs Own
- Severe rent burden
- 2291.0
Population outlook (Queens County) Hauer SSP2
- Today (2025)
- 2,546,320 people
- By 2030
- 2,643,059 · +3.8%
- By 2040
- 2,815,563 · +10.6%
- By 2050
- 2,944,423 · +15.6%
- By 2075
- 3,123,338 · +22.7%
- By 2100
- 3,098,688 · +21.7%
Race, ethnicity, and origin ACS 2023
- Neighborhood character
- Diverse neighborhood (Simpson 0.58)
- Race & ethnicity
- White 60% Hispanic / Latino 22% Two or more races 11% Asian 10% Black 3%
- Hispanic origin (detail)
- Mexican 4% Puerto Rican 5% Dominican 2%
- Common ancestry
- Romanian 3% Italian 1% Scotch-Irish 1%
- Foreign-born
- 32% · Canada, Jamaica, Vietnam
- Languages at home
- 53% English-only · Other Indo-European 17% Spanish 16% Arabic 6%
Political lean MEDSL · Queens
- 2024 margin
- Strong D (+24.6) · D 62.3% · R 37.7%
- 2008→2024 swing
- -26.2pp toward R · 2008: 50.8pp · 2024: 24.6pp
- All cycles
- 2024: D+24.6 2020: D+45.2 2016: D+53.4 2012: D+58.5 2008: D+50.8
Not yet ingested
- Civics
- —
Market trends
- HPI YoY
- ▼ -62.96%
- Current HPI
- 501.1392
- Rent YoY
- ▲ 6.66%
- Metro
- New York-Newark-Jersey City, NY-NJ-PA
- State GDP YoY
- ▲ 2.60%
- F500 in state
- 92
Industry mix (Fortune 500 HQ in NY)
| Industry | F500 HQs | Revenue |
|---|---|---|
| Financial Services | 10 | $950B |
|
||
| Consumer Goods | 9 | $162B |
|
||
| Insurance | 4 | $225B |
|
||
| Telecommunications | 2 | $144B |
|
||
| Pharmaceuticals | 2 | $112B |
|
||
| Media / Entertainment | 2 | $69B |
|
||
Price history
-4.1% since first listed5 events — show timeline
- 2026-02-06 Listed $259,000 OneKey® MLS as Distributed by MLS Grid
- 2026-01-01 Listing Removed — OneKey® MLS as Distributed by MLS Grid
- 2024-05-30 Listed $270,000 OneKey® MLS as Distributed by MLS Grid
- 2024-04-27 Listing Removed — OneKey® MLS as Distributed by MLS Grid
- 2023-10-28 Listed $270,000 OneKey® MLS as Distributed by MLS Grid
Cash-flow waterfall
monthlySold comps — $/sqft
last 12 mo · ≤1 miLoading sold comps…