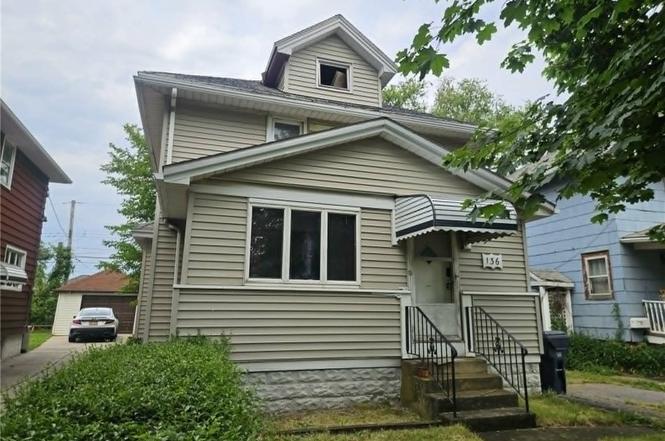
136 Madison Ave · Blasdell, NY
Flood risk 6/10 · Moderate
- FEMA flood zone
- X (unshaded)
- Chance of flooding over 30 yrs
- 0.73%
- Est. flood insurance / yr
- $473 – $860
Fire risk 1/10 · Minimal
- Est. fire insurance / yr
- $691 – $1,283
Heat risk 3/10 · Minor
- Hot days now (above 92°F)
- 7 days/yr
- Hot days in 30 yrs
- 16 days/yr
Wind risk 1/10 · Minimal
- Chance of severe wind over 30 yrs
- —
Air-quality risk 4/10 · Minor
- Unhealthy air days now
- 3 days/yr
- Unhealthy air days in 30 yrs
- 8 days/yr
Risk factors via First Street. Map © Google.
Why this score? — see what drove the B- grade
The composite is a weighted blend of 9 inputs, each scored 0–100. Each bar is that input's sub-score; the figure is the points it added to the 100-point composite (weight × sub-score).
- Cash flow +29.4/30.0
- DSCR +10.0/10.0
- 1% rule +8.1/10.0
- ARV discount +7.5/15.0
- Schools +4.7/10.0
- Livability +3.3/5.0
- Rent growth +2.5/5.0
- Condition / age +2.5/5.0
- Appreciation +0.0/10.0
$99,899
🖨 Deal sheet (PDF) 📄 Offer letter ✓ Due diligence
Listing remarks
WHAT AN OPPERTUNITY; Bring Your Vision to Life! Calling all investors and project enthusiasts — this single-family home in Lackawanna is a fantastic opportunity with endless potential. The property features 3 bedrooms, 1 full bath, a living room, and an eat-in kitchen, offering a solid foundation for renovation or redesign. A full walk-up attic provides additional space that could be finished to suit your needs or used for extra storage. The home also includes a full basement and a 1.5-car detached garage, adding valuable utility and flexibility. Whether you’re looking to renovate, rent, or resell, this property is ready for your ideas. Don’t miss this chance to transfo
Key facts
- Full basement
- Eat-in kitchen
- Full walk-up attic
Tags
Property features AI
Exterior
- Parking: Detached garage; 1 garage space
- Utilities: Public water connected; Sewer connected
- Home design: Two-story dwelling; Existing/resale property
- Construction: Vinyl siding; Stone foundation
- Exterior features: Blacktop driveway; Near public transit; Rectangular residential lot (35 x 110)
Interior
- Kitchen: Gas water heater
- Bedrooms: Total rooms: 5
- Flooring: Hardwood; Vinyl; Varies
- Bathrooms: One full bathroom (main level)
- Heating & cooling: Gas forced-air heating
- Interior features: Eat-in kitchen; Additional interior features listed in remarks
- Laundry & utility: Has basement (full) — utility/storage space
Neighborhood map
What this means for you Summary
Snapshot
- This is a 3-bed/1.0-bath single-family listed at $100k.
Deal economics
- At list price, monthly cash flow is $354 ($4k/yr) — positive.
- The deal already cash-flows at list — no discount required.
- Meets the 1% rule at list price ($1k rent vs $100k).
- Cap rate 10.5% vs local median 4.5% in Blasdell — top-decile yield for the area; either an underpriced asset or a hidden risk that comps aren't pricing in. Stress-test before assuming the spread holds.
Location & tenants
- Location reads 66/100 on livability (#643 in NY) — a middle-class / working-renter tenant base. Strengths: cost of living A+, housing A+, health & safety A+; Watch: employment D, amenities F, commute F.
- Frontier Central School District (suburban): math 54% / reading 55% proficiency, ranked #301 of 590 in NY (top 51%) — acceptable for families but not a draw, mixed tenant base, ~2y average lease; only 20% free/reduced lunch — higher-income household profile.
- Zoned schools: Blasdell Elementary School (math 17% / reading 42%, grade F, #1,729 of 2,108 statewide, top 84%, 488 students, 56% FRL); Frontier Middle School (math 38% / reading 53%, grade D+, #337 of 729 statewide, top 47%, 1,071 students, 34% FRL); Frontier Senior High School (math 97% / reading 95%, grade A+, #68 of 1,100 statewide, top 6%, 1,352 students, 31% FRL) — zoned schools average 40% FRL vs 20% district-wide (20 pts higher); higher-poverty schools than district average — tighter screening recommended.
- Market conditions: 92 active listings in the ZIP; 2 comparable units currently listed for rent nearby; 1,244 units permitted in Erie County in 2024 (563 in 5+ unit buildings).
Forward outlook
- Local home prices are declining (-3.0%/yr); year-one equity from $690 of loan paydown is wiped out by about $3k of value loss. Plan a longer hold.
- At projected returns (-3.0% appreciation + 3.0% rent growth), your $28k cash investment doubles in ~8 years — after that, you're playing with house money.
Negotiation context
- Only 10 days on market — expect competitive offers; lowballing is unlikely to land.
- Current owner paid $32k; list at $100k implies a 212% gain — meaningful room to come down on a strong offer.
Risks & watch-outs
- Watch-outs: built in 1923 — expect roof / HVAC / electrical / plumbing capex.
- Climate carrying-cost: major flood risk — expect insurance premiums to compound above CPI over the hold.
Questions for the listing agent
- Built in 1923 — when were the roof, HVAC, electrical panel, plumbing, and water heater last replaced?
- Is there a deadline driving the sale (1031 exchange, divorce, estate, relocation)? That informs how much negotiation room exists.
- Schools are D-rated, which usually means shorter tenancies and higher turnover. Who's the typical renter profile here, and what's been the actual vacancy rate?
- What's the average days-on-market for RENTAL listings here right now (not sales)? A rising rental-DOM trend means longer vacancies and softer asking-rent achievability than the comps imply.
- What's the recent tenant-quality profile in this submarket — average credit score on applications, eviction rate, late-payment / NSF rate, and stable-employment percentage? A property-management company in the area should have these aggregated.
- How much new for-sale + rental construction is in the pipeline within 1–3 miles? Heavy new supply typically softens prices + rents 12–24 months out; constrained supply supports both.
Investment metrics
- 1% rule
- 1.31% ✓
- Cap rate
- 10.55%
- Cash-on-cash
- 15.20%
- DSCR
- 1.68
- GRM
- 6.4
CMA / ARV
- ARV (on-the-fly)
- $243,432
- Comps found
- 12
Show comp detail 12 sales within ~0.75 mi
| Address | Dist | Beds/Ba | Sqft | Sold | Price | $/sf | Match |
|---|---|---|---|---|---|---|---|
| 17 Labelle Ave | 0.23mi | 3/1.5 | 1,184 (+1%) | 5mo | $175,000 | $148 | 82 |
| 17 Salisbury Ave | 0.25mi | 3/1.5 | 1,324 (+13%) | 8mo | $225,000 | $170 | 58 |
| 3685 Milestrip Rd | 0.67mi | 3/1.0 | 1,224 (+4%) | 6mo | $131,700 | $108 | 57 |
| 86 Frontier Dr | 0.39mi | 3/1.5 | 1,036 (-12%) | 6mo | $235,000 | $227 | 55 |
| 80 Maple Ave | 0.42mi | 3/1.5 | 1,302 (+11%) | 8mo | $270,000 | $207 | 54 |
| 4243 E Frontier Dr | 0.54mi | 3/1.5 | 1,032 (-12%) | 1mo | $295,000 | $286 | 51 |
| 66 Kent Ave | 0.42mi | 4/2.0 (+1) | 1,296 (+10%) | 8mo | $250,000 | $193 | 48 |
| 4326 E Frontier Dr | 0.70mi | 3/1.0 | 1,008 (-14%) | 2mo | $253,000 | $251 | 42 |
| 3576 James St | 0.69mi | 2/1.0 (-1) | 1,080 (-8%) | 10mo | $240,000 | $222 | 41 |
| 3606 James St | 0.75mi | 4/1.0 (+1) | 1,292 (+10%) | 4mo | $215,000 | $166 | 40 |
| 4328 Oakwood Ave | 0.64mi | 3/1.0 | 1,002 (-15%) | 7mo | $229,900 | $229 | 40 |
| 4244 Salem Dr | 0.63mi | 3/2.0 | 1,350 (+15%) | 8mo | $260,000 | $193 | 35 |
Match score weights: distance 35% · size 25% · config 20% · recency 20%. Top-matched comps best support the ARV.
Projected returns pro-forma
-3.0% appreciation · 3.0% rent growth · sell at horizon
- IRR
- 5.9%
- Equity multiple
- 1.23×
- Total profit
- $6,388
- Equity at exit
- $14,895
- IRR
- 15.3%
- Equity multiple
- 2.24×
- Total profit
- $34,672
- Equity at exit
- $8,637
Cash invested: $27,972 (down + closing). Projections, not guarantees.
Landlord ↔ Tenant lean methodology
- Overall (STATE)
- 15 Strongly Tenant-Friendly
- State New York
- 15 Strongly Tenant-Friendly · D+10
- County
- — inherits STATE
- City
- — inherits STATE
ZIP-level market 14218
- Home prices YoY
- -9.2%
- Active inventory
- 92
- Price-to-rent
- 6.4×
Monthly cashflow live
- Estimated rent
- $1,310 medium interval (Pro) →
- Mortgage (P&I)
- −$524
- Tax from tax record
- −$115 /mo · $1,386/yr
- Insurance
- −$42
- HOA
- −$0
- Vacancy / Maint / Mgmt
- −$275
- Net cashflow
- $354
Break-even live
Sensitivity live
| Price | -10% $411 | -5% $383 | +0% $354 | +5% $326 | +10% $298 |
|---|---|---|---|---|---|
| Rent | -10% $251 | -5% $302 | +0% $354 | +5% $406 | +10% $458 |
| Rate | -1.0pp $405 | -0.5pp $380 | base $354 | +0.5pp $328 | +1.0pp $302 |
UW: 25.0% down · 7.5% · 30yr · 1.5% tax · 5.0% vac · 8.0% maint · 8.0% mgmt
Financing live
Cash to close
- Down payment
- $24,975
- Closing costs
- $2,997
- Reserves months
- —
- Total cash needed
- —
Loan-product check · same deal, 3 products live
Conventional
25% down · 7.5% · 30yr
- Down + closing
- —
- Monthly P&I
- —
- Monthly cashflow
- —
- DSCR
- —
- Eligible?
- —
Personal DTI + credit; lowest rate.
DSCR
20% down · 8.5% · 30yr
- Down + closing
- —
- Monthly P&I
- —
- Monthly cashflow
- —
- DSCR
- —
- Eligible?
- —
No personal income docs; deal must DSCR.
Hard money
10% down · 12.0% · 12mo
- Down + closing
- —
- Monthly P&I
- —
- Monthly cashflow
- —
- DSCR
- —
- Eligible?
- —
Short-term bridge; refi at stabilization.
Rent comps 2 comps
| Address | Beds | Baths | Sqft | Rent | $/sqft | DOM | Units | Dist |
|---|---|---|---|---|---|---|---|---|
| 4227 E Allen St Unit 3 Buffalo, NY | 2.0 | 1.0 | 1000 | $1,300 | $1.30 | 3d | 1 | 0.48mi |
| 3400 McKinley Pkwy Buffalo, NY | 2.0 | 1.0 | 908 | $1,330 | $1.46 | 3d | 1 | 0.82mi |
Listing history 7 events
-
2026-06-21pricedays on market $99,899 Active 10 DOM
-
2026-06-18days on market $99,900 Active 7 DOM
-
2026-06-17days on market $99,900 Active 6 DOM
-
2026-06-16days on market $99,900 Active 5 DOM
-
2026-06-15days on market $99,900 Active 4 DOM
-
2026-06-13remarks 681-char remark
-
2026-06-13$99,900 Active 2 DOM
ⓘ Source: listings_history table (triggers on properties + properties_extension) + one-shot
backfill from property_details.listing_events for pre-trigger history.
Tax reassessment forecast NY · Partial reset (capped growth)
- Current annual tax
- $1,386 · $115/mo
- Projected year-2 tax
- $1,537 · $128/mo
- Expected delta
- +$151/yr (+$13/mo · 10.9%)
ⓘ Screening estimate from a state-policy table — verify with the county assessor before closing.
Climate risk First Street
- Flood 6/10 Major FEMA zone X (unshaded) · 73% chance over 30 yrs
- Wildfire 1/10 Low
- Heat 3/10 Moderate 7 d/yr ≥92°F today · 16 d/yr by 30 yrs out
- Wind 1/10 Low
- Air quality 4/10 Moderate 3 unhealthy d/yr today · 8 by 30 yrs out
Nearby sold comps map
Loading sold comps map…
Walkable amenities ~0.75 mi
Loading nearby amenities…
Taxation est. · year 1
- Rental income
- $15,725
- − Mortgage interest
- −$5,596
- − Property taxes
- −$1,386
- − Insurance
- −$499
- − Repairs & maintenance
- −$1,258
- − Management
- −$1,258
- − Depreciation
- −$2,906
- Taxable income
- $2,822
- Est. tax owed @ 24.0%
- −$677
- After-tax cash flow
- $3,574/yr
For passive investors: Depreciation is non-cash, so a rental often shows a tax loss while cash-flowing — sheltering income. Rental losses are passive: they offset passive income freely, and up to $25,000/yr can offset ordinary (W-2) income if you actively participate and your MAGI is under $100k (phasing out to $0 by $150k); unused losses carry forward. On sale, claimed depreciation is recaptured at up to 25%, and gains may owe capital-gains tax (a 1031 exchange can defer both). Figures are a year-1 estimate at your 24.0% rate — not tax advice; consult a CPA.
Schools (NCES district)
- District
- Frontier Central School District
- NCES district ID
- 3611670
- Math proficiency
- 54% ▼ -16.00%
- Reading proficiency
- 55% ▼ -10.00%
- Median HH income
- $58,807
- Composite
- 47.36/100
- National rank
- #2291
- State rank
- #301 of 590 in NY
Livability — Blasdell
- Score
- 66/100
- State rank
- #643
- US rank
- #12059
Category grades
Schools grade is shown separately in the Schools card above.
Census & demographics
- Census place
- Blasdell, NY
- Population (ZIP)
- 20,661
Population outlook (Erie County) Hauer SSP2
- Today (2025)
- 933,037 people
- By 2030
- 935,181 · +0.2%
- By 2040
- 928,531 · -0.5%
- By 2050
- 905,725 · -2.9%
- By 2075
- 834,037 · -10.6%
- By 2100
- 708,033 · -24.1%
Race, ethnicity, and origin ACS 2023
- Neighborhood character
- Predominantly White (73%)
- Race & ethnicity
- White 73% Black 13% Hispanic / Latino 10% Two or more races 5%
- Hispanic origin (detail)
- Puerto Rican 8%
- Common ancestry
- Romanian 18% Lithuanian 2% Slovak 1%
- Foreign-born
- 7% · Canada
- Languages at home
- 80% English-only · Arabic 11% Spanish 6% Russian/Polish/Slavic 1%
Political lean MEDSL · Erie
- 2024 margin
- Lean D (+9.7) · D 54.8% · R 45.2%
- 2008→2024 swing
- -7.9pp toward R · 2008: 17.5pp · 2024: 9.7pp
- All cycles
- 2024: D+9.7 2020: D+14.7 2016: D+4.8 2012: D+15.6 2008: D+17.5
Not yet ingested
- Civics
- —
Market trends
- HPI YoY
- ▼ -39.44%
- Current HPI
- 389.0188
- Rent YoY
- —
- Metro
- —
- State GDP YoY
- ▲ 2.60%
- F500 in state
- 92
Industry mix (Fortune 500 HQ in NY)
| Industry | F500 HQs | Revenue |
|---|---|---|
| Financial Services | 10 | $950B |
|
||
| Consumer Goods | 9 | $162B |
|
||
| Insurance | 4 | $225B |
|
||
| Telecommunications | 2 | $144B |
|
||
| Pharmaceuticals | 2 | $112B |
|
||
| Media / Entertainment | 2 | $69B |
|
||
Price history
+212.2% since first listed2 events — show timeline
- 2026-06-11 Listed $99,900 WNYREIS
- 2002-01-16 Sold (Public Records) $32,000 Public Records
Property tax history
-0.1%/yrLatest (2025): $1,386 · +10.9% YoY. Source: county tax records.
Cash-flow waterfall
monthlySold comps — $/sqft
last 12 mo · ≤1 miLoading sold comps…