921 W Superior St · Munising, MI
Flood risk 1/10 · Minimal
- FEMA flood zone
- —
- Chance of flooding over 30 yrs
- 0.0%
- Est. flood insurance / yr
- —
Fire risk 3/10 · Minor
- Est. fire insurance / yr
- $784 – $1,456
Heat risk 1/10 · Minimal
- Hot days now (above 90°F)
- 7 days/yr
- Hot days in 30 yrs
- 12 days/yr
Wind risk 1/10 · Minimal
- Chance of severe wind over 30 yrs
- —
Air-quality risk 1/10 · Minimal
- Unhealthy air days now
- 0 days/yr
- Unhealthy air days in 30 yrs
- 0 days/yr
Risk factors via First Street. Map © Google.
Why this score? — see what drove the B grade
The composite is a weighted blend of 9 inputs, each scored 0–100. Each bar is that input's sub-score; the figure is the points it added to the 100-point composite (weight × sub-score).
- Cash flow +27.7/30.0
- ARV discount +15.0/15.0
- DSCR +9.8/10.0
- 1% rule +7.9/10.0
- Livability +3.5/5.0
- Schools +3.2/10.0
- Rent growth +2.5/5.0
- Condition / age +2.5/5.0
- Appreciation +0.0/10.0
$99,000
🖨 Deal sheet 📄 Offer letter ✓ Due diligence
Listing remarks MLS
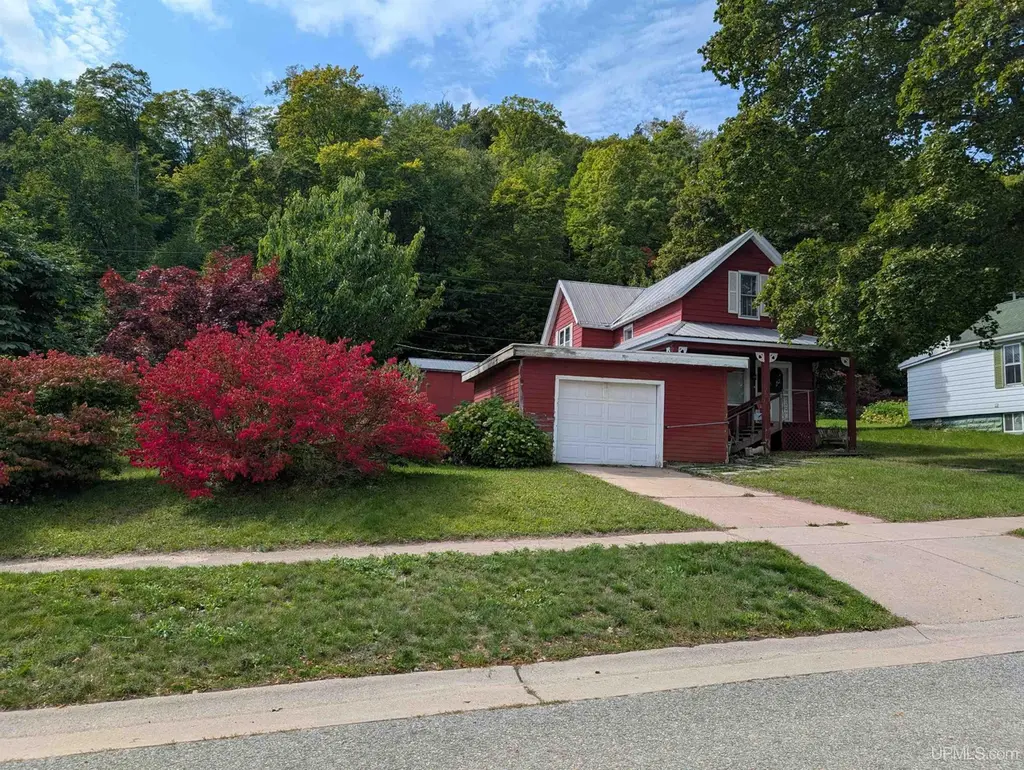
Here's a two-lot home that's in a nice location on the west side of Munising. The property borders the hillside that wraps around our little town of Munising and has access nearby for all the trails. There is a separate enclosed "clubhouse" that's elevated in back of the home that can be enjoyed by children or adults. House will require work to accommodate a livable atmosphere again, but the size of the home and double lot certainly is attractive. Multiple fruit trees surround the property and there's plenty of room for a garden. The opportunity exists for an upgrade or those who love the area and want to start anew.
Key facts
- Separate clubhouse
- Borders hillside
- Access for trails
Tags
Neighborhood map
What this means for you Summary
Snapshot
- This is a 4-bed/1.0-bath single-family listed at $99k.
Deal economics
- At list price, monthly cash flow is $300 ($4k/yr) — positive.
- The deal already cash-flows at list — no discount required.
- Meets the 1% rule at list price ($1k rent vs $99k).
- Recommended offer: $87k (12.0% below list) — sets the bar for market timing.
- Cap rate 9.9% vs local median 2.6% in Munising — top-decile yield for the area; either an underpriced asset or a hidden risk that comps aren't pricing in. Stress-test before assuming the spread holds.
Location & tenants
- Location reads 69/100 on livability (#338 in MI) — a middle-class / working-renter tenant base. Strengths: cost of living A+, housing A+, health & safety A+; Watch: schools F, amenities F, commute F.
- Munising Public Schools (town): math 28% / reading 49% proficiency, ranked #241 of 540 in MI (top 45%) — families likely to look elsewhere, expect single-tenant / working-renter base with shorter leases.
- Market conditions: 57 active listings in the ZIP; 33 units permitted in Alger County in 2024 (0 in 5+ unit buildings).
Forward outlook
- Local home prices are declining (-3.0%/yr); year-one equity from $684 of loan paydown is wiped out by about $3k of value loss. Plan a longer hold.
- Alger County population projected at -22% by 2050 — secular population decline; favor cash flow + early exit over multi-decade hold.
- At projected returns (-3.0% appreciation + 3.0% rent growth), your $28k cash investment doubles in ~9 years — after that, you're playing with house money.
Negotiation context
- It's been on market 288 days — a 12% lower offer ($87k) is reasonable based on typical stale-listing flexibility.
- 2 sale attempts; this cycle's ask has dropped $21k (18%) from the opening price — seller is motivated, your offer sets the floor, not the list.
Risks & watch-outs
- Watch-outs: built in 1890 — expect roof / HVAC / electrical / plumbing capex.
Questions for the listing agent
- It's been on market 288 days. Have you received any prior offers? Is the seller open to a 12% concession, seller financing, or rate buy-down credit?
- Built in 1890 — when were the roof, HVAC, electrical panel, plumbing, and water heater last replaced?
- Why hasn't it sold? Are there any deal-killer items the seller is aware of (foundation, flood, title, zoning, code violations)?
- Is there a deadline driving the sale (1031 exchange, divorce, estate, relocation)? That informs how much negotiation room exists.
- Schools are F-rated, which usually means shorter tenancies and higher turnover. Who's the typical renter profile here, and what's been the actual vacancy rate?
- What's the average days-on-market for RENTAL listings here right now (not sales)? A rising rental-DOM trend means longer vacancies and softer asking-rent achievability than the comps imply.
- What's the recent tenant-quality profile in this submarket — average credit score on applications, eviction rate, late-payment / NSF rate, and stable-employment percentage? A property-management company in the area should have these aggregated.
- How much new for-sale + rental construction is in the pipeline within 1–3 miles? Heavy new supply typically softens prices + rents 12–24 months out; constrained supply supports both.
Investment metrics
- 1% rule
- 1.29% ✓
- Cap rate
- 9.93%
- Cash-on-cash
- 12.99%
- DSCR
- 1.58
- GRM
- 6.5
CMA / ARV
- ARV (median comp)
- $169,647
- List price
- $99,000
- Delta
- -41.64%
- Verdict
- UNDERPRICED
- Comps
- 20 within 1.0 mi
Show comp detail 6 sales within ~0.75 mi
| Address | Dist | Beds/Ba | Sqft | Sold | Price | $/sf | Match |
|---|---|---|---|---|---|---|---|
| 213 Oak St | 0.25mi | 4/2.0 | 1,439 (+5%) | 11mo | $154,900 | $108 | 66 |
| 409 W Onota St | 0.43mi | 3/1.0 (-1) | 1,272 (-7%) | 9mo | $186,000 | $146 | 56 |
| 116 W Varnum St | 0.75mi | 3/2.0 (-1) | 1,389 (+2%) | 1mo | $160,000 | $115 | 53 |
| 304 Chestnut St | 0.40mi | 3/1.0 (-1) | 1,517 (+11%) | 15mo | $109,000 | $72 | 45 |
| 124 W Jewell St | 0.69mi | 3/1.0 (-1) | 1,402 (+2%) | 24mo | $125,000 | $89 | 39 |
| 308 Spruce St | 0.54mi | 3/1.5 (-1) | 1,163 (-15%) | 24mo | $95,000 | $82 | 23 |
Match score weights: distance 35% · size 25% · config 20% · recency 20%. Top-matched comps best support the ARV.
Projected returns pro-forma
-3.0% appreciation · 3.0% rent growth · sell at horizon
- IRR
- 2.9%
- Equity multiple
- 1.11×
- Total profit
- $3,100
- Equity at exit
- $14,761
- IRR
- 12.5%
- Equity multiple
- 1.99×
- Total profit
- $27,442
- Equity at exit
- $8,560
Cash invested: $27,720 (down + closing). Projections, not guarantees.
Landlord ↔ Tenant lean methodology
- Overall (STATE)
- 62 Landlord-Friendly
- State Michigan
- 62 Landlord-Friendly · EVEN
- County
- — inherits STATE
- City
- — inherits STATE
ZIP-level market 49862
- Active inventory
- 57
- Price-to-rent
- 6.5×
Monthly cashflow live
- Estimated rent
- $1,276 medium interval (Pro) →
- Mortgage (P&I)
- −$519
- Tax from tax record
- −$148 /mo · $1,773/yr
- Insurance
- −$41
- HOA
- −$0
- Vacancy / Maint / Mgmt
- −$268
- Net cashflow
- $300
Break-even live
UW: 25.0% down · 7.5% · 30yr · 1.5% tax · 5.0% vac · 8.0% maint · 8.0% mgmt
Financing live
Cash to close
- Down payment
- $24,750
- Closing costs
- $2,970
- Reserves months
- —
- Total cash needed
- —
Loan-product check · same deal, 3 products live
Conventional
25% down · 7.5% · 30yr
- Down + closing
- —
- Monthly P&I
- —
- Monthly cashflow
- —
- DSCR
- —
- Eligible?
- —
Personal DTI + credit; lowest rate.
DSCR
20% down · 8.5% · 30yr
- Down + closing
- —
- Monthly P&I
- —
- Monthly cashflow
- —
- DSCR
- —
- Eligible?
- —
No personal income docs; deal must DSCR.
Hard money
10% down · 12.0% · 12mo
- Down + closing
- —
- Monthly P&I
- —
- Monthly cashflow
- —
- DSCR
- —
- Eligible?
- —
Short-term bridge; refi at stabilization.
Listing history 19 events
-
2026-06-18days on market $99,000 Active 288 DOM
-
2026-06-17days on market $99,000 Active 287 DOM
-
2026-06-16days on market $99,000 Active 286 DOM
-
2026-06-15days on market $99,000 Active 285 DOM
-
2026-06-13days on market $99,000 Active 283 DOM
-
2026-06-12days on market $99,000 Active 282 DOM
-
2026-06-09days on market $99,000 Active 279 DOM
-
2026-06-08days on market $99,000 Active 278 DOM
-
2026-06-07days on market $99,000 Active 277 DOM
-
2026-06-05days on market $99,000 Active 275 DOM
-
2026-06-04days on market $99,000 Active 273 DOM
-
2026-06-02days on market $99,000 Active 272 DOM
-
2026-06-01days on market $99,000 Active 271 DOM
-
2026-05-31days on market $99,000 Active 270 DOM
-
2026-05-31days on market $99,000 Active 269 DOM
-
2025-09-23price $99,000 634-char remark
Show marketing remark (634 chars)
Here's a two-lot home that's in a nice location on the west side of Munising. The property borders the hillside that wraps around our little town of Munising and has access nearby for all the trails. There is a separate enclosed "clubhouse" that's elevated in back of the home that can be enjoyed by children or adults. House will require work to accommodate a livable atmosphere again, but the size of the home and double lot certainly is attractive. Multiple fruit trees surround the property and there's plenty of room for a garden. The opportunity exists for an upgrade or those who love the area and want to start anew.
-
2025-09-22price $99,000 634-char remark
Show marketing remark (634 chars)
Here's a two-lot home that's in a nice location on the west side of Munising. The property borders the hillside that wraps around our little town of Munising and has access nearby for all the trails. There is a separate enclosed "clubhouse" that's elevated in back of the home that can be enjoyed by children or adults. House will require work to accommodate a livable atmosphere again, but the size of the home and double lot certainly is attractive. Multiple fruit trees surround the property and there's plenty of room for a garden. The opportunity exists for an upgrade or those who love the area and want to start anew.
-
2025-09-03$120,000 Active 634-char remark
Show marketing remark (634 chars)
Here's a two-lot home that's in a nice location on the west side of Munising. The property borders the hillside that wraps around our little town of Munising and has access nearby for all the trails. There is a separate enclosed "clubhouse" that's elevated in back of the home that can be enjoyed by children or adults. House will require work to accommodate a livable atmosphere again, but the size of the home and double lot certainly is attractive. Multiple fruit trees surround the property and there's plenty of room for a garden. The opportunity exists for an upgrade or those who love the area and want to start anew.
ⓘ Source: listings_history table (triggers on properties + properties_extension) + one-shot
backfill from property_details.listing_events for pre-trigger history.
Tax reassessment forecast MI · Partial reset (capped growth)
- Current annual tax
- $1,773 · $148/mo
- Projected year-2 tax
- $1,773 · $148/mo
- Expected delta
- $0/yr ($0/mo · 0.0%)
ⓘ Screening estimate from a state-policy table — verify with the county assessor before closing.
Climate risk First Street
- Flood 1/10 Low 0% chance over 30 yrs
- Wildfire 3/10 Moderate
- Heat 1/10 Low 7 d/yr ≥90°F today · 12 d/yr by 30 yrs out
- Wind 1/10 Low
- Air quality 1/10 Low 0 unhealthy d/yr today · 0 by 30 yrs out
Nearby sold comps map
Loading sold comps map…
Walkable amenities ~0.75 mi
Loading nearby amenities…
Taxation est. · year 1
- Rental income
- $15,314
- − Mortgage interest
- −$5,546
- − Property taxes
- −$1,773
- − Insurance
- −$495
- − Repairs & maintenance
- −$1,225
- − Management
- −$1,225
- − Depreciation
- −$2,880
- Taxable income
- $2,170
- Est. tax owed @ 24.0%
- −$521
- After-tax cash flow
- $3,079/yr
For passive investors: Depreciation is non-cash, so a rental often shows a tax loss while cash-flowing — sheltering income. Rental losses are passive: they offset passive income freely, and up to $25,000/yr can offset ordinary (W-2) income if you actively participate and your MAGI is under $100k (phasing out to $0 by $150k); unused losses carry forward. On sale, claimed depreciation is recaptured at up to 25%, and gains may owe capital-gains tax (a 1031 exchange can defer both). Figures are a year-1 estimate at your 24.0% rate — not tax advice; consult a CPA.
Schools (NCES district)
- District
- Munising Public Schools
- NCES district ID
- 2624810
- Math proficiency
- 28% ▼ -1.00%
- Reading proficiency
- 49% ▲ 10.00%
- Median HH income
- $39,446
- Composite
- 32.16/100
- National rank
- #5790
- State rank
- #241 of 540 in MI
Livability — Munising
- Score
- 69/100
- State rank
- #338
- US rank
- #8357
Category grades
Schools grade is shown separately in the Schools card above.
Census & demographics
- Census place
- Munising, MI
- Population (ZIP)
- 4,532
Population outlook (Alger County) Hauer SSP2
- Today (2025)
- 8,895 people
- By 2030
- 8,541 · -4.0%
- By 2040
- 7,706 · -13.4%
- By 2050
- 6,904 · -22.4%
- By 2075
- 5,760 · -35.2%
- By 2100
- 4,414 · -50.4%
Race, ethnicity, and origin ACS 2023
- Neighborhood character
- Predominantly White (75%)
- Race & ethnicity
- White 75% Black 15% Two or more races 6% Native American 3% Hispanic / Latino 1%
- Common ancestry
- Lithuanian 9% Romanian 7% Iranian 2%
- Foreign-born
- 1% · Canada
- Languages at home
- 98% English-only · German/W. Germanic 1%
Political lean MEDSL · Alger
- 2024 margin
- R (+19.8) · D 39.5% · R 59.3% · Other 1.3%
- 2008→2024 swing
- -25.8pp toward R · 2008: 6.0pp · 2024: -19.8pp
- All cycles
- 2024: R+19.8 2020: R+18.7 2016: R+20.4 2012: R+2.5 2008: D+6.0
Not yet ingested
- Civics
- —
Market trends
- HPI YoY
- ▼ -116.87%
- Current HPI
- 153.6932
- Rent YoY
- —
- Metro
- —
- State GDP YoY
- ▲ 1.37%
- F500 in state
- 28
Industry mix (Fortune 500 HQ in MI)
| Industry | F500 HQs | Revenue |
|---|---|---|
| Automotive Parts | 3 | $48B |
|
||
| Automotive | 2 | $372B |
|
||
| Chemicals | 1 | $45B |
|
||
| Automotive Retail | 1 | $29B |
|
||
| Healthcare / Medical Devices | 1 | $23B |
|
||
| Automotive Technology | 1 | $20B |
|
||
Price history
-17.5% since first listed4 events — show timeline
- 2025-09-23 Price Changed $99,000 MiRealSource-MiMLS
- 2025-09-22 Price Changed $99,000 UPAR
- 2025-09-03 Listed $120,000 UPAR
- 2025-09-03 Listed $120,000 MiRealSource-MiMLS
Property tax history
+4.3%/yrLatest (2025): $1,773 · -23.0% YoY. Source: county tax records.
Cash-flow waterfall
monthlySold comps — $/sqft
last 12 mo · ≤1 miLoading sold comps…