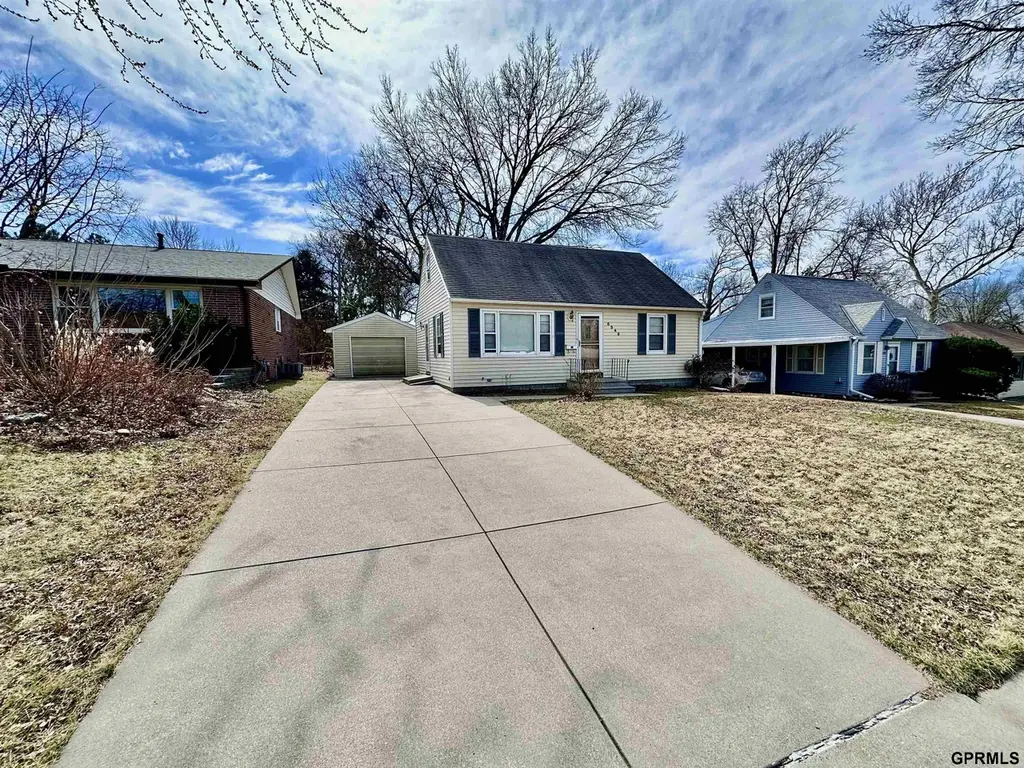
5345 Franklin St · Lincoln, NE
Flood risk 1/10 · Minimal
- FEMA flood zone
- X (unshaded)
- Chance of flooding over 30 yrs
- 0.0%
- Est. flood insurance / yr
- $473 – $860
Fire risk 1/10 · Minimal
- Est. fire insurance / yr
- $1,161 – $2,155
Heat risk 3/10 · Minor
- Hot days now (above 104°F)
- 7 days/yr
- Hot days in 30 yrs
- 15 days/yr
Wind risk 2/10 · Minimal
- Chance of severe wind over 30 yrs
- —
Air-quality risk 1/10 · Minimal
- Unhealthy air days now
- 0 days/yr
- Unhealthy air days in 30 yrs
- 0 days/yr
Risk factors via First Street. Map © Google.
Why this score? — see what drove the D+ grade
The composite is a weighted blend of 9 inputs, each scored 0–100. Each bar is that input's sub-score; the figure is the points it added to the 100-point composite (weight × sub-score).
- ARV discount +14.7/15.0
- Cash flow +12.6/30.0
- Schools +4.4/10.0
- Livability +4.2/5.0
- DSCR +3.8/10.0
- 1% rule +3.4/10.0
- Rent growth +3.4/5.0
- Condition / age +2.5/5.0
- Appreciation +0.0/10.0
$219,900
🖨 Deal sheet (PDF) 📄 Offer letter ✓ Due diligence
Listing remarks MLS
An attractive tree-lined street welcomes all to a pampered 3 bdrm/2 bath area home in SE Lincoln. This maintenance-free exterior, 1-1/2 story home ffers hardwood flooring in main floor bdrms and under the LR/hallway carpets. All appliances are included. There are some new windows, new doors, and newer cement leading to an over-sized detached garage. The owners have utilized professional lawn care. A spacious family room, .75 bath, office, workshop and storage space complete the basement. This home has been wonderfully maintained by the same owners for decades!
Key facts
- 5,663 sq ft lot
- Garage
- Built 1952
Neighborhood map
What this means for you Summary
Snapshot
- This is a 3-bed/1.0-bath single-family listed at $220k.
Deal economics
- At list price, monthly cash flow is $-29 ($-345/yr) — negative.
- To cash-flow at today's rent, offer at most $215k (2.3% below list).
- To meet the 1% rule (rent ≥ 1% of price), the offer needs to be $185k (15.9% below list).
- Recommended offer: $185k (15.9% below list) — sets the bar for 1% rule.
- Cap rate 6.1% vs local median 3.0% in Lincoln — top-decile yield for the area; either an underpriced asset or a hidden risk that comps aren't pricing in. Stress-test before assuming the spread holds.
Location & tenants
- Location reads 85/100 on livability (#5 in NE, #545 nationally) — a professional / high-income tenant draw. Strengths: amenities A+, cost of living A+, housing A+; Watch: crime D+.
- Lincoln Public Schools (urban): math 50% / reading 53% proficiency, ranked #59 of 111 in NE (top 53%) — acceptable for families but not a draw, mixed tenant base, ~2y average lease.
- Zoned schools: Holmes Elementary School (math 47% / reading 62%, grade C, #161 of 502 statewide, top 38%, 409 students, 56% FRL); Lefler Middle School (math 46% / reading 45%, grade D+, #63 of 128 statewide, top 50%, 613 students, 61% FRL); Lincoln Southeast High School (math 51% / reading 52%, grade D+, #105 of 261 statewide, top 40%, 1,929 students, 16% FRL).
- Market conditions: Rents rising (+3.7%/yr); 156 active listings in the ZIP; 4 comparable units currently listed for rent nearby; rentals lingering (median 45d on market — plan ~5-8 weeks vacancy on turnover, expect pricing pressure); 50% of comp listings sitting > 30 days — soft ceiling on asking rent; 1,940 units permitted in Lancaster County in 2024 (895 in 5+ unit buildings).
- This rent runs 31% of the median local income ($73k/yr) — at the standard rent-burdened threshold; future hikes will face affordability resistance.
Forward outlook
- Local home prices are declining (-3.0%/yr); year-one equity from $2k of loan paydown is wiped out by about $7k of value loss. Plan a longer hold.
- Lancaster County population projected at +37% by 2050 — long-run rental-demand tailwind backs the buy-and-hold thesis.
Negotiation context
- It's been on market 16 days — a 2% lower offer ($217k) is reasonable based on typical stale-listing flexibility.
- 3 sale attempts since 12y ago with the ask held roughly flat each time — persistent listings suggest the price (not the market) is what's stuck; bring a comps-based counter.
- Current owner paid $106k; list at $220k implies a 107% gain — meaningful room to come down on a strong offer.
Risks & watch-outs
- Watch-outs: built in 1952 — expect roof / HVAC / electrical / plumbing capex.
Questions for the listing agent
- What do current leases actually rent for vs. the listed asking? Can we see a recent rent roll and the last 12 months of T-12 income?
- Built in 1952 — when were the roof, HVAC, electrical panel, plumbing, and water heater last replaced?
- Is there a deadline driving the sale (1031 exchange, divorce, estate, relocation)? That informs how much negotiation room exists.
- Schools are A-rated — typically a magnet for longer-tenancy family renters. What's the average tenant stay here, and is there a school-zone premium baked into asking?
- Crime grade is D in this area — have there been break-ins, vandalism, or insurance claims at this property in the last 3 years? What carrier currently insures it and at what premium?
- The area grade is low — what's the realistic commute time and amenity access for the typical tenant pool here? Any planned neighborhood developments (good or bad) we should know about?
- What's the average days-on-market for RENTAL listings here right now (not sales)? A rising rental-DOM trend means longer vacancies and softer asking-rent achievability than the comps imply.
- What's the recent tenant-quality profile in this submarket — average credit score on applications, eviction rate, late-payment / NSF rate, and stable-employment percentage? A property-management company in the area should have these aggregated.
- How much new for-sale + rental construction is in the pipeline within 1–3 miles? Heavy new supply typically softens prices + rents 12–24 months out; constrained supply supports both.
Investment metrics
- 1% rule
- 0.84% ✗
- Cap rate
- 6.14%
- Cash-on-cash
- -0.56%
- DSCR
- 0.98
- GRM
- 9.9
CMA / ARV
- ARV (on-the-fly)
- $261,562
- Comps found
- 12
Show comp detail 12 sales within ~0.75 mi
| Address | Dist | Beds/Ba | Sqft | Sold | Price | $/sf | Match |
|---|---|---|---|---|---|---|---|
| 5510 Sumner St | 0.17mi | 3/2.0 | 1,670 (+0%) | 2mo | $255,000 | $153 | 86 |
| 5625 South St | 0.22mi | 2/2.0 (-1) | 1,608 (-4%) | 2mo | $150,000 | $93 | 73 |
| 5448 Oldham St | 0.11mi | 4/2.0 (+1) | 1,516 (-9%) | 1mo | $259,900 | $171 | 70 |
| 5530 Normal Blvd | 0.36mi | 3/1.5 | 1,572 (-6%) | 3mo | $211,000 | $134 | 70 |
| 5601 Glade St | 0.34mi | 3/2.0 | 1,525 (-8%) | 1mo | $275,000 | $180 | 65 |
| 2340 S 58th St | 0.46mi | 3/2.0 | 1,765 (+6%) | 1mo | $274,000 | $155 | 64 |
| 5428 Normal Blvd | 0.33mi | 2/2.0 (-1) | 1,556 (-7%) | 3mo | $237,500 | $153 | 62 |
| 5046 Normal Blvd | 0.39mi | 3/2.0 | 1,830 (+10%) | 3mo | $230,000 | $126 | 59 |
| 2131 S 60th St | 0.47mi | 2/1.5 (-1) | 1,525 (-8%) | 3mo | $239,900 | $157 | 55 |
| 2645 S 55th St | 0.56mi | 2/1.5 (-1) | 1,545 (-7%) | 1mo | $265,000 | $172 | 54 |
| 1645 48th St | 0.41mi | 2/1.5 (-1) | 1,452 (-13%) | 0mo | $238,000 | $164 | 52 |
| 1319 S 49th St | 0.54mi | 2/2.0 (-1) | 1,464 (-12%) | 2mo | $230,000 | $157 | 44 |
Match score weights: distance 35% · size 25% · config 20% · recency 20%. Top-matched comps best support the ARV.
Projected returns pro-forma
-3.0% appreciation · 3.67% rent growth · sell at horizon
- IRR
- -16.5%
- Equity multiple
- 0.41×
- Total profit
- $-36,201
- Equity at exit
- $32,788
- IRR
- -7.1%
- Equity multiple
- 0.54×
- Total profit
- $-28,622
- Equity at exit
- $19,013
Cash invested: $61,572 (down + closing). Projections, not guarantees.
Landlord ↔ Tenant lean methodology
- Overall (STATE)
- 83 Strongly Landlord-Friendly
- State Nebraska
- 83 Strongly Landlord-Friendly · R+13
- County
- — inherits STATE
- City
- — inherits STATE
ZIP-level market 68506
- Rents YoY
- 3.7%
- Active inventory
- 156
- Price-to-rent
- 9.9×
Monthly cashflow live
- Estimated rent
- $1,850 medium interval (Pro) →
- Mortgage (P&I)
- −$1,153
- Tax from tax record
- −$245 /mo · $2,941/yr
- Insurance
- −$92
- HOA
- −$0
- Vacancy / Maint / Mgmt
- −$388
- Net cashflow
- $-29
Break-even live
Sensitivity live
| Price | -10% $96 | -5% $33 | +0% $-29 | +5% $-91 | +10% $-153 |
|---|---|---|---|---|---|
| Rent | -10% $-175 | -5% $-102 | +0% $-29 | +5% $44 | +10% $117 |
| Rate | -1.0pp $82 | -0.5pp $27 | base $-29 | +0.5pp $-86 | +1.0pp $-144 |
UW: 25.0% down · 7.5% · 30yr · 1.5% tax · 5.0% vac · 8.0% maint · 8.0% mgmt
Financing live
Cash to close
- Down payment
- $54,975
- Closing costs
- $6,597
- Reserves months
- —
- Total cash needed
- —
Loan-product check · same deal, 3 products live
Conventional
25% down · 7.5% · 30yr
- Down + closing
- —
- Monthly P&I
- —
- Monthly cashflow
- —
- DSCR
- —
- Eligible?
- —
Personal DTI + credit; lowest rate.
DSCR
20% down · 8.5% · 30yr
- Down + closing
- —
- Monthly P&I
- —
- Monthly cashflow
- —
- DSCR
- —
- Eligible?
- —
No personal income docs; deal must DSCR.
Hard money
10% down · 12.0% · 12mo
- Down + closing
- —
- Monthly P&I
- —
- Monthly cashflow
- —
- DSCR
- —
- Eligible?
- —
Short-term bridge; refi at stabilization.
Rent comps 4 comps
| Address | Beds | Baths | Sqft | Rent | $/sqft | DOM | Units | Dist |
|---|---|---|---|---|---|---|---|---|
| 5505 Sumner St Lincoln, NE | 3.0 | 2.0 | 1600 | $1,950 | $1.22 | 22d | 1 | 0.18mi |
| 5218 High St Lincoln, NE | 4.0 | 1.5 | 1769 | $1,899 | $1.07 | 45d | 1 | 0.85mi |
| 4125 High St Lincoln, NE | 3.0 | 1.5 | 1600 | $1,950 | $1.22 | 22d | 1 | 1.14mi |
| 1042 Rockhurst Dr Lincoln, NE | 3.0 | 2.5 | 1688 | $2,495 | $1.48 | 45d | 1 | 1.18mi |
Listing history 8 events
-
2026-04-20status Pending
-
2026-04-09status Back On Market
-
2026-03-28status Pending
-
2026-03-23$219,900 New
-
2014-08-08soldstatus $106,000 566-char remark
Show marketing remark (566 chars)
An attractive tree-lined street welcomes all to a pampered 3 bdrm/2 bath area home in SE Lincoln. This maintenance-free exterior, 1-1/2 story home ffers hardwood flooring in main floor bdrms and under the LR/hallway carpets. All appliances are included. There are some new windows, new doors, and newer cement leading to an over-sized detached garage. The owners have utilized professional lawn care. A spacious family room, .75 bath, office, workshop and storage space complete the basement. This home has been wonderfully maintained by the same owners for decades!
-
2014-08-08soldstatus $106,000
Show marketing remark (566 chars)
An attractive tree-lined street welcomes all to a pampered 3 bdrm/2 bath area home in SE Lincoln. This maintenance-free exterior, 1-1/2 story home ffers hardwood flooring in main floor bdrms and under the LR/hallway carpets. All appliances are included. There are some new windows, new doors, and newer cement leading to an over-sized detached garage. The owners have utilized professional lawn care. A spacious family room, .75 bath, office, workshop and storage space complete the basement. This home has been wonderfully maintained by the same owners for decades!
-
2014-07-24historical 566-char remark
Show marketing remark (566 chars)
An attractive tree-lined street welcomes all to a pampered 3 bdrm/2 bath area home in SE Lincoln. This maintenance-free exterior, 1-1/2 story home ffers hardwood flooring in main floor bdrms and under the LR/hallway carpets. All appliances are included. There are some new windows, new doors, and newer cement leading to an over-sized detached garage. The owners have utilized professional lawn care. A spacious family room, .75 bath, office, workshop and storage space complete the basement. This home has been wonderfully maintained by the same owners for decades!
-
2014-06-11$114,900 566-char remark
Show marketing remark (566 chars)
An attractive tree-lined street welcomes all to a pampered 3 bdrm/2 bath area home in SE Lincoln. This maintenance-free exterior, 1-1/2 story home ffers hardwood flooring in main floor bdrms and under the LR/hallway carpets. All appliances are included. There are some new windows, new doors, and newer cement leading to an over-sized detached garage. The owners have utilized professional lawn care. A spacious family room, .75 bath, office, workshop and storage space complete the basement. This home has been wonderfully maintained by the same owners for decades!
ⓘ Source: listings_history table (triggers on properties + properties_extension) + one-shot
backfill from property_details.listing_events for pre-trigger history.
Tax reassessment forecast NE · Resets to sale price
- Current annual tax
- $2,941 · $245/mo
- Projected year-2 tax
- $3,804 · $317/mo
- Expected delta
- +$863/yr (+$72/mo · 29.3%)
ⓘ Screening estimate from a state-policy table — verify with the county assessor before closing.
Climate risk First Street
- Flood 1/10 Low FEMA zone X (unshaded) · 0% chance over 30 yrs
- Wildfire 1/10 Low
- Heat 3/10 Moderate 7 d/yr ≥104°F today · 15 d/yr by 30 yrs out
- Wind 2/10 Low
- Air quality 1/10 Low 0 unhealthy d/yr today · 0 by 30 yrs out
Nearby sold comps map
Loading sold comps map…
Walkable amenities ~0.75 mi
Loading nearby amenities…
Taxation est. · year 1
- Rental income
- $22,194
- − Mortgage interest
- −$12,318
- − Property taxes
- −$2,941
- − Insurance
- −$1,100
- − Repairs & maintenance
- −$1,776
- − Management
- −$1,776
- − Depreciation
- −$6,397
- Taxable loss
- −$4,112
- Est. tax savings @ 24.0%
- +$987
- After-tax cash flow
- $642/yr
For passive investors: Depreciation is non-cash, so a rental often shows a tax loss while cash-flowing — sheltering income. Rental losses are passive: they offset passive income freely, and up to $25,000/yr can offset ordinary (W-2) income if you actively participate and your MAGI is under $100k (phasing out to $0 by $150k); unused losses carry forward. On sale, claimed depreciation is recaptured at up to 25%, and gains may owe capital-gains tax (a 1031 exchange can defer both). Figures are a year-1 estimate at your 24.0% rate — not tax advice; consult a CPA.
Schools (NCES district)
- District
- Lincoln Public Schools
- NCES district ID
- 3172840
- Math proficiency
- 50% ▼ -6.00%
- Reading proficiency
- 53% ▼ -3.00%
- Median HH income
- $50,273
- Composite
- 44.05/100
- National rank
- #2880
- State rank
- #59 of 111 in NE
Livability — Lincoln
- Score
- 85/100
- State rank
- #5
- US rank
- #545
Category grades
Schools grade is shown separately in the Schools card above.
Census & demographics
- Census place
- Lincoln, NE
- County
- Lancaster County · 291,509 people
- City population
- 291,509
- Metro
- Lincoln, NE
- Population (ZIP)
- 27,531
- Household income
- $72,637
- Rent vs Own
- Severe rent burden
- 1150.0
Population outlook (Lancaster County) Hauer SSP2
- Today (2025)
- 352,806 people
- By 2030
- 377,899 · +7.1%
- By 2040
- 428,582 · +21.5%
- By 2050
- 483,103 · +36.9%
- By 2075
- 632,390 · +79.2%
- By 2100
- 759,513 · +115.3%
Race, ethnicity, and origin ACS 2023
- Neighborhood character
- Predominantly White (81%)
- Race & ethnicity
- White 81% Hispanic / Latino 8% Two or more races 6% Asian 3% Black 1% Native American 1%
- Hispanic origin (detail)
- Mexican 5%
- Common ancestry
- Lithuanian 2% Portuguese 2% Italian 2%
- Foreign-born
- 7% · Canada, China, Philippines
- Languages at home
- 89% English-only · Spanish 4% Other Asian/Pacific 1% Chinese 1%
Political lean MEDSL · Lancaster
- 2024 margin
- Toss-up / Even · D 51.4% · R 47.1% · Other 1.5%
- 2008→2024 swing
- -0.7pp no change · 2008: 5.0pp · 2024: 4.3pp
- All cycles
- 2024: D+4.3 2020: D+7.8 2016: D+0.1 2012: R+1.0 2008: D+5.0
Not yet ingested
- Civics
- —
Market trends
- HPI YoY
- ▼ -253.20%
- Current HPI
- 234.2428
- Rent YoY
- ▲ 3.67%
- Metro
- Lincoln, NE
- State GDP YoY
- ▲ 0.68%
- F500 in state
- 2
Industry mix (Fortune 500 HQ in NE)
| Industry | F500 HQs | Revenue |
|---|---|---|
| Conglomerate | 1 | $371B |
|
||
Price history
+91.4% since first listed8 events — show timeline
- 2026-04-20 Pending — GPRMLS
- 2026-04-09 Relisted — GPRMLS
- 2026-03-28 Pending — GPRMLS
- 2026-03-23 Listed $219,900 GPRMLS
- 2014-08-08 Sold (Public Records) $106,000 Public Records
- 2014-08-08 Sold (MLS) $106,000 GPRMLS
- 2014-07-24 Listing Removed — GPRMLS
- 2014-06-11 Listed $114,900 GPRMLS
Property tax history
+2.7%/yrLatest (2025): $2,941 · +6.2% YoY. Source: county tax records.
Cash-flow waterfall
monthlySold comps — $/sqft
last 12 mo · ≤1 miLoading sold comps…