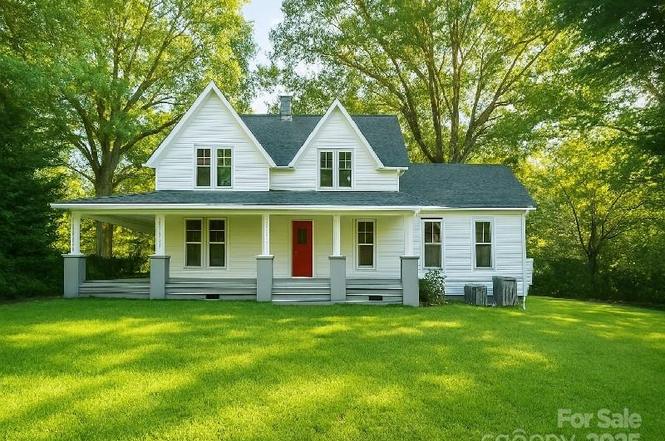
310 E Church St · Troutman, NC
Flood risk 1/10 · Minimal
- FEMA flood zone
- X (unshaded)
- Chance of flooding over 30 yrs
- 0.0%
- Est. flood insurance / yr
- $507 – $1,088
Fire risk 2/10 · Minimal
- Est. fire insurance / yr
- $906 – $1,684
Heat risk 5/10 · Moderate
- Hot days now (above 103°F)
- 7 days/yr
- Hot days in 30 yrs
- 17 days/yr
Wind risk 3/10 · Minor
- Chance of severe wind over 30 yrs
- 5.0%
Air-quality risk 3/10 · Minor
- Unhealthy air days now
- 3 days/yr
- Unhealthy air days in 30 yrs
- 5 days/yr
Risk factors via First Street. Map © Google.
Why this score? — see what drove the C- grade
The composite is a weighted blend of 9 inputs, each scored 0–100. Each bar is that input's sub-score; the figure is the points it added to the 100-point composite (weight × sub-score).
- Cash flow +15.1/30.0
- ARV discount +15.0/15.0
- DSCR +4.6/10.0
- Schools +4.5/10.0
- 1% rule +3.4/10.0
- Livability +3.2/5.0
- Rent growth +3.0/5.0
- Condition / age +2.5/5.0
- Appreciation +0.0/10.0
$305,000
🖨 Deal sheet (PDF) 📄 Offer letter ✓ Due diligence
Listing remarks
Amazing Farm House in Troutman, NC. This updated 4 bedroom and 3 bath home with a wrap around porch sits on just under an acre of land. The main level boasts a living room, den, formal dining room and an nice sized kitchen. The primary suite is on the main level with a walk in closet and barn door. There is an additional full bath on the main level for guests. The upper level has 3 bedrooms and office/sunroom and the 3rd full bathroom. See offer instructions in the agent only comments.
Key facts
- Wrap around porch
- Barn door
- Walk in closet
Tags
Property features AI
Finance
- HOA & community: No HOA
Exterior
- Parking: No main-level garage; Other parking details referenced in remarks
- Utilities: Public water with additional details noted in remarks; Public sewer with additional details noted in remarks
- Home design: Single-family residence (residential); Two levels
- Construction: Site-built construction; Vinyl siding with additional materials noted in remarks; Crawl space foundation
- Exterior features: Lot includes additional features noted in remarks; Road surface is paved and other types
Interior
- Kitchen: Dishwasher; Electric range
- Bedrooms: 4 bedrooms total — 1 on the main level, 3 on the upper level
- Bathrooms: 3 full bathrooms — 2 on the main level, 1 on the upper level
- Heating & cooling: Forced air heating; Central air conditioning
- Interior features: 9 total rooms; Forced air heating with additional unspecified system; Central air conditioning with additional unspecified system
- Laundry & utility: Laundry area with additional details noted in remarks
Neighborhood map
What this means for you Summary
Snapshot
- This is a 4-bed/1.5-bath single-family listed at $305k.
Deal economics
- At list price, monthly cash flow is $98 ($1k/yr) — positive.
- The deal already cash-flows at list — no discount required.
- To meet the 1% rule (rent ≥ 1% of price), the offer needs to be $257k (15.7% below list).
- Recommended offer: $257k (15.7% below list) — sets the bar for 1% rule.
- Cap rate 6.7% vs local median 3.1% in Troutman — top-decile yield for the area; either an underpriced asset or a hidden risk that comps aren't pricing in. Stress-test before assuming the spread holds.
Location & tenants
- Location reads 64/100 on livability (#342 in NC) — a middle-class / working-renter tenant base. Strengths: housing A+, cost of living A-; Watch: amenities F, commute F, health & safety F.
- Iredell-Statesville Schools (rural): math 53% / reading 52% proficiency, ranked #51 of 178 in NC (top 29%) — acceptable for families but not a draw, mixed tenant base, ~2y average lease.
- Zoned schools: Troutman Elementary (math 63% / reading 44%, grade C, #335 of 1,410 statewide, top 24%, 698 students, 54% FRL); The Brawley School (math 91% / reading 88%, grade A+, #2 of 475 statewide, top 0%, 639 students, 9% FRL); South Iredell High (math 47% / reading 72%, grade C+, #216 of 535 statewide, top 43%, 1,711 students, 34% FRL).
- Zoned-school proficiency averages 68% at this address vs 52% district-wide (+15 pts) — the actual schools serving this property are materially stronger than the Iredell-Statesville Schools average implies; a family-tenant draw the district grade alone would hide.
- Market conditions: Rents rising (+2.1%/yr); 265 active listings in the ZIP; 5 comparable units currently listed for rent nearby; rentals leasing fast (median 7d on market — plan ~1-2 weeks tenant-placement turnaround); solid renter incomes; 1,955 units permitted in Iredell County in 2024 (128 in 5+ unit buildings).
Forward outlook
- Local home prices are declining (-3.0%/yr); year-one equity from $2k of loan paydown is wiped out by about $9k of value loss. Plan a longer hold.
- Iredell County population projected at +26% by 2050 — long-run rental-demand tailwind backs the buy-and-hold thesis.
Negotiation context
- It's been on market 307 days — a 12% lower offer ($268k) is reasonable based on typical stale-listing flexibility.
- 4 sale attempts since 4y ago; this cycle's ask has dropped $80k (21%) from the opening price — seller is motivated, your offer sets the floor, not the list.
- Current owner paid $150k; list at $305k implies a 103% gain — meaningful room to come down on a strong offer.
Risks & watch-outs
- Watch-outs: built in 1886 — expect roof / HVAC / electrical / plumbing capex.
- Climate carrying-cost: extreme-heat days projected 7→17/yr by 2055 (HVAC capex compounding) — expect insurance premiums to compound above CPI over the hold.
Questions for the listing agent
- It's been on market 307 days. Have you received any prior offers? Is the seller open to a 16% concession, seller financing, or rate buy-down credit?
- Built in 1886 — when were the roof, HVAC, electrical panel, plumbing, and water heater last replaced?
- Why hasn't it sold? Are there any deal-killer items the seller is aware of (foundation, flood, title, zoning, code violations)?
- Is there a deadline driving the sale (1031 exchange, divorce, estate, relocation)? That informs how much negotiation room exists.
- Schools are F-rated, which usually means shorter tenancies and higher turnover. Who's the typical renter profile here, and what's been the actual vacancy rate?
- What's the average days-on-market for RENTAL listings here right now (not sales)? A rising rental-DOM trend means longer vacancies and softer asking-rent achievability than the comps imply.
- What's the recent tenant-quality profile in this submarket — average credit score on applications, eviction rate, late-payment / NSF rate, and stable-employment percentage? A property-management company in the area should have these aggregated.
- How much new for-sale + rental construction is in the pipeline within 1–3 miles? Heavy new supply typically softens prices + rents 12–24 months out; constrained supply supports both.
Investment metrics
- 1% rule
- 0.84% ✗
- Cap rate
- 6.68%
- Cash-on-cash
- 1.38%
- DSCR
- 1.06
- GRM
- 9.9
CMA / ARV
- ARV (on-the-fly)
- $374,919
- Comps found
- 12
Show comp detail 12 sales within ~0.75 mi
| Address | Dist | Beds/Ba | Sqft | Sold | Price | $/sf | Match |
|---|---|---|---|---|---|---|---|
| 161 Astor St | 0.40mi | 5/3.0 (+1) | 2,577 (-3%) | 1mo | $375,000 | $146 | 65 |
| 236 Cassius Dr | 0.44mi | 5/3.0 (+1) | 2,577 (-3%) | 4mo | $350,000 | $136 | 60 |
| 134 Arden Ct | 0.39mi | 5/3.0 (+1) | 2,577 (-3%) | 7mo | $349,999 | $136 | 59 |
| 142 Arden Ct | 0.42mi | 5/3.0 (+1) | 2,577 (-3%) | 6mo | $373,319 | $145 | 59 |
| 213 Cassius Dr | 0.48mi | 5/3.0 (+1) | 2,577 (-3%) | 3mo | $363,999 | $141 | 59 |
| 210 Astor St | 0.48mi | 5/3.0 (+1) | 2,577 (-3%) | 3mo | $364,999 | $142 | 59 |
| 214 Astor St | 0.49mi | 5/3.0 (+1) | 2,577 (-3%) | 3mo | $358,000 | $139 | 59 |
| 222 Astor St | 0.51mi | 5/3.0 (+1) | 2,577 (-3%) | 2mo | $363,000 | $141 | 58 |
| 221 Astor St | 0.52mi | 5/3.0 (+1) | 2,577 (-3%) | 2mo | $369,500 | $143 | 58 |
| 137 Arden Ct | 0.40mi | 5/3.0 (+1) | 2,577 (-3%) | 8mo | $344,999 | $134 | 58 |
| 149 Astor St | 0.35mi | 5/3.5 (+1) | 2,577 (-3%) | 9mo | $339,999 | $132 | 58 |
| 119 Era St | 0.67mi | 3/2.5 (-1) | 2,860 (+8%) | 10mo | $585,000 | $205 | 39 |
Match score weights: distance 35% · size 25% · config 20% · recency 20%. Top-matched comps best support the ARV.
Projected returns pro-forma
-3.0% appreciation · 2.13% rent growth · sell at horizon
- IRR
- -15.0%
- Equity multiple
- 0.47×
- Total profit
- $-45,467
- Equity at exit
- $45,476
- IRR
- -7.9%
- Equity multiple
- 0.52×
- Total profit
- $-40,813
- Equity at exit
- $26,371
Cash invested: $85,400 (down + closing). Projections, not guarantees.
Landlord ↔ Tenant lean methodology
- Overall (STATE)
- 85 Strongly Landlord-Friendly
- State North Carolina
- 85 Strongly Landlord-Friendly · R+3
- County
- — inherits STATE
- City
- — inherits STATE
ZIP-level market 28166
- Home prices YoY
- -23.7%
- Rents YoY
- 2.1%
- Active inventory
- 265
- Price-to-rent
- 9.9×
Monthly cashflow live
- Estimated rent
- $2,572 high interval (Pro) →
- Mortgage (P&I)
- −$1,599
- Tax from tax record
- −$207 /mo · $2,482/yr
- Insurance
- −$127
- HOA
- −$0
- Vacancy / Maint / Mgmt
- −$540
- Net cashflow
- $98
Break-even live
Sensitivity live
| Price | -10% $271 | -5% $185 | +0% $98 | +5% $12 | +10% $-74 |
|---|---|---|---|---|---|
| Rent | -10% $-105 | -5% $-3 | +0% $98 | +5% $200 | +10% $301 |
| Rate | -1.0pp $252 | -0.5pp $176 | base $98 | +0.5pp $19 | +1.0pp $-61 |
UW: 25.0% down · 7.5% · 30yr · 1.5% tax · 5.0% vac · 8.0% maint · 8.0% mgmt
Financing live
Cash to close
- Down payment
- $76,250
- Closing costs
- $9,150
- Reserves months
- —
- Total cash needed
- —
Loan-product check · same deal, 3 products live
Conventional
25% down · 7.5% · 30yr
- Down + closing
- —
- Monthly P&I
- —
- Monthly cashflow
- —
- DSCR
- —
- Eligible?
- —
Personal DTI + credit; lowest rate.
DSCR
20% down · 8.5% · 30yr
- Down + closing
- —
- Monthly P&I
- —
- Monthly cashflow
- —
- DSCR
- —
- Eligible?
- —
No personal income docs; deal must DSCR.
Hard money
10% down · 12.0% · 12mo
- Down + closing
- —
- Monthly P&I
- —
- Monthly cashflow
- —
- DSCR
- —
- Eligible?
- —
Short-term bridge; refi at stabilization.
Rent comps 5 comps
| Address | Beds | Baths | Sqft | Rent | $/sqft | DOM | Units | Dist |
|---|---|---|---|---|---|---|---|---|
| 248 Mills Ave Troutman, NC | 4.0 | 3.0 | 2134 | $2,350 | $1.10 | 25d | 1 | 0.40mi |
| 173 Calvin Creek Dr Troutman, NC | 5.0 | 3.0 | 2556 | $2,805 | $1.10 | 14d | 1 | 1.17mi |
| 118 Wembury Ln Troutman, NC | 5.0 | 2.5 | 2384 | $2,455 | $1.03 | 6d | 1 | 1.24mi |
| 123 Wembury Ln Troutman, NC | 4.0 | 2.5 | 1800 | $2,210 | $1.23 | 6d | 1 | 1.28mi |
| 138 Wembury Ln Troutman, NC | 4.0 | 2.5 | 1800 | $2,155 | $1.20 | 0d | 1 | 1.29mi |
Listing history 27 events
-
2026-06-21days on market $305,000 Active 307 DOM
-
2026-06-18days on market $305,000 Active 304 DOM
-
2026-06-17days on market $305,000 Active 303 DOM
-
2026-06-16days on market $305,000 Active 302 DOM
-
2026-06-15days on market $305,000 Active 301 DOM
-
2026-06-13days on market $305,000 Active 299 DOM
-
2026-06-13days on market $305,000 Active 298 DOM
-
2026-06-09days on market $305,000 Active 295 DOM
-
2026-06-08days on market $305,000 Active 294 DOM
-
2026-06-07days on market $305,000 Active 293 DOM
-
2026-03-10price $305,000
-
2026-01-07price $329,900
-
2025-10-23price $349,900
-
2025-09-05price $374,900
-
2025-08-12$384,900 Active
-
2025-01-21price $280,000
-
2025-01-21price $280,000
-
2025-01-08price $299,900
-
2024-12-27$319,900 Active
-
2024-03-13price $415,000
-
2024-02-11$429,999 Active
-
2024-02-08historical
-
2022-05-25price $2,200
-
2022-03-26$399,000 Active
-
2022-03-11historical
-
2021-10-05soldstatus $150,000
-
1995-09-01soldstatus $79,000
ⓘ Source: listings_history table (triggers on properties + properties_extension) + one-shot
backfill from property_details.listing_events for pre-trigger history.
Tax reassessment forecast NC · Resets to sale price
- Current annual tax
- $2,482 · $207/mo
- Projected year-2 tax
- $2,501 · $208/mo
- Expected delta
- +$19/yr (+$2/mo · 0.8%)
ⓘ Screening estimate from a state-policy table — verify with the county assessor before closing.
Climate risk First Street
- Flood 1/10 Low FEMA zone X (unshaded) · 0% chance over 30 yrs
- Wildfire 2/10 Low
- Heat 5/10 Major 7 d/yr ≥103°F today · 17 d/yr by 30 yrs out
- Wind 3/10 Moderate 5% chance of damaging wind over 30 yrs
- Air quality 3/10 Moderate 3 unhealthy d/yr today · 5 by 30 yrs out
Nearby sold comps map
Loading sold comps map…
Walkable amenities ~0.75 mi
Loading nearby amenities…
Taxation est. · year 1
- Rental income
- $30,859
- − Mortgage interest
- −$17,085
- − Property taxes
- −$2,482
- − Insurance
- −$1,525
- − Repairs & maintenance
- −$2,469
- − Management
- −$2,469
- − Depreciation
- −$8,873
- Taxable loss
- −$4,042
- Est. tax savings @ 24.0%
- +$970
- After-tax cash flow
- $2,149/yr
For passive investors: Depreciation is non-cash, so a rental often shows a tax loss while cash-flowing — sheltering income. Rental losses are passive: they offset passive income freely, and up to $25,000/yr can offset ordinary (W-2) income if you actively participate and your MAGI is under $100k (phasing out to $0 by $150k); unused losses carry forward. On sale, claimed depreciation is recaptured at up to 25%, and gains may owe capital-gains tax (a 1031 exchange can defer both). Figures are a year-1 estimate at your 24.0% rate — not tax advice; consult a CPA.
Schools (NCES district)
- District
- Iredell-Statesville Schools
- NCES district ID
- 3702310
- Math proficiency
- 53% ▲ 8.00%
- Reading proficiency
- 52% ▲ 4.00%
- Median HH income
- $51,201
- Composite
- 44.98/100
- National rank
- #2703
- State rank
- #51 of 178 in NC
Livability — Troutman
- Score
- 64/100
- State rank
- #342
- US rank
- #13725
Category grades
Schools grade is shown separately in the Schools card above.
Census & demographics
- Census place
- Troutman, NC
- County
- Iredell County · 182,638 people
- City population
- 11,875
- Metro
- Charlotte-Concord-Gastonia, NC-SC
- Population (ZIP)
- 11,875
- Household income
- $93,511
- Rent vs Own
- Severe rent burden
- 167.0
Population outlook (Iredell County) Hauer SSP2
- Today (2025)
- 194,510 people
- By 2030
- 206,171 · +6.0%
- By 2040
- 227,781 · +17.1%
- By 2050
- 245,102 · +26.0%
- By 2075
- 280,896 · +44.4%
- By 2100
- 294,375 · +51.3%
Race, ethnicity, and origin ACS 2023
- Neighborhood character
- Predominantly White (76%)
- Race & ethnicity
- White 76% Black 15% Hispanic / Latino 6% Two or more races 4% Asian 1%
- Hispanic origin (detail)
- Mexican 3% Puerto Rican 1%
- Common ancestry
- Serbian 2% Italian 2% Slovak 2%
- Foreign-born
- 3% · Canada
- Languages at home
- 96% English-only · Spanish 3% Other Asian/Pacific 1%
Political lean MEDSL · Iredell
- 2024 margin
- Solid R (+32.6) · D 33.2% · R 65.8%
- 2008→2024 swing
- -8.2pp toward R · 2008: -24.4pp · 2024: -32.6pp
- All cycles
- 2024: R+32.6 2020: R+32.4 2016: R+36.8 2012: R+30.5 2008: R+24.4
Not yet ingested
- Civics
- —
Market trends
- HPI YoY
- ▼ -71.32%
- Current HPI
- 229.5993
- Rent YoY
- ▲ 2.13%
- Metro
- Charlotte-Concord-Gastonia, NC-SC
- State GDP YoY
- ▲ 3.28%
- F500 in state
- 26
Industry mix (Fortune 500 HQ in NC)
| Industry | F500 HQs | Revenue |
|---|---|---|
| Financial Services | 2 | $213B |
|
||
| Retail | 2 | $95B |
|
||
| Industrial Conglomerate | 1 | $38B |
|
||
| Metals / Steel | 1 | $35B |
|
||
| Utilities | 1 | $30B |
|
||
| Industrial Machinery | 1 | $19B |
|
||
Price history
+286.1% since first listed17 events — show timeline
- 2026-03-10 Price Changed $305,000 CANOPYMLS as Distributed by MLS Grid
- 2026-01-07 Price Changed $329,900 CANOPYMLS as Distributed by MLS Grid
- 2025-10-23 Price Changed $349,900 CANOPYMLS as Distributed by MLS Grid
- 2025-09-05 Price Changed $374,900 CANOPYMLS as Distributed by MLS Grid
- 2025-08-12 Listed $384,900 CANOPYMLS as Distributed by MLS Grid
- 2025-01-21 Price Changed $280,000 Triad MLS
- 2025-01-21 Price Changed $280,000 CANOPYMLS as Distributed by MLS Grid
- 2025-01-08 Price Changed $299,900 Triad MLS
- 2024-12-27 Listed $319,900 CANOPYMLS as Distributed by MLS Grid
- 2024-03-13 Price Changed $415,000 CANOPYMLS as Distributed by MLS Grid
- 2024-02-11 Listed $429,999 CANOPYMLS as Distributed by MLS Grid
- 2024-02-08 Coming Soon — CANOPYMLS as Distributed by MLS Grid
- 2022-05-25 Price Changed $2,200 RENT.
- 2022-03-26 Listed $399,000 CANOPYMLS as Distributed by MLS Grid
- 2022-03-11 Coming Soon — CANOPYMLS as Distributed by MLS Grid
- 2021-10-05 Sold (Public Records) $150,000 Public Records
- 1995-09-01 Sold (Public Records) $79,000 Public Records
Property tax history
+6.8%/yrLatest (2025): $2,482 · +0.0% YoY. Source: county tax records.
Cash-flow waterfall
monthlySold comps — $/sqft
last 12 mo · ≤1 miLoading sold comps…