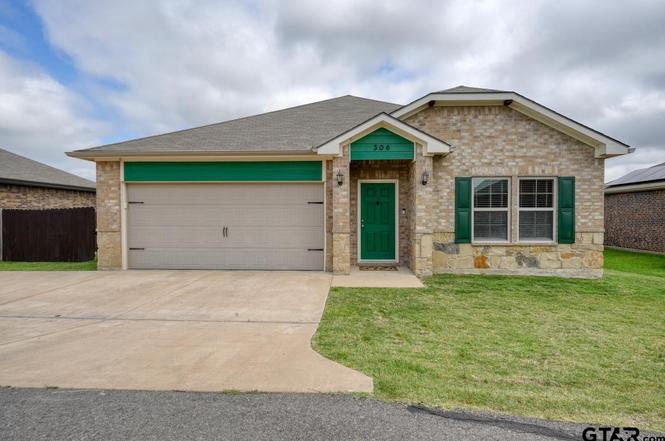
306 Ruffin Rd · Mabank, TX
Flood risk No data
- FEMA flood zone
- —
- Chance of flooding over 30 yrs
- %
- Est. flood insurance / yr
- —
Fire risk No data
- Est. fire insurance / yr
- —
Heat risk No data
- Hot days now (above °F)
- days/yr
- Hot days in 30 yrs
- days/yr
Wind risk No data
- Chance of severe wind over 30 yrs
- %
Air-quality risk No data
- Unhealthy air days now
- days/yr
- Unhealthy air days in 30 yrs
- days/yr
Risk factors via First Street. Map © Google.
Why this score? — see what drove the F grade
The composite is a weighted blend of 9 inputs, each scored 0–100. Each bar is that input's sub-score; the figure is the points it added to the 100-point composite (weight × sub-score).
- Appreciation +10.0/10.0
- Cash flow +5.7/30.0
- Rent growth +4.5/5.0
- Schools +3.8/10.0
- Livability +3.5/5.0
- Condition / age +2.5/5.0
- 1% rule +1.1/10.0
- DSCR +0.1/10.0
- ARV discount +0.0/15.0
$249,900
🖨 Deal sheet 📄 Offer letter ✓ Due diligence
Listing remarks
Welcome to easy living in the heart of Mabank! Built in 2019, this beautifully maintained 3-bedroom, 2-bath home offers the perfect combination of modern finishes, low-maintenance living, and an unbeatable location just minutes from the shores of Cedar Creek Lake. With approximately 1,444 square feet of thoughtfully designed living space, this home is ideal for first-time buyers, downsizers, investors, or anyone seeking an affordable East Texas retreat. Step inside to discover an open-concept floor plan filled with natural light and durable luxury vinyl plank flooring throughout the main living areas, creating a seamless blend of style and practicality. The kitchen is designed for both ever
Key facts
- Covered back patio
- Convenient pantry
- Granite countertops
Tags
Neighborhood map
What this means for you Summary
Snapshot
- This is a 3-bed/2.0-bath single-family listed at $250k.
Deal economics
- At list price, monthly cash flow is $-516 ($-6k/yr) — negative.
- To cash-flow at today's rent, offer at most $175k (29.9% below list).
- To meet the 1% rule (rent ≥ 1% of price), the offer needs to be $153k (38.7% below list).
- Recommended offer: $153k (38.7% below list) — sets the bar for 1% rule.
- Cap rate 3.8% vs local median 3.1% in Mabank — meaningfully above typical; check what's discounted (condition, days-on-market, listing class) to confirm the premium yield is real.
Location & tenants
- Location reads 69/100 on livability (#446 in TX) — a middle-class / working-renter tenant base. Strengths: cost of living A+, housing A+, crime B+; Watch: amenities F, commute F, employment D-.
- Mabank ISD (town): math 47% / reading 44% proficiency, ranked #273 of 826 in TX (top 33%) — families likely to look elsewhere, expect single-tenant / working-renter base with shorter leases.
- Market conditions: Rents rising fast (+8.1%/yr); 214 active listings in the ZIP; 6 comparable units currently listed for rent nearby; rentals lingering (median 44d on market — plan ~5-8 weeks vacancy on turnover, expect pricing pressure); 83% of comp listings sitting > 30 days — soft ceiling on asking rent; 263 units permitted in Henderson County in 2024 (0 in 5+ unit buildings).
- This rent runs 32% of the median local income ($57k/yr) — at the standard rent-burdened threshold; future hikes will face affordability resistance.
Forward outlook
- In year one you build about $27k of equity ($2k loan paydown + $25k appreciation (10.0% local appreciation)).
- By year 2, paydown + projected appreciation supports a ~$43k cash-out refi (75% LTV) — recoverable capital for the next deal without selling this one.
Negotiation context
- Only 1 days on market — expect competitive offers; lowballing is unlikely to land.
Questions for the listing agent
- What do current leases actually rent for vs. the listed asking? Can we see a recent rent roll and the last 12 months of T-12 income?
- Is there a deadline driving the sale (1031 exchange, divorce, estate, relocation)? That informs how much negotiation room exists.
- The area grade is low — what's the realistic commute time and amenity access for the typical tenant pool here? Any planned neighborhood developments (good or bad) we should know about?
- What's the average days-on-market for RENTAL listings here right now (not sales)? A rising rental-DOM trend means longer vacancies and softer asking-rent achievability than the comps imply.
- What's the recent tenant-quality profile in this submarket — average credit score on applications, eviction rate, late-payment / NSF rate, and stable-employment percentage? A property-management company in the area should have these aggregated.
- How much new for-sale + rental construction is in the pipeline within 1–3 miles? Heavy new supply typically softens prices + rents 12–24 months out; constrained supply supports both.
Investment metrics
- 1% rule
- 0.61% ✗
- Cap rate
- 3.82%
- Cash-on-cash
- -8.85%
- DSCR
- 0.61
- GRM
- 13.6
CMA / ARV
- ARV (on-the-fly)
- $171,836
- Comps found
- 12
Show comp detail 12 sales within ~0.75 mi
| Address | Dist | Beds/Ba | Sqft | Sold | Price | $/sf | Match |
|---|---|---|---|---|---|---|---|
| 307 Victory Dr | 0.14mi | 4/2.0 (+1) | 1,510 (+5%) | 2mo | $182,990 | $121 | 80 |
| 304 Paschal Rd | 0.16mi | 4/2.0 (+1) | 1,510 (+5%) | 2mo | $179,909 | $119 | 78 |
| 301 Victory Dr | 0.14mi | 4/2.0 (+1) | 1,510 (+5%) | 4mo | $184,990 | $123 | 77 |
| 297 Victory Dr | 0.18mi | 4/2.0 (+1) | 1,510 (+5%) | 3mo | $187,496 | $124 | 77 |
| 309 Victory Dr | 0.18mi | 4/2.0 (+1) | 1,510 (+5%) | 4mo | $179,990 | $119 | 76 |
| 289 Victory Dr | 0.22mi | 4/2.0 (+1) | 1,510 (+5%) | 4mo | $188,090 | $125 | 74 |
| 303 Victory Dr | 0.14mi | 3/2.5 | 1,600 (+11%) | 2mo | $174,990 | $109 | 72 |
| 300 Paschal Rd | 0.15mi | 3/2.5 | 1,600 (+11%) | 2mo | $177,990 | $111 | 72 |
| 306 Paschal Rd | 0.14mi | 3/2.5 | 1,600 (+11%) | 3mo | $179,990 | $112 | 71 |
| 299 Victory Dr | 0.14mi | 3/2.5 | 1,600 (+11%) | 3mo | $184,990 | $116 | 71 |
| 311 Victory Dr | 0.14mi | 3/2.5 | 1,600 (+11%) | 5mo | $192,496 | $120 | 69 |
| 293 Victory Dr | 0.20mi | 3/2.5 | 1,600 (+11%) | 2mo | $174,990 | $109 | 69 |
Match score weights: distance 35% · size 25% · config 20% · recency 20%. Top-matched comps best support the ARV.
Projected returns pro-forma
10.0% appreciation · 8.0% rent growth · sell at horizon
- IRR
- 19.3%
- Equity multiple
- 2.59×
- Total profit
- $111,366
- Equity at exit
- $225,130
- IRR
- 18.8%
- Equity multiple
- 6.34×
- Total profit
- $373,913
- Equity at exit
- $485,501
Cash invested: $69,972 (down + closing). Projections, not guarantees.
Landlord ↔ Tenant lean methodology
- Overall (STATE)
- 87 Strongly Landlord-Friendly
- State Texas
- 87 Strongly Landlord-Friendly · R+5
- County
- — inherits STATE
- City
- — inherits STATE
ZIP-level market 75147
- Home prices YoY
- 4.6%
- Rents YoY
- 8.1%
- Active inventory
- 214
- Price-to-rent
- 13.6×
Monthly cashflow live
- Estimated rent
- $1,533 high interval (Pro) →
- Mortgage (P&I)
- −$1,311
- Tax est. 1.5%
- −$312 /mo · $3,748/yr
- Insurance
- −$104
- HOA
- −$0
- Vacancy / Maint / Mgmt
- −$322
- Net cashflow
- $-516
Break-even live
UW: 25.0% down · 7.5% · 30yr · 1.5% tax · 5.0% vac · 8.0% maint · 8.0% mgmt
Financing live
Cash to close
- Down payment
- $62,475
- Closing costs
- $7,497
- Reserves months
- —
- Total cash needed
- —
Loan-product check · same deal, 3 products live
Conventional
25% down · 7.5% · 30yr
- Down + closing
- —
- Monthly P&I
- —
- Monthly cashflow
- —
- DSCR
- —
- Eligible?
- —
Personal DTI + credit; lowest rate.
DSCR
20% down · 8.5% · 30yr
- Down + closing
- —
- Monthly P&I
- —
- Monthly cashflow
- —
- DSCR
- —
- Eligible?
- —
No personal income docs; deal must DSCR.
Hard money
10% down · 12.0% · 12mo
- Down + closing
- —
- Monthly P&I
- —
- Monthly cashflow
- —
- DSCR
- —
- Eligible?
- —
Short-term bridge; refi at stabilization.
Rent comps 6 comps
| Address | Beds | Baths | Sqft | Rent | $/sqft | DOM | Units | Dist |
|---|---|---|---|---|---|---|---|---|
| 204 Paschall Blvd Unit C4 Mabank, TX | 2.0 | 2.0 | 995 | $980 | $0.98 | 43d | 1 | 0.26mi |
| 204 Paschall Blvd Apt D2 Mabank, TX | 2.0 | 2.0 | 995 | $949 | $0.95 | 43d | 1 | 0.26mi |
| 112 Spring Crest St Mabank, TX | 3.0–4.0 | 2.0 | 1750 | $1,749 | $1.00 | 1d | 1 | 0.86mi |
| 101 Pharm Hls Unit 1303 Mabank, TX | 2.0 | 2.0 | 1041 | $1,064 | $1.02 | 43d | 1 | 1.12mi |
| 1319 W Main St #16 Gun Barrel City, TX | 3.0 | 2.5 | 1545 | $1,695 | $1.10 | 43d | 1 | 1.36mi |
| 1319 W Main St Unit 1 Gun Barrel City, TX | 3.0 | 2.5 | 1545 | $1,950 | $1.26 | 43d | 1 | 1.42mi |
Listing history 2 events
-
2026-06-19remarks 699-char remark
-
2026-06-19$249,900 Active 1 DOM
ⓘ Source: listings_history table (triggers on properties + properties_extension) + one-shot
backfill from property_details.listing_events for pre-trigger history.
Nearby sold comps map
Loading sold comps map…
Walkable amenities ~0.75 mi
Loading nearby amenities…
Taxation est. · year 1
- Rental income
- $18,396
- − Mortgage interest
- −$13,998
- − Property taxes
- −$3,748
- − Insurance
- −$1,250
- − Repairs & maintenance
- −$1,472
- − Management
- −$1,472
- − Depreciation
- −$7,270
- Taxable loss
- −$10,814
- Est. tax savings @ 24.0%
- +$2,595
- After-tax cash flow
- $-3,596/yr
For passive investors: Depreciation is non-cash, so a rental often shows a tax loss while cash-flowing — sheltering income. Rental losses are passive: they offset passive income freely, and up to $25,000/yr can offset ordinary (W-2) income if you actively participate and your MAGI is under $100k (phasing out to $0 by $150k); unused losses carry forward. On sale, claimed depreciation is recaptured at up to 25%, and gains may owe capital-gains tax (a 1031 exchange can defer both). Figures are a year-1 estimate at your 24.0% rate — not tax advice; consult a CPA.
Schools (NCES district)
- District
- Mabank ISD
- NCES district ID
- 4828680
- Math proficiency
- 47% ▼ -19.00%
- Reading proficiency
- 44% ▼ -11.00%
- Median HH income
- $40,321
- Composite
- 38.15/100
- National rank
- #4267
- State rank
- #273 of 826 in TX
Livability — Mabank
- Score
- 69/100
- State rank
- #446
- US rank
- #9068
Category grades
Schools grade is shown separately in the Schools card above.
Census & demographics
- Census place
- Mabank, TX
- County
- Van Zandt County · 9,177 people
- Metro
- Dallas-Fort Worth-Arlington, TX
- Population (ZIP)
- 9,177
- Household income
- $56,940
- Rent vs Own
- Severe rent burden
- 279.0
Population outlook (Henderson County) Hauer SSP2
- Today (2025)
- 80,471 people
- By 2030
- 80,608 · +0.2%
- By 2040
- 80,087 · -0.5%
- By 2050
- 78,208 · -2.8%
- By 2075
- 72,423 · -10.0%
- By 2100
- 61,012 · -24.2%
Race, ethnicity, and origin ACS 2023
- Neighborhood character
- Predominantly White (86%)
- Race & ethnicity
- White 86% Hispanic / Latino 10% Two or more races 8% Black 2%
- Hispanic origin (detail)
- Mexican 10%
- Common ancestry
- Lithuanian 2% Serbian 2% Romanian 1%
- Foreign-born
- 2% · Canada
- Languages at home
- 95% English-only · Spanish 4%
Political lean MEDSL · Henderson
- 2024 margin
- Solid R (+63.5) · D 18.0% · R 81.4%
- 2008→2024 swing
- -18.8pp toward R · 2008: -44.6pp · 2024: -63.5pp
- All cycles
- 2024: R+63.5 2020: R+60.2 2016: R+60.0 2012: R+54.8 2008: R+44.6
Not yet ingested
- Civics
- —
Market trends
- HPI YoY
- ▲ 11.14%
- Current HPI
- 254.32
- Rent YoY
- ▲ 8.13%
- Metro
- Dallas-Fort Worth-Arlington, TX
- State GDP YoY
- ▲ 3.95%
- F500 in state
- 110
Industry mix (Fortune 500 HQ in TX)
| Industry | F500 HQs | Revenue |
|---|---|---|
| Energy | 16 | $1,198B |
|
||
| Technology | 5 | $198B |
|
||
| Engineering / Construction | 4 | $72B |
|
||
| Energy Services | 3 | $60B |
|
||
| Utilities | 3 | $41B |
|
||
| Healthcare | 2 | $330B |
|
||
Cash-flow waterfall
monthlySold comps — $/sqft
last 12 mo · ≤1 miLoading sold comps…