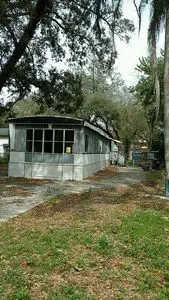
3004 E 148th Ave · University, FL
Flood risk 1/10 · Minimal
- FEMA flood zone
- X (unshaded)
- Chance of flooding over 30 yrs
- 0.0%
- Est. flood insurance / yr
- $507 – $1,088
Fire risk 1/10 · Minimal
- Est. fire insurance / yr
- $947 – $1,759
Heat risk 10/10 · Severe
- Hot days now (above 109°F)
- 7 days/yr
- Hot days in 30 yrs
- 25 days/yr
Wind risk 9/10 · Severe
- Chance of severe wind over 30 yrs
- 99.0%
Air-quality risk 3/10 · Minor
- Unhealthy air days now
- 4 days/yr
- Unhealthy air days in 30 yrs
- 4 days/yr
Risk factors via First Street. Map © Google.
Why this score? — see what drove the B grade
The composite is a weighted blend of 9 inputs, each scored 0–100. Each bar is that input's sub-score; the figure is the points it added to the 100-point composite (weight × sub-score).
- Cash flow +30.0/30.0
- 1% rule +10.0/10.0
- DSCR +10.0/10.0
- ARV discount +7.5/15.0
- Schools +4.2/10.0
- Livability +4.2/5.0
- Condition / age +2.5/5.0
- Rent growth +1.6/5.0
- Appreciation +0.0/10.0
$100,000
🖨 Deal sheet 📄 Offer letter ✓ Due diligence
Listing remarks
No HOA! No CDD! Can close IMMEDIATELY! Centrally located close to USF, Bruce B. Downs, I-275, shopping and dining. This home is in need of some minor TLC however it has huge potential for a homeowner or an investor. Newer roof coating, flooring made of sturdy 3/4 inch pressure treated wood. Walk-in shower in the master bedroom, bathtub in 2nd bathroom. Split floorplan. Large storage shed in yard!
Key facts
- Centrally located
- Newer roof coating
- Walk-in shower
Tags
Neighborhood map
What this means for you Summary
Snapshot
- This is a 2-bed/1.0-bath manufactured listed at $100k.
Deal economics
- At list price, monthly cash flow is $558 ($7k/yr) — positive.
- The deal already cash-flows at list — no discount required.
- Meets the 1% rule at list price ($2k rent vs $100k).
- Cap rate 13.0% vs local median 3.9% in University — top-decile yield for the area; either an underpriced asset or a hidden risk that comps aren't pricing in. Stress-test before assuming the spread holds.
Location & tenants
- Location reads 85/100 on livability (#28 in FL, #603 nationally) — a professional / high-income tenant draw. Strengths: amenities A+, commute A+, cost of living A+.
- Hillsborough (suburban): math 47% / reading 50% proficiency, ranked #41 of 73 in FL (top 56%) — families likely to look elsewhere, expect single-tenant / working-renter base with shorter leases.
- Market conditions: Rents falling (-3.6%/yr); 91 active listings in the ZIP; 40 comparable units currently listed for rent nearby; rentals at typical pace (median 14d on market — plan ~3-4 weeks tenant-placement turnaround); solid renter incomes; 9,053 units permitted in Hillsborough County in 2024 (4,555 in 5+ unit buildings).
Forward outlook
- Local home prices are declining (-3.0%/yr); year-one equity from $691 of loan paydown is wiped out by about $3k of value loss. Plan a longer hold.
- Hillsborough County population projected at +37% by 2050 — long-run rental-demand tailwind backs the buy-and-hold thesis.
- At projected returns (-3.0% appreciation + 0.0% rent growth), your $28k cash investment doubles in ~7 years — after that, you're playing with house money.
Negotiation context
- Only 6 days on market — expect competitive offers; lowballing is unlikely to land.
- 2 sale attempts since 9y ago with the ask held roughly flat each time — persistent listings suggest the price (not the market) is what's stuck; bring a comps-based counter.
- Current owner paid $19k; list at $100k implies a 435% gain — meaningful room to come down on a strong offer.
Risks & watch-outs
- Climate carrying-cost: severe wind risk, 99% chance of damaging wind over 30y; extreme-heat days projected 7→25/yr by 2055 (HVAC capex compounding) — expect insurance premiums to compound above CPI over the hold.
Questions for the listing agent
- Is there a deadline driving the sale (1031 exchange, divorce, estate, relocation)? That informs how much negotiation room exists.
- What's the average days-on-market for RENTAL listings here right now (not sales)? A rising rental-DOM trend means longer vacancies and softer asking-rent achievability than the comps imply.
- What's the recent tenant-quality profile in this submarket — average credit score on applications, eviction rate, late-payment / NSF rate, and stable-employment percentage? A property-management company in the area should have these aggregated.
- How much new for-sale + rental construction is in the pipeline within 1–3 miles? Heavy new supply typically softens prices + rents 12–24 months out; constrained supply supports both.
Investment metrics
- 1% rule
- 1.58% ✓
- Cap rate
- 12.98%
- Cash-on-cash
- 23.90%
- DSCR
- 2.06
- GRM
- 5.3
CMA / ARV
No comps found within radius.
Projected returns pro-forma
-3.0% appreciation · 0.0% rent growth · sell at horizon
- IRR
- 13.7%
- Equity multiple
- 1.52×
- Total profit
- $14,696
- Equity at exit
- $14,910
- IRR
- 20.0%
- Equity multiple
- 2.45×
- Total profit
- $40,707
- Equity at exit
- $8,646
Cash invested: $28,000 (down + closing). Projections, not guarantees.
Landlord ↔ Tenant lean methodology
- Overall (STATE)
- 87 Strongly Landlord-Friendly
- State Florida
- 87 Strongly Landlord-Friendly · R+3
- County
- — inherits STATE
- City
- — inherits STATE
ZIP-level market 33559
- Home prices YoY
- -21.0%
- Rents YoY
- -3.6%
- Active inventory
- 91
- Price-to-rent
- 5.3×
Monthly cashflow live
- Estimated rent
- $1,582 high interval (Pro) →
- Mortgage (P&I)
- −$524
- Tax from tax record
- −$126 /mo · $1,515/yr
- Insurance
- −$42
- HOA
- −$0
- Vacancy / Maint / Mgmt
- −$332
- Net cashflow
- $558
Break-even live
UW: 25.0% down · 7.5% · 30yr · 1.5% tax · 5.0% vac · 8.0% maint · 8.0% mgmt
Financing live
Cash to close
- Down payment
- $25,000
- Closing costs
- $3,000
- Reserves months
- —
- Total cash needed
- —
Loan-product check · same deal, 3 products live
Conventional
25% down · 7.5% · 30yr
- Down + closing
- —
- Monthly P&I
- —
- Monthly cashflow
- —
- DSCR
- —
- Eligible?
- —
Personal DTI + credit; lowest rate.
DSCR
20% down · 8.5% · 30yr
- Down + closing
- —
- Monthly P&I
- —
- Monthly cashflow
- —
- DSCR
- —
- Eligible?
- —
No personal income docs; deal must DSCR.
Hard money
10% down · 12.0% · 12mo
- Down + closing
- —
- Monthly P&I
- —
- Monthly cashflow
- —
- DSCR
- —
- Eligible?
- —
Short-term bridge; refi at stabilization.
Rent comps 40 comps
| Address | Beds | Baths | Sqft | Rent | $/sqft | DOM | Units | Dist |
|---|---|---|---|---|---|---|---|---|
| 2812 Somerset Park Dr Tampa, FL | 1.0–3.0 | 1.0–2.0 | 991 | $1,362 | $1.37 | 2d | 2 | 0.37mi |
| 2812 Somerset Park Dr Tampa, FL | 1.0–3.0 | 1.0–2.0 | 991 | $1,398 | $1.41 | 14d | 2 | 0.37mi |
| 2866 Somerset Park Dr #202 Tampa, FL | 1.0 | 1.0 | 832 | $1,600 | $1.92 | 24d | 1 | 0.40mi |
| 14607 Pine Glen Cir Lutz, FL | 2.0 | 1.0 | 930 | $1,625 | $1.75 | 24d | 1 | 0.44mi |
| 2830 Somerset Park Dr #201 Tampa, FL | 1.0 | 1.0 | 742 | $1,225 | $1.65 | 24d | 1 | 0.45mi |
| 2208 Irene St Unit 1501434P Lutz, FL | 1.0 | 1.0 | 656 | $1,989 | $3.03 | 3d | 1 | 0.46mi |
| 14566 Seaford Cir Tampa, FL | 1.0–2.0 | 1.0 | 718 | $1,626 | $2.26 | 3d | 10 | 0.48mi |
| 2205 Irene St Unit 2 Lutz, FL | 2.0 | 1.0 | 900 | $1,195 | $1.33 | 24d | 1 | 0.49mi |
| 14501 Caribbean Breeze Dr Tampa, FL | 1.0–2.0 | 1.0–2.0 | 837 | $1,671 | $2.00 | 1d | 35 | 0.52mi |
| 3110 Grand Pavilion Dr Tampa, FL | 1.0–2.0 | 1.0–2.0 | 706 | $1,617 | $2.29 | 1d | 12 | 0.53mi |
| 14417 Americana Cir Tampa, FL | 2.0 | 1.0 | 902 | $1,550 | $1.72 | 17d | 1 | 0.53mi |
| 15215 Livingston Ave Lutz, FL | 2.0 | 1.0 | 950 | $1,549 | $1.63 | 2d | 15 | 0.53mi |
| 14733 Norwood Oaks Dr #201 Tampa, FL | 2.0 | 2.0 | 912 | $1,800 | $1.97 | 2d | 1 | 0.56mi |
| 3944 Tumble Wood Trl #101 Tampa, FL | 2.0 | 2.0 | 912 | $1,300 | $1.43 | 17d | 1 | 0.59mi |
| 14609 Banyan Bluff Dr Tampa, FL | 1.0–2.0 | 1.0–2.0 | 868 | $1,749 | $2.01 | 1d | 16 | 0.59mi |
| 15081 Cypress Cay Blvd Lutz, FL | 1.0–2.0 | 1.0–2.5 | 992 | $3,200 | $3.23 | 2d | 18 | 0.61mi |
| 4003 Nestle Oaks Pl Tampa, FL | 2.0 | 2.0 | 921 | $1,399 | $1.52 | 24d | 1 | 0.63mi |
| 14401 N 22nd St Tampa, FL | 1.0 | 1.0 | 680 | $1,160 | $1.71 | 23d | 3 | 0.63mi |
| 2321 Cedar Trace Cir Tampa, FL | 1.0 | 1.0 | 724 | $1,099 | $1.52 | 4d | 1 | 0.64mi |
| 14201 Cyber Pl Tampa, FL | 1.0–3.0 | 1.0–3.0 | 1099 | $2,068 | $1.88 | 2d | 41 | 0.65mi |
| 4022 Tumble Wood Trl #201 Tampa, FL | 2.0 | 2.0 | 912 | $1,595 | $1.75 | 24d | 1 | 0.65mi |
| 2362 Cedar Trace Cir Tampa, FL | 2.0 | 1.5 | 926 | $1,299 | $1.40 | 4d | 1 | 0.67mi |
| 2334 Cedar Trace Cir Tampa, FL | 2.0 | 1.5 | 926 | $1,299 | $1.40 | 14d | 1 | 0.68mi |
| 2354 Cedar Trace Cir Tampa, FL | 2.0 | 1.5 | 926 | $1,470 | $1.59 | 14d | 1 | 0.68mi |
| 2352 Cedar Trace Cir Tampa, FL | 2.0 | 1.5 | 926 | $1,470 | $1.59 | 14d | 1 | 0.68mi |
| 15420 Livingston Ave Lutz, FL | 1.0–3.0 | 1.0–2.0 | 900 | $1,564 | $1.74 | 1d | 9 | 0.70mi |
| 2450 Cedar Trace Cir Tampa, FL | 2.0 | 1.5 | 926 | $1,299 | $1.40 | 4d | 1 | 0.71mi |
| 14003 Saulk Ct Tampa, FL | 1.0–2.0 | 1.0–2.0 | 850 | $1,517 | $1.78 | 2d | 23 | 0.71mi |
| 2454 Cedar Trace Cir Tampa, FL | 2.0 | 1.5 | 926 | $1,470 | $1.59 | 24d | 1 | 0.72mi |
| 14555 Bruce B Downs Blvd Tampa, FL | 1.0–2.0 | 1.0–2.0 | 896 | $1,850 | $2.06 | 1d | 11 | 0.72mi |
| 2394 Cedar Trace Cir Tampa, FL | 2.0 | 1.5 | 926 | $1,299 | $1.40 | 4d | 1 | 0.72mi |
| 2282 Cedar Trace Cir Tampa, FL | 1.0 | 1.0 | 724 | $1,199 | $1.66 | 21d | 1 | 0.72mi |
| 2388 Cedar Trace Cir Tampa, FL | 2.0 | 1.5 | 926 | $1,470 | $1.59 | 1d | 1 | 0.72mi |
| 2284 Cedar Trace Cir Tampa, FL | 1.0 | 1.0 | 724 | $1,199 | $1.66 | 24d | 1 | 0.73mi |
| 2200 Cedar Trace Cir Tampa, FL | 1.0–3.0 | 1.0–2.0 | 950 | $1,400 | $1.47 | 3d | 14 | 0.73mi |
| 2262 Cedar Trace Cir Tampa, FL | 2.0 | 1.5 | 926 | $1,470 | $1.59 | 16d | 1 | 0.74mi |
| 2248 Cedar Trace Cir Tampa, FL | 2.0 | 1.5 | 926 | $1,470 | $1.59 | 24d | 1 | 0.74mi |
| 14350 N 22nd St Tampa, FL | 1.0 | 1.0 | 610 | $999 | $1.64 | 2d | 1 | 0.74mi |
| 14610 N 42nd St Unit 211 Tampa, FL | 2.0 | 1.5 | 900 | $1,250 | $1.39 | 24d | 1 | 0.75mi |
| 14610 N 42nd St Unit 220 Tampa, FL | 2.0 | 1.5 | 900 | $1,175 | $1.31 | 24d | 1 | 0.75mi |
Listing history 6 events
-
2026-06-18days on market $100,000 Active 6 DOM
-
2026-06-17days on market $100,000 Active 5 DOM
-
2026-06-16days on market $100,000 Active 4 DOM
-
2026-06-15days on market $100,000 Active 3 DOM
-
2026-06-13remarks 399-char remark
-
2026-06-13$100,000 Active 1 DOM
ⓘ Source: listings_history table (triggers on properties + properties_extension) + one-shot
backfill from property_details.listing_events for pre-trigger history.
Tax reassessment forecast FL · Resets to sale price
- Current annual tax
- $1,515 · $126/mo
- Projected year-2 tax
- $1,515 · $126/mo
- Expected delta
- $0/yr ($0/mo · 0.0%)
ⓘ Screening estimate from a state-policy table — verify with the county assessor before closing.
Climate risk First Street
- Flood 1/10 Low FEMA zone X (unshaded) · 0% chance over 30 yrs
- Wildfire 1/10 Low
- Heat 10/10 Extreme 7 d/yr ≥109°F today · 25 d/yr by 30 yrs out
- Wind 9/10 Extreme 99% chance of damaging wind over 30 yrs
- Air quality 3/10 Moderate 4 unhealthy d/yr today · 4 by 30 yrs out
Nearby sold comps map
Loading sold comps map…
Walkable amenities ~0.75 mi
Loading nearby amenities…
Taxation est. · year 1
- Rental income
- $18,985
- − Mortgage interest
- −$5,602
- − Property taxes
- −$1,515
- − Insurance
- −$500
- − Repairs & maintenance
- −$1,519
- − Management
- −$1,519
- − Depreciation
- −$2,909
- Taxable income
- $5,423
- Est. tax owed @ 24.0%
- −$1,301
- After-tax cash flow
- $5,390/yr
For passive investors: Depreciation is non-cash, so a rental often shows a tax loss while cash-flowing — sheltering income. Rental losses are passive: they offset passive income freely, and up to $25,000/yr can offset ordinary (W-2) income if you actively participate and your MAGI is under $100k (phasing out to $0 by $150k); unused losses carry forward. On sale, claimed depreciation is recaptured at up to 25%, and gains may owe capital-gains tax (a 1031 exchange can defer both). Figures are a year-1 estimate at your 24.0% rate — not tax advice; consult a CPA.
Schools (NCES district)
- District
- Hillsborough
- NCES district ID
- 1200870
- Math proficiency
- 47% ▼ -8.00%
- Reading proficiency
- 50% ▼ -4.00%
- Median HH income
- $50,622
- Composite
- 41.6/100
- National rank
- #3435
- State rank
- #41 of 73 in FL
Livability — University
- Score
- 85/100
- State rank
- #28
- US rank
- #603
Category grades
Schools grade is shown separately in the Schools card above.
Census & demographics
- Census place
- University, FL
- County
- Hillsborough County · 1,540,968 people
- City population
- 41,570
- Metro
- Tampa-St. Petersburg-Clearwater, FL
- Population (ZIP)
- 18,831
- Household income
- $80,185
- Rent vs Own
- Severe rent burden
- 602.0
Population outlook (Hillsborough County) Hauer SSP2
- Today (2025)
- 1,607,022 people
- By 2030
- 1,733,968 · +7.9%
- By 2040
- 1,979,565 · +23.2%
- By 2050
- 2,203,427 · +37.1%
- By 2075
- 2,667,893 · +66.0%
- By 2100
- 2,891,558 · +79.9%
Race, ethnicity, and origin ACS 2023
- Neighborhood character
- Diverse neighborhood (Simpson 0.62)
- Race & ethnicity
- White 58% Hispanic / Latino 19% Two or more races 14% Black 11% Asian 6%
- Hispanic origin (detail)
- Mexican 4% Puerto Rican 6% Cuban 3%
- Common ancestry
- Romanian 4% Slovak 2% Lithuanian 2%
- Foreign-born
- 12% · Canada, Jamaica, China
- Languages at home
- 74% English-only · Spanish 15% Other Indo-European 2% Arabic 2%
Political lean MEDSL · Hillsborough
- 2024 margin
- Toss-up / Even · D 47.8% · R 50.9% · Other 1.3%
- 2008→2024 swing
- -10.2pp toward R · 2008: 7.1pp · 2024: -3.1pp
- All cycles
- 2024: R+3.1 2020: D+6.9 2016: D+6.8 2012: D+6.7 2008: D+7.1
Not yet ingested
- Civics
- —
Market trends
- HPI YoY
- ▼ -81.64%
- Current HPI
- 307.7635
- Rent YoY
- ▼ -3.58%
- Metro
- Tampa-St. Petersburg-Clearwater, FL
- State GDP YoY
- ▲ 3.28%
- F500 in state
- 36
Industry mix (Fortune 500 HQ in FL)
| Industry | F500 HQs | Revenue |
|---|---|---|
| Industrial Technology | 2 | $29B |
|
||
| Insurance | 2 | $17B |
|
||
| Retail | 1 | $60B |
|
||
| Technology Distribution | 1 | $58B |
|
||
| Homebuilding | 1 | $35B |
|
||
| Technology Manufacturing | 1 | $35B |
|
||
Price history
+434.8% since first listed4 events — show timeline
- 2026-06-13 Listed $100,000 FSBO.com
- 2017-06-09 Listing Removed — Stellar MLS as Distributed by MLS Grid
- 2017-04-24 Listed $60,000 Stellar MLS as Distributed by MLS Grid
- 2005-12-29 Sold (Public Records) $18,700 Public Records
Property tax history
+8.2%/yrLatest (2025): $1,515 · +10.7% YoY. Source: county tax records.
Cash-flow waterfall
monthlySold comps — $/sqft
last 12 mo · ≤1 miLoading sold comps…