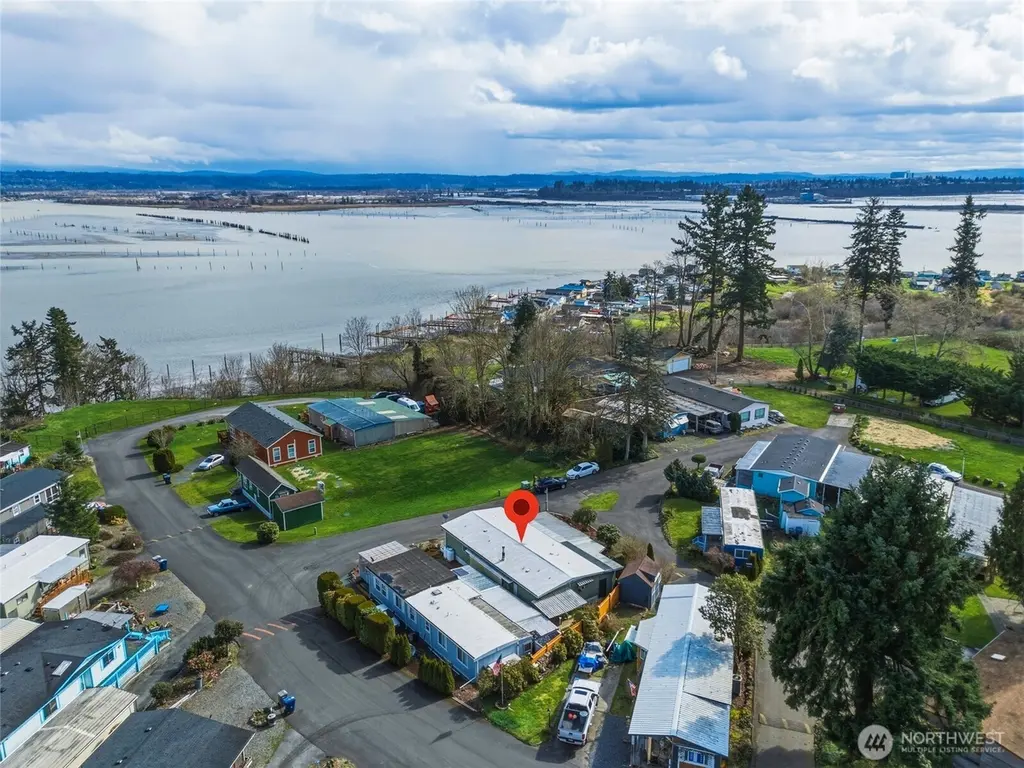
4425 Meridian Ave N #17 · Everett, WA
Flood risk No data
- FEMA flood zone
- —
- Chance of flooding over 30 yrs
- —
- Est. flood insurance / yr
- —
Fire risk No data
- Est. fire insurance / yr
- —
Heat risk No data
- Hot days now (above threshold)
- —
- Hot days in 30 yrs
- —
Wind risk No data
- Chance of severe wind over 30 yrs
- —
Air-quality risk No data
- Unhealthy air days now
- —
- Unhealthy air days in 30 yrs
- —
Risk factors via First Street. Map © Google.
Why this score? — see what drove the B grade
The composite is a weighted blend of 9 inputs, each scored 0–100. Each bar is that input's sub-score; the figure is the points it added to the 100-point composite (weight × sub-score).
- Cash flow +30.0/30.0
- 1% rule +10.0/10.0
- DSCR +10.0/10.0
- ARV discount +7.5/15.0
- Schools +4.1/10.0
- Livability +3.7/5.0
- Rent growth +3.1/5.0
- Condition / age +2.5/5.0
- Appreciation +0.0/10.0
$85,000
🖨 Deal sheet (PDF) 📄 Offer letter ✓ Due diligence
Listing remarks
A wonderful opportunity in a beautiful area! Seller is highly motivated and all reasonable offers will be considered. You won't find a better home or view at this price. Enjoy your view of Tulalip Bay from this spacious double wide home in peaceful Snug Harbor 55+ Park. The easy flow of this home offers open living space with bay views, two generous living areas, a kitchen and dining space with built in hutch, and a large primary suite with private bath and vanity. The second bedroom is ideal for guests or an office, plus a second full bath, cozy fireplace, and convenient laundry. Outside features include a covered carport, attached workshop, additional storage or hobby space, a low mainten
Key facts
- Built in hutch
- Private bath
- View of tulalip bay
Tags
Neighborhood map
What this means for you Summary
Snapshot
- This is a 2-bed/1.5-bath manufactured listed at $85k.
Deal economics
- At list price, monthly cash flow is $1k ($15k/yr) — positive.
- The deal already cash-flows at list — no discount required.
- Meets the 1% rule at list price ($2k rent vs $85k).
- Recommended offer: $77k (9.0% below list) — sets the bar for market timing.
- Cap rate 24.2% vs local median 2.5% in Everett — top-decile yield for the area; either an underpriced asset or a hidden risk that comps aren't pricing in. Stress-test before assuming the spread holds.
Location & tenants
- Location reads 73/100 on livability (#199 in WA) — a middle-class / working-renter tenant base. Strengths: commute A+, housing A, health & safety A; Watch: crime D+, amenities F, cost of living F.
- Marysville School District (suburban): math 36% / reading 51% proficiency, ranked #177 of 291 in WA (top 61%) — families likely to look elsewhere, expect single-tenant / working-renter base with shorter leases.
- Zoned schools: Quil Ceda Tulalip Elementary (503 students, 70% FRL); Totem Middle School (555 students, 71% FRL); Marysville Pilchuck High School (1,238 students, 63% FRL) — zoned schools average 68% FRL vs 40% district-wide (28 pts higher); higher-poverty schools than district average — tighter screening recommended.
- Market conditions: Rents rising (+2.3%/yr); 215 active listings in the ZIP; 1 comparable units currently listed for rent nearby; solid renter incomes; 3,982 units permitted in Snohomish County in 2024 (1,492 in 5+ unit buildings).
Forward outlook
- Local home prices are declining (-3.0%/yr); year-one equity from $588 of loan paydown is wiped out by about $3k of value loss. Plan a longer hold.
- Snohomish County population projected at +30% by 2050 — long-run rental-demand tailwind backs the buy-and-hold thesis.
- At projected returns (-3.0% appreciation + 2.3% rent growth), your $24k cash investment doubles in ~2 years — after that, you're playing with house money.
Negotiation context
- It's been on market 103 days — a 9% lower offer ($77k) is reasonable based on typical stale-listing flexibility.
- 2 sale attempts since 3y ago; this cycle's ask has dropped $7k (8%) from the opening price — seller is motivated, your offer sets the floor, not the list.
- Current owner paid $70k; 21% above their basis — modest negotiation headroom, anchor on the comps not their cost.
Questions for the listing agent
- It's been on market 103 days. Have you received any prior offers? Is the seller open to a 9% concession, seller financing, or rate buy-down credit?
- Built in 1972 — when were the roof, HVAC, electrical panel, plumbing, and water heater last replaced?
- Why hasn't it sold? Are there any deal-killer items the seller is aware of (foundation, flood, title, zoning, code violations)?
- Is there a deadline driving the sale (1031 exchange, divorce, estate, relocation)? That informs how much negotiation room exists.
- Crime grade is D in this area — have there been break-ins, vandalism, or insurance claims at this property in the last 3 years? What carrier currently insures it and at what premium?
- What's the average days-on-market for RENTAL listings here right now (not sales)? A rising rental-DOM trend means longer vacancies and softer asking-rent achievability than the comps imply.
- What's the recent tenant-quality profile in this submarket — average credit score on applications, eviction rate, late-payment / NSF rate, and stable-employment percentage? A property-management company in the area should have these aggregated.
- How much new for-sale + rental construction is in the pipeline within 1–3 miles? Heavy new supply typically softens prices + rents 12–24 months out; constrained supply supports both.
Investment metrics
- 1% rule
- 2.76% ✓
- Cap rate
- 24.16%
- Cash-on-cash
- 63.80%
- DSCR
- 3.84
- GRM
- 3.0
CMA / ARV
- ARV (median comp)
- $389,642
- List price
- $85,000
- Delta
- -78.19%
- Verdict
- UNDERPRICED
- Comps
- 1 within 2.0 mi
Show comp detail 1 sale within ~0.75 mi
| Address | Dist | Beds/Ba | Sqft | Sold | Price | $/sf | Match |
|---|---|---|---|---|---|---|---|
| 5130 2nd Ave NE | 0.43mi | 3/2.0 (+1) | 1,344 (-8%) | 9mo | $390,000 | $290 | 53 |
Match score weights: distance 35% · size 25% · config 20% · recency 20%. Top-matched comps best support the ARV.
Projected returns pro-forma
-3.0% appreciation · 2.3% rent growth · sell at horizon
- IRR
- 62.1%
- Equity multiple
- 3.74×
- Total profit
- $65,211
- Equity at exit
- $12,674
- IRR
- 66.4%
- Equity multiple
- 7.47×
- Total profit
- $154,064
- Equity at exit
- $7,349
Cash invested: $23,800 (down + closing). Projections, not guarantees.
Landlord ↔ Tenant lean methodology
- Overall (STATE)
- 28 Tenant-Leaning
- State Washington
- 28 Tenant-Leaning · D+8
- County
- — inherits STATE
- City
- — inherits STATE
ZIP-level market 98271
- Rents YoY
- 2.3%
- Active inventory
- 215
- Price-to-rent
- 3.0×
Monthly cashflow live
- Estimated rent
- $2,345 medium interval (Pro) →
- Mortgage (P&I)
- −$446
- Tax est. 1.5%
- −$106 /mo · $1,275/yr
- Insurance
- −$35
- HOA
- −$0
- Vacancy / Maint / Mgmt
- −$493
- Net cashflow
- $1,265
Break-even live
Sensitivity live
| Price | -10% $1,324 | -5% $1,295 | +0% $1,265 | +5% $1,236 | +10% $1,207 |
|---|---|---|---|---|---|
| Rent | -10% $1,080 | -5% $1,173 | +0% $1,265 | +5% $1,358 | +10% $1,451 |
| Rate | -1.0pp $1,308 | -0.5pp $1,287 | base $1,265 | +0.5pp $1,243 | +1.0pp $1,221 |
UW: 25.0% down · 7.5% · 30yr · 1.5% tax · 5.0% vac · 8.0% maint · 8.0% mgmt
Financing live
Cash to close
- Down payment
- $21,250
- Closing costs
- $2,550
- Reserves months
- —
- Total cash needed
- —
Loan-product check · same deal, 3 products live
Conventional
25% down · 7.5% · 30yr
- Down + closing
- —
- Monthly P&I
- —
- Monthly cashflow
- —
- DSCR
- —
- Eligible?
- —
Personal DTI + credit; lowest rate.
DSCR
20% down · 8.5% · 30yr
- Down + closing
- —
- Monthly P&I
- —
- Monthly cashflow
- —
- DSCR
- —
- Eligible?
- —
No personal income docs; deal must DSCR.
Hard money
10% down · 12.0% · 12mo
- Down + closing
- —
- Monthly P&I
- —
- Monthly cashflow
- —
- DSCR
- —
- Eligible?
- —
Short-term bridge; refi at stabilization.
Rent comps 1 comps
| Address | Beds | Baths | Sqft | Rent | $/sqft | DOM | Units | Dist |
|---|---|---|---|---|---|---|---|---|
| 105 43rd Pl NW Tulalip, WA | 2.0 | 1.0 | 1000 | $1,900 | $1.90 | 14d | 1 | 0.23mi |
Listing history 20 events
-
2026-06-21days on market $85,000 Active 103 DOM
-
2026-06-18days on market $85,000 Active 100 DOM
-
2026-06-17days on market $85,000 Active 99 DOM
-
2026-06-16days on market $85,000 Active 98 DOM
-
2026-06-15days on market $85,000 Active 97 DOM
-
2026-06-13days on market $85,000 Active 95 DOM
-
2026-06-09days on market $85,000 Active 91 DOM
-
2026-06-08days on market $85,000 Active 90 DOM
-
2026-06-07days on market $85,000 Active 89 DOM
-
2026-06-04days on market $85,000 Active 86 DOM
-
2026-06-03days on market $85,000 Active 85 DOM
-
2026-06-02days on market $85,000 Active 84 DOM
-
2026-06-01days on market $85,000 Active 83 DOM
-
2026-05-31days on market $85,000 Active 82 DOM
-
2026-04-23price $85,000
-
2026-04-07price $87,500
-
2026-03-10$92,000 Active
-
2023-10-18soldstatus $70,000 Closed
-
2023-09-14status Pending
-
2023-07-14$75,000 Active
ⓘ Source: listings_history table (triggers on properties + properties_extension) + one-shot
backfill from property_details.listing_events for pre-trigger history.
Nearby sold comps map
Loading sold comps map…
Walkable amenities ~0.75 mi
Loading nearby amenities…
Taxation est. · year 1
- Rental income
- $28,143
- − Mortgage interest
- −$4,761
- − Property taxes
- −$1,275
- − Insurance
- −$425
- − Repairs & maintenance
- −$2,251
- − Management
- −$2,251
- − Depreciation
- −$2,473
- Taxable income
- $14,706
- Est. tax owed @ 24.0%
- −$3,529
- After-tax cash flow
- $11,655/yr
For passive investors: Depreciation is non-cash, so a rental often shows a tax loss while cash-flowing — sheltering income. Rental losses are passive: they offset passive income freely, and up to $25,000/yr can offset ordinary (W-2) income if you actively participate and your MAGI is under $100k (phasing out to $0 by $150k); unused losses carry forward. On sale, claimed depreciation is recaptured at up to 25%, and gains may owe capital-gains tax (a 1031 exchange can defer both). Figures are a year-1 estimate at your 24.0% rate — not tax advice; consult a CPA.
Schools (NCES district)
- District
- Marysville School District
- NCES district ID
- 5304860
- Math proficiency
- 36% ▼ -1.00%
- Reading proficiency
- 51% ▲ 2.00%
- Median HH income
- $67,461
- Composite
- 41.31/100
- National rank
- #7367
- State rank
- #177 of 291 in WA
Livability — Everett
- Score
- 73/100
- State rank
- #199
- US rank
- #5489
Category grades
Schools grade is shown separately in the Schools card above.
Census & demographics
- County
- Snohomish County · 786,756 people
- City population
- 173,457
- Metro
- Seattle-Tacoma-Bellevue, WA
- Population (ZIP)
- 30,838
- Household income
- $95,654
- Rent vs Own
- Severe rent burden
- 929.0
Population outlook (Snohomish County) Hauer SSP2
- Today (2025)
- 899,800 people
- By 2030
- 960,975 · +6.8%
- By 2040
- 1,074,447 · +19.4%
- By 2050
- 1,171,954 · +30.2%
- By 2075
- 1,384,849 · +53.9%
- By 2100
- 1,497,296 · +66.4%
Race, ethnicity, and origin ACS 2023
- Neighborhood character
- Predominantly White (66%)
- Race & ethnicity
- White 66% Two or more races 13% Hispanic / Latino 13% Native American 7% Asian 5% Black 1%
- Hispanic origin (detail)
- Mexican 9%
- Common ancestry
- Portuguese 6% Iranian 3% Lithuanian 2%
- Foreign-born
- 9% · Canada, China, South Korea
- Languages at home
- 86% English-only · Spanish 8% Russian/Polish/Slavic 1% Tagalog/Filipino 1%
Political lean MEDSL · Snohomish
- 2024 margin
- D (+19.0) · D 57.8% · R 38.9% · Other 3.3%
- 2008→2024 swing
- +0.1pp no change · 2008: 18.9pp · 2024: 19.0pp
- All cycles
- 2024: D+19.0 2020: D+20.6 2016: D+16.6 2012: D+16.2 2008: D+18.9
Not yet ingested
- Civics
- —
Market trends
- HPI YoY
- ▼ -666.16%
- Current HPI
- 305.285
- Rent YoY
- ▲ 2.30%
- Metro
- Seattle-Tacoma-Bellevue, WA
- State GDP YoY
- ▲ 4.65%
- F500 in state
- 22
Industry mix (Fortune 500 HQ in WA)
| Industry | F500 HQs | Revenue |
|---|---|---|
| Retail | 2 | $269B |
|
||
| Technology / Retail | 1 | $638B |
|
||
| Technology | 1 | $245B |
|
||
| Telecommunications | 1 | $38B |
|
||
| Food / Beverage | 1 | $36B |
|
||
| Automotive / Trucks | 1 | $34B |
|
||
Price history
+13.3% since first listed6 events — show timeline
- 2026-04-23 Price Changed $85,000 NWMLS as Distributed by MLS Grid
- 2026-04-07 Price Changed $87,500 NWMLS as Distributed by MLS Grid
- 2026-03-10 Listed $92,000 NWMLS as Distributed by MLS Grid
- 2023-10-18 Sold (MLS) $70,000 NWMLS as Distributed by MLS Grid
- 2023-09-14 Pending — NWMLS as Distributed by MLS Grid
- 2023-07-14 Listed $75,000 NWMLS as Distributed by MLS Grid
Property tax history
-9.6%/yrLatest (2026): $50 · -90.9% YoY. Source: county tax records.
Cash-flow waterfall
monthlySold comps — $/sqft
last 12 mo · ≤1 miLoading sold comps…