5625 Morse Ave · Jacksonville, FL
Flood risk 1/10 · Minimal
- FEMA flood zone
- X (unshaded)
- Chance of flooding over 30 yrs
- 0.0%
- Est. flood insurance / yr
- $507 – $1,088
Fire risk 5/10 · Moderate
- Est. fire insurance / yr
- $947 – $1,759
Heat risk 8/10 · Major
- Hot days now (above 107°F)
- 7 days/yr
- Hot days in 30 yrs
- 19 days/yr
Wind risk 10/10 · Severe
- Chance of severe wind over 30 yrs
- 99.0%
Air-quality risk 3/10 · Minor
- Unhealthy air days now
- 3 days/yr
- Unhealthy air days in 30 yrs
- 3 days/yr
Risk factors via First Street. Map © Google.
Why this score? — see what drove the B+ grade
The composite is a weighted blend of 9 inputs, each scored 0–100. Each bar is that input's sub-score; the figure is the points it added to the 100-point composite (weight × sub-score).
- Cash flow +30.0/30.0
- ARV discount +15.0/15.0
- DSCR +10.0/10.0
- 1% rule +9.7/10.0
- Livability +4.2/5.0
- Schools +3.9/10.0
- Rent growth +3.1/5.0
- Condition / age +2.5/5.0
- Appreciation +0.0/10.0
$119,000
🖨 Deal sheet 📄 Offer letter ✓ Due diligence
Listing remarks MLS
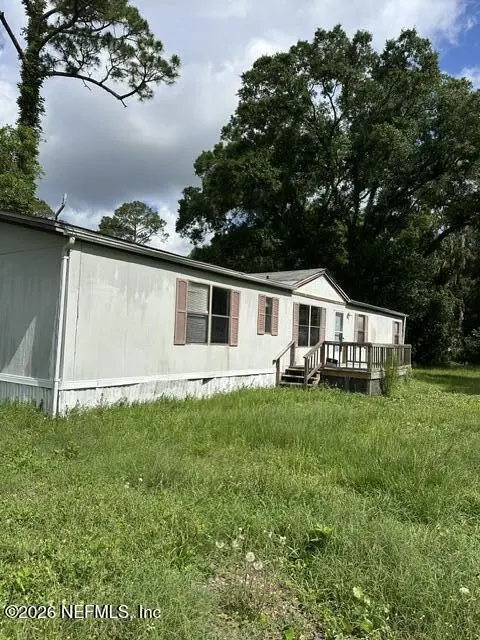
3/3 manufactured. The house needs lots of work, basically selling for land value.
Key facts
- 0.42 acre lot
- Built 1988
- Listed 19 days
Property features AI
Finance
- HOA & community: Not a senior community
Exterior
- Parking: Other parking
- Utilities: Septic tank; Electricity connected
- Home design: Double wide manufactured home; Single-story
- Construction: Shingle roof
- Exterior features: Front porch; Additional porch; Back yard fencing; City street frontage; Asphalt road surface; Lot approximately 0.42 acres
Interior
- Kitchen: Dishwasher; Electric oven; Electric range; Refrigerator
- Bedrooms: 3 bedrooms (one located on the main level)
- Flooring: Laminate
- Bathrooms: 3 full bathrooms
- Heating & cooling: Central heating; Electric heating; Heat pump; Central air conditioning; Electric cooling
- Interior features: Breakfast bar
- Laundry & utility: Electric water heater
Neighborhood map
What this means for you Summary
Snapshot
- This is a 3-bed/3.0-bath manufactured listed at $119k.
Deal economics
- At list price, monthly cash flow is $551 ($7k/yr) — positive.
- The deal already cash-flows at list — no discount required.
- Meets the 1% rule at list price ($2k rent vs $119k).
- Recommended offer: $117k (1.5% below list) — sets the bar for market timing.
- Cap rate 11.8% vs local median 4.0% in Jacksonville — top-decile yield for the area; either an underpriced asset or a hidden risk that comps aren't pricing in. Stress-test before assuming the spread holds.
Location & tenants
- Location reads 83/100 on livability (#50 in FL, #911 nationally) — a professional / high-income tenant draw. Strengths: amenities A+, commute A+, housing A+.
- Duval (urban): math 46% / reading 45% proficiency, ranked #48 of 73 in FL (top 66%) — families likely to look elsewhere, expect single-tenant / working-renter base with shorter leases.
- Zoned schools: Timucuan Elementary School (math 34% / reading 22%, grade F, #1,951 of 2,144 statewide, top 91%, 491 students, 77% FRL); Westside Middle School (math 25% / reading 22%, grade F, #536 of 571 statewide, top 95%, 593 students, 70% FRL); Westside High School (math 26% / reading 19%, grade F, #539 of 667 statewide, top 81%, 1,583 students, 63% FRL) — zoned schools average 70% FRL vs 49% district-wide (21 pts higher); higher-poverty schools than district average — tighter screening recommended.
- Zoned-school proficiency averages 25% at this address vs 46% district-wide (-21 pts) — the specific schools serving this property underperform the Duval average; the district grade overstates school quality for this exact location.
- Market conditions: Rents rising (+2.2%/yr); 349 active listings in the ZIP; 35 comparable units currently listed for rent nearby; rentals at typical pace (median 16d on market — plan ~3-4 weeks tenant-placement turnaround); 6,503 units permitted in Duval County in 2024 (1,131 in 5+ unit buildings).
Forward outlook
- Local home prices are declining (-3.0%/yr); year-one equity from $823 of loan paydown is wiped out by about $4k of value loss. Plan a longer hold.
- Duval County population projected at +19% by 2050 — long-run rental-demand tailwind backs the buy-and-hold thesis.
- At projected returns (-3.0% appreciation + 2.2% rent growth), your $33k cash investment doubles in ~7 years — after that, you're playing with house money.
Negotiation context
- It's been on market 20 days — a 2% lower offer ($117k) is reasonable based on typical stale-listing flexibility.
- 2 sale attempts since 10y ago with the ask held roughly flat each time — persistent listings suggest the price (not the market) is what's stuck; bring a comps-based counter.
- Current owner paid $15k; list at $119k implies a 693% gain — meaningful room to come down on a strong offer.
Risks & watch-outs
- Climate carrying-cost: severe wind risk, 99% chance of damaging wind over 30y; moderate wildfire risk; extreme-heat days projected 7→19/yr by 2055 (HVAC capex compounding) — expect insurance premiums to compound above CPI over the hold.
Questions for the listing agent
- Is there a deadline driving the sale (1031 exchange, divorce, estate, relocation)? That informs how much negotiation room exists.
- Schools are B-rated — typically a magnet for longer-tenancy family renters. What's the average tenant stay here, and is there a school-zone premium baked into asking?
- What's the average days-on-market for RENTAL listings here right now (not sales)? A rising rental-DOM trend means longer vacancies and softer asking-rent achievability than the comps imply.
- What's the recent tenant-quality profile in this submarket — average credit score on applications, eviction rate, late-payment / NSF rate, and stable-employment percentage? A property-management company in the area should have these aggregated.
- How much new for-sale + rental construction is in the pipeline within 1–3 miles? Heavy new supply typically softens prices + rents 12–24 months out; constrained supply supports both.
Investment metrics
- 1% rule
- 1.47% ✓
- Cap rate
- 11.85%
- Cash-on-cash
- 19.83%
- DSCR
- 1.88
- GRM
- 5.7
CMA / ARV
- ARV (on-the-fly)
- $223,146
- Comps found
- 2
Show comp detail 2 sales within ~0.75 mi
| Address | Dist | Beds/Ba | Sqft | Sold | Price | $/sf | Match |
|---|---|---|---|---|---|---|---|
| 6517 Aline Rd | 0.48mi | 3/2.0 | 1,431 (-6%) | 3mo | $210,000 | $147 | 62 |
| 6387 Sundown Dr | 0.70mi | 3/2.0 | 1,296 (-15%) | 11mo | $158,000 | $122 | 29 |
Match score weights: distance 35% · size 25% · config 20% · recency 20%. Top-matched comps best support the ARV.
Projected returns pro-forma
-3.0% appreciation · 2.25% rent growth · sell at horizon
- IRR
- 11.1%
- Equity multiple
- 1.44×
- Total profit
- $14,515
- Equity at exit
- $17,743
- IRR
- 19.5%
- Equity multiple
- 2.58×
- Total profit
- $52,643
- Equity at exit
- $10,289
Cash invested: $33,320 (down + closing). Projections, not guarantees.
Landlord ↔ Tenant lean methodology
- Overall (STATE)
- 87 Strongly Landlord-Friendly
- State Florida
- 87 Strongly Landlord-Friendly · R+3
- County
- — inherits STATE
- City
- — inherits STATE
ZIP-level market 32244
- Home prices YoY
- -17.8%
- Rents YoY
- 2.2%
- Active inventory
- 349
- Price-to-rent
- 5.7×
Monthly cashflow live
- Estimated rent
- $1,744 high interval (Pro) →
- Mortgage (P&I)
- −$624
- Tax from tax record
- −$153 /mo · $1,841/yr
- Insurance
- −$50
- HOA
- −$0
- Vacancy / Maint / Mgmt
- −$366
- Net cashflow
- $551
Break-even live
UW: 25.0% down · 7.5% · 30yr · 1.5% tax · 5.0% vac · 8.0% maint · 8.0% mgmt
Financing live
Cash to close
- Down payment
- $29,750
- Closing costs
- $3,570
- Reserves months
- —
- Total cash needed
- —
Loan-product check · same deal, 3 products live
Conventional
25% down · 7.5% · 30yr
- Down + closing
- —
- Monthly P&I
- —
- Monthly cashflow
- —
- DSCR
- —
- Eligible?
- —
Personal DTI + credit; lowest rate.
DSCR
20% down · 8.5% · 30yr
- Down + closing
- —
- Monthly P&I
- —
- Monthly cashflow
- —
- DSCR
- —
- Eligible?
- —
No personal income docs; deal must DSCR.
Hard money
10% down · 12.0% · 12mo
- Down + closing
- —
- Monthly P&I
- —
- Monthly cashflow
- —
- DSCR
- —
- Eligible?
- —
Short-term bridge; refi at stabilization.
Rent comps 35 comps
| Address | Beds | Baths | Sqft | Rent | $/sqft | DOM | Units | Dist |
|---|---|---|---|---|---|---|---|---|
| 5639 Bullseye Cir Jacksonville, FL | 3.0 | 2.0 | 1574 | $1,825 | $1.16 | 23d | 1 | 0.26mi |
| 5726 Ovella Rd Jacksonville, FL | 3.0 | 2.0 | 1579 | $1,650 | $1.04 | 23d | 1 | 0.29mi |
| 5433 Lafayette Park Dr N Jacksonville, FL | 4.0 | 2.0 | 2108 | $2,600 | $1.23 | 23d | 1 | 0.46mi |
| 6983 Lafayette Park Dr Jacksonville, FL | 4.0 | 2.0 | 1854 | $1,916 | $1.03 | 13d | 1 | 0.49mi |
| 6985 Ortega Woods Dr Unit 8 Jacksonville, FL | 3.0 | 2.0 | 1157 | $1,350 | $1.17 | 2d | 1 | 0.55mi |
| 5900 Townsend Rd Jacksonville, FL | 1.0–3.0 | 1.0–2.0 | 1177 | $1,699 | $1.44 | 2d | 12 | 0.73mi |
| 6051 Maggies Cir #107 Jacksonville, FL | 3.0 | 2.0 | 1335 | $1,400 | $1.05 | 21d | 1 | 0.80mi |
| 6111 Maggies Cir #107 Jacksonville, FL | 3.0 | 2.0 | 1335 | $1,350 | $1.01 | 23d | 1 | 0.82mi |
| 6112 Maggies Cir #108 Jacksonville, FL | 3.0 | 2.0 | 1335 | $1,375 | $1.03 | 23d | 1 | 0.85mi |
| 6105 Maggies Cir #115 Jacksonville, FL | 3.0 | 2.0 | 1335 | $1,425 | $1.07 | 1d | 1 | 0.85mi |
| 6105 Maggies Cir Jacksonville, FL | 2.0–3.0 | 2.0 | 1121 | $1,445 | $1.29 | 17d | 2 | 0.85mi |
| 6063 Maggies Cir Jacksonville, FL | 2.0–3.0 | 2.0 | 1121 | $1,350 | $1.20 | 16d | 2 | 0.86mi |
| 6063 Maggies Cir #110 Jacksonville, FL | 3.0 | 2.0 | 1335 | $1,350 | $1.01 | 4d | 1 | 0.86mi |
| 6099 Maggies Cir #101 Jacksonville, FL | 3.0 | 2.0 | 1335 | $1,650 | $1.24 | 17d | 1 | 0.91mi |
| 6094 Maggies Cir #107 Jacksonville, FL | 3.0 | 2.0 | 1335 | $1,425 | $1.07 | 14d | 1 | 0.92mi |
| 6087 Maggies Cir #104 Jacksonville, FL | 2.0 | 2.0 | 1099 | $1,275 | $1.16 | 23d | 1 | 0.96mi |
| 6221 Alfredo Dr W Jacksonville, FL | 3.0 | 2.0 | 1133 | $1,710 | $1.51 | 4d | 1 | 1.01mi |
| 5983 Ortega Lake Dr Unit 1 Jacksonville, FL | 3.0 | 2.5 | 1400 | $1,950 | $1.39 | 23d | 1 | 1.05mi |
| 7350 Blanding Blvd Jacksonville, FL | 1.0–3.0 | 1.0–2.0 | 872 | $1,637 | $1.88 | 2d | 23 | 1.09mi |
| 6136 Blanding Blvd Jacksonville, FL | 1.0–3.0 | 1.0–2.0 | 1030 | $2,020 | $1.96 | 1d | 9 | 1.13mi |
| 5626 Bryner Dr Jacksonville, FL | 2.0 | 3.0 | 1404 | $1,320 | $0.94 | 21d | 1 | 1.14mi |
| 5642 Bryner Dr Jacksonville, FL | 2.0 | 1.5 | 1406 | $1,290 | $0.92 | 21d | 1 | 1.14mi |
| 6024 Du Clay Rd Jacksonville, FL | 2.0 | 2.5 | 1278 | $1,400 | $1.10 | 1d | 1 | 1.18mi |
| 6028 Du Clay Rd Jacksonville, FL | 2.0 | 3.0 | 1308 | $1,500 | $1.15 | 23d | 1 | 1.18mi |
| 7557 Cliff Cottage Dr Jacksonville, FL | 3.0 | 2.0 | 1480 | $1,875 | $1.27 | 23d | 1 | 1.19mi |
| 7178 Cypress Cove Rd #25 Jacksonville, FL | 3.0 | 2.0 | 1875 | $2,000 | $1.07 | 23d | 1 | 1.20mi |
| 7485 Cliff Cottage Dr Jacksonville, FL | 3.0 | 2.0 | 1724 | $1,750 | $1.02 | 23d | 1 | 1.21mi |
| 5939 Pueblo Ct Jacksonville, FL | 4.0 | 2.0 | 1288 | $1,495 | $1.16 | 7d | 1 | 1.28mi |
| 5357 Whitecastle Ct Jacksonville, FL | 3.0 | 2.0 | 1916 | $2,099 | $1.10 | 16d | 1 | 1.30mi |
| 6038 Bizier Rd Unit 6036 Jacksonville, FL | 3.0 | 2.0 | 1975 | $1,745 | $0.88 | 14d | 1 | 1.32mi |
| 6428 Hannah Stables Dr Jacksonville, FL | 3.0 | 2.0 | 1613 | $1,800 | $1.12 | 1d | 1 | 1.42mi |
| 6637 Gentle Oaks Dr E Jacksonville, FL | 3.0 | 2.0 | 1158 | $1,695 | $1.46 | 23d | 1 | 1.45mi |
| 6637 Gentle Oaks Dr E Jacksonville, FL | 3.0 | 2.0 | 1158 | $1,695 | $1.46 | 16d | 1 | 1.45mi |
| 7610 Blanding Blvd Jacksonville, FL | 1.0–3.0 | 1.0–2.0 | 880 | $1,300 | $1.48 | 14d | 1 | 1.47mi |
| 6648 Gentle Oaks Dr E Jacksonville, FL | 3.0 | 2.0 | 1412 | $1,690 | $1.20 | 1d | 1 | 1.48mi |
Listing history 14 events
-
2026-06-18days on market $119,000 Active 20 DOM
-
2026-06-17days on market $119,000 Active 19 DOM
-
2026-06-16days on market $119,000 Active 18 DOM
-
2026-06-15days on market $119,000 Active 17 DOM
-
2026-06-13days on market $119,000 Active 15 DOM
-
2026-06-13days on market $119,000 Active 14 DOM
-
2026-06-10days on market $119,000 Active 11 DOM
-
2026-06-08days on market $119,000 Active 10 DOM
-
2026-06-07days on market $119,000 Active 9 DOM
-
2026-06-05days on market $119,000 Active 6 DOM
-
2026-06-03days on market $119,000 Active 5 DOM
-
2026-06-02days on market $119,000 Active 4 DOM
-
2026-06-01days on market $119,000 Active 3 DOM
-
2026-05-31days on market $119,000 Active 2 DOM
ⓘ Source: listings_history table (triggers on properties + properties_extension) + one-shot
backfill from property_details.listing_events for pre-trigger history.
Tax reassessment forecast FL · Resets to sale price
- Current annual tax
- $1,841 · $153/mo
- Projected year-2 tax
- $1,841 · $153/mo
- Expected delta
- $0/yr ($0/mo · 0.0%)
ⓘ Screening estimate from a state-policy table — verify with the county assessor before closing.
Climate risk First Street
- Flood 1/10 Low FEMA zone X (unshaded) · 0% chance over 30 yrs
- Wildfire 5/10 Major
- Heat 8/10 Severe 7 d/yr ≥107°F today · 19 d/yr by 30 yrs out
- Wind 10/10 Extreme 99% chance of damaging wind over 30 yrs
- Air quality 3/10 Moderate 3 unhealthy d/yr today · 3 by 30 yrs out
Nearby sold comps map
Loading sold comps map…
Walkable amenities ~0.75 mi
Loading nearby amenities…
Taxation est. · year 1
- Rental income
- $20,928
- − Mortgage interest
- −$6,666
- − Property taxes
- −$1,841
- − Insurance
- −$595
- − Repairs & maintenance
- −$1,674
- − Management
- −$1,674
- − Depreciation
- −$3,462
- Taxable income
- $5,016
- Est. tax owed @ 24.0%
- −$1,204
- After-tax cash flow
- $5,405/yr
For passive investors: Depreciation is non-cash, so a rental often shows a tax loss while cash-flowing — sheltering income. Rental losses are passive: they offset passive income freely, and up to $25,000/yr can offset ordinary (W-2) income if you actively participate and your MAGI is under $100k (phasing out to $0 by $150k); unused losses carry forward. On sale, claimed depreciation is recaptured at up to 25%, and gains may owe capital-gains tax (a 1031 exchange can defer both). Figures are a year-1 estimate at your 24.0% rate — not tax advice; consult a CPA.
Schools (NCES district)
- District
- Duval
- NCES district ID
- 1200480
- Math proficiency
- 46% ▼ -11.00%
- Reading proficiency
- 45% ▼ -4.00%
- Median HH income
- $48,987
- Composite
- 38.97/100
- National rank
- #4076
- State rank
- #48 of 73 in FL
Livability — Jacksonville
- Score
- 83/100
- State rank
- #50
- US rank
- #911
Category grades
Schools grade is shown separately in the Schools card above.
Census & demographics
- Census place
- Jacksonville, FL
- County
- Duval County · 1,015,274 people
- City population
- 979,034
- Metro
- Jacksonville, FL
- Population (ZIP)
- 63,592
- Household income
- $62,204
- Rent vs Own
- Severe rent burden
- 2799.0
Population outlook (Duval County) Hauer SSP2
- Today (2025)
- 1,013,010 people
- By 2030
- 1,059,228 · +4.6%
- By 2040
- 1,141,439 · +12.7%
- By 2050
- 1,205,258 · +19.0%
- By 2075
- 1,324,282 · +30.7%
- By 2100
- 1,319,620 · +30.3%
Race, ethnicity, and origin ACS 2023
- Neighborhood character
- Highly diverse neighborhood (Simpson 0.70)
- Race & ethnicity
- White 39% Black 35% Hispanic / Latino 15% Two or more races 10% Asian 6%
- Hispanic origin (detail)
- Mexican 3% Puerto Rican 6% Cuban 3%
- Common ancestry
- Hispanic 1% Lithuanian 1% Romanian 1%
- Foreign-born
- 12% · Canada, Vietnam, China
- Languages at home
- 83% English-only · Spanish 9% Tagalog/Filipino 3% French/Haitian/Cajun 2%
Political lean MEDSL · Duval
- 2024 margin
- Toss-up / Even · D 48.7% · R 50.1% · Other 1.2%
- 2008→2024 swing
- +0.4pp no change · 2008: -1.9pp · 2024: -1.5pp
- All cycles
- 2024: R+1.5 2020: D+3.8 2016: R+1.5 2012: R+3.6 2008: R+1.9
Not yet ingested
- Civics
- —
Market trends
- HPI YoY
- ▼ -64.22%
- Current HPI
- 296.5375
- Rent YoY
- ▲ 2.25%
- Metro
- Jacksonville, FL
- State GDP YoY
- ▲ 3.28%
- F500 in state
- 36
Industry mix (Fortune 500 HQ in FL)
| Industry | F500 HQs | Revenue |
|---|---|---|
| Industrial Technology | 2 | $29B |
|
||
| Insurance | 2 | $17B |
|
||
| Retail | 1 | $60B |
|
||
| Technology Distribution | 1 | $58B |
|
||
| Homebuilding | 1 | $35B |
|
||
| Technology Manufacturing | 1 | $35B |
|
||
Price history
+693.3% since first listed3 events — show timeline
- 2026-05-30 Listed $119,000 realMLS
- 2016-11-09 Listed $20,000 realMLS
- 2016-11-04 Sold (MLS) $15,000 realMLS
Property tax history
+9.1%/yrLatest (2025): $1,841 · +40.0% YoY. Source: county tax records.
Cash-flow waterfall
monthlySold comps — $/sqft
last 12 mo · ≤1 miLoading sold comps…