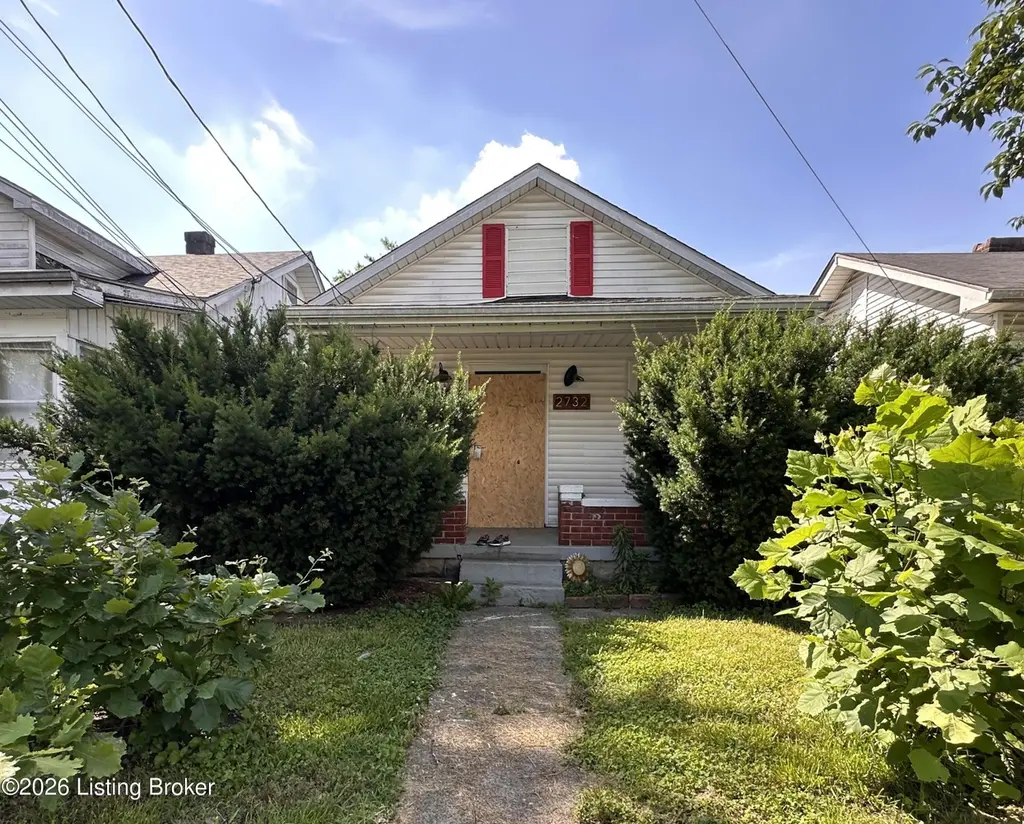
2732 Montana Ave · Louisville, KY
Flood risk 1/10 · Minimal
- FEMA flood zone
- X (unshaded)
- Chance of flooding over 30 yrs
- 0.0%
- Est. flood insurance / yr
- $507 – $1,088
Fire risk 1/10 · Minimal
- Est. fire insurance / yr
- $839 – $1,559
Heat risk 5/10 · Moderate
- Hot days now (above 104°F)
- 7 days/yr
- Hot days in 30 yrs
- 20 days/yr
Wind risk 2/10 · Minimal
- Chance of severe wind over 30 yrs
- 1.0%
Air-quality risk 2/10 · Minimal
- Unhealthy air days now
- 1 days/yr
- Unhealthy air days in 30 yrs
- 3 days/yr
Risk factors via First Street. Map © Google.
Why this score? — see what drove the C grade
The composite is a weighted blend of 9 inputs, each scored 0–100. Each bar is that input's sub-score; the figure is the points it added to the 100-point composite (weight × sub-score).
- Cash flow +19.5/30.0
- ARV discount +15.0/15.0
- DSCR +6.2/10.0
- 1% rule +4.7/10.0
- Rent growth +4.0/5.0
- Livability +3.2/5.0
- Condition / age +2.5/5.0
- Schools +2.3/10.0
- Appreciation +0.0/10.0
$114,900
🖨 Deal sheet (PDF) 📄 Offer letter ✓ Due diligence
Listing remarks MLS
Adorable 2 bedroom home centrally located for a quick commute to anywhere in the city! This home features a welcoming covered front porch and a spacious 2 car garage for secured, off-street parking. Whether you are planning to be an owner occupant or an investor looking to expand your portfolio, this home is a perfect fit. The home was previously rented for $975/month on a 1 year lease but is now ready for a new occupant. The living room is open to the dining area giving the home a spacious feel. The kitchen offers room for a small table and there is a laundry area just off the kitchen as you head out the back door. The back yard is fenced with a walkway leading to the garage. Make sure you get a chance to see this home while it is still available - schedule a showing today!
Key facts
- Large dining room
- Large eat-in kitchen
- Open living area
Tags
Property features AI
Finance
- HOA & community: No association fee; No monthly maintenance
Exterior
- Parking: Detached 2-car garage
- Utilities: Electricity connected
- Home design: Single-family residence in Cape Cod style; One story
- Construction: Built in 1925; Vinyl siding and brick exterior; Shingle roof; Crawl space foundation
- Exterior features: Cleared lot; Chain-link fencing
Interior
- Kitchen: Kitchen on the first floor
- Bedrooms: Two bedrooms (both on the first floor); Primary bedroom on the first floor
- Bathrooms: One full bathroom
- Heating & cooling: Electric heating; Central air conditioning
- Interior features: Four total rooms; One fireplace
- Laundry & utility: First-floor laundry
Neighborhood map
What this means for you Summary
Snapshot
- This is a 2-bed/1.0-bath single-family listed at $115k.
Deal economics
- At list price, monthly cash flow is $130 ($2k/yr) — positive.
- The deal already cash-flows at list — no discount required.
- To meet the 1% rule (rent ≥ 1% of price), the offer needs to be $111k (3.3% below list).
- Recommended offer: $111k (3.3% below list) — sets the bar for 1% rule.
- Cap rate 7.7% vs local median 5.0% in Louisville — top-decile yield for the area; either an underpriced asset or a hidden risk that comps aren't pricing in. Stress-test before assuming the spread holds.
Location & tenants
- Location reads 63/100 on livability (#333 in KY) — a middle-class / working-renter tenant base. Strengths: cost of living A+, housing A+; Watch: employment C-, health & safety D+, crime F.
- Jefferson County (urban): math 19% / reading 35% proficiency, ranked #121 of 165 in KY (top 73%) — low school quality limits family demand, transient renter base, plan for 1-2y turnover.
- Zoned schools: Frayser Elementary (math 2% / reading 8%, grade F, #670 of 676 statewide, top 100%, 318 students, 80% FRL) — zoned schools average 80% FRL vs 56% district-wide (24 pts higher); higher-poverty schools than district average — tighter screening recommended.
- Zoned-school proficiency averages 5% at this address vs 27% district-wide (-22 pts) — the specific schools serving this property underperform the Jefferson County average; the district grade overstates school quality for this exact location.
- Market conditions: Rents rising fast (+6.1%/yr); 77 active listings in the ZIP; 40 comparable units currently listed for rent nearby; rentals at typical pace (median 24d on market — plan ~3-4 weeks tenant-placement turnaround); lower-income renter base — watch delinquency; 2,836 units permitted in Jefferson County in 2024 (1,558 in 5+ unit buildings).
Forward outlook
- Local home prices are declining (-3.0%/yr); year-one equity from $794 of loan paydown is wiped out by about $3k of value loss. Plan a longer hold.
- Jefferson County population projected at +13% by 2050 — modest demand growth; plan on rents tracking national, not racing it.
Negotiation context
- Only 13 days on market — expect competitive offers; lowballing is unlikely to land.
- 8 sale attempts since 22y ago with the ask held roughly flat each time — persistent listings suggest the price (not the market) is what's stuck; bring a comps-based counter.
- Current owner paid $92k; 25% above their basis — modest negotiation headroom, anchor on the comps not their cost.
Risks & watch-outs
- Watch-outs: built in 1925 — expect roof / HVAC / electrical / plumbing capex.
- Climate carrying-cost: extreme-heat days projected 7→20/yr by 2055 (HVAC capex compounding) — expect insurance premiums to compound above CPI over the hold.
Questions for the listing agent
- Built in 1925 — when were the roof, HVAC, electrical panel, plumbing, and water heater last replaced?
- Is there a deadline driving the sale (1031 exchange, divorce, estate, relocation)? That informs how much negotiation room exists.
- Schools are D-rated, which usually means shorter tenancies and higher turnover. Who's the typical renter profile here, and what's been the actual vacancy rate?
- Crime grade is F in this area — have there been break-ins, vandalism, or insurance claims at this property in the last 3 years? What carrier currently insures it and at what premium?
- What's the average days-on-market for RENTAL listings here right now (not sales)? A rising rental-DOM trend means longer vacancies and softer asking-rent achievability than the comps imply.
- What's the recent tenant-quality profile in this submarket — average credit score on applications, eviction rate, late-payment / NSF rate, and stable-employment percentage? A property-management company in the area should have these aggregated.
- How much new for-sale + rental construction is in the pipeline within 1–3 miles? Heavy new supply typically softens prices + rents 12–24 months out; constrained supply supports both.
Investment metrics
- 1% rule
- 0.97% ✗
- Cap rate
- 7.65%
- Cash-on-cash
- 4.86%
- DSCR
- 1.22
- GRM
- 8.6
CMA / ARV
- ARV (on-the-fly)
- $140,600
- Comps found
- 12
Show comp detail 12 sales within ~0.75 mi
| Address | Dist | Beds/Ba | Sqft | Sold | Price | $/sf | Match |
|---|---|---|---|---|---|---|---|
| 520 M St | 0.29mi | 2/1.0 | 986 (+4%) | 2mo | $57,500 | $58 | 78 |
| 611 Colorado Ave | 0.37mi | 2/1.0 | 925 (-3%) | 1mo | $110,000 | $119 | 78 |
| 528 M St | 0.27mi | 3/2.0 (+1) | 944 (-1%) | 1mo | $142,000 | $150 | 76 |
| 1148 Euclid Ave | 0.45mi | 3/1.0 (+1) | 950 (0%) | 2mo | $150,000 | $158 | 72 |
| 810 Weller Ave | 0.18mi | 2/1.0 | 840 (-12%) | 2mo | $124,000 | $148 | 71 |
| 1315 Weller Ave | 0.49mi | 2/1.0 | 996 (+5%) | 3mo | $125,000 | $126 | 67 |
| 1325 Lillian Ave | 0.28mi | 2/1.0 | 847 (-11%) | 3mo | $140,000 | $165 | 66 |
| 1200 Tennessee Ave | 0.44mi | 3/1.5 (+1) | 920 (-3%) | 3mo | $145,000 | $158 | 65 |
| 511 M St | 0.31mi | 3/1.0 (+1) | 1,075 (+13%) | 3mo | $135,000 | $126 | 56 |
| 1332 Phyllis Ave | 0.61mi | 2/1.0 | 1,030 (+8%) | 2mo | $150,000 | $146 | 56 |
| 1323 Thornberry Ave | 0.54mi | 2/1.0 | 823 (-13%) | 1mo | $140,000 | $170 | 51 |
| 1605 Arcade Ave | 0.73mi | 2/1.0 | 1,020 (+7%) | 3mo | $82,700 | $81 | 51 |
Match score weights: distance 35% · size 25% · config 20% · recency 20%. Top-matched comps best support the ARV.
Projected returns pro-forma
-3.0% appreciation · 6.06% rent growth · sell at horizon
- IRR
- -5.5%
- Equity multiple
- 0.79×
- Total profit
- $-6,806
- Equity at exit
- $17,132
- IRR
- 7.3%
- Equity multiple
- 1.63×
- Total profit
- $20,111
- Equity at exit
- $9,934
Cash invested: $32,172 (down + closing). Projections, not guarantees.
Landlord ↔ Tenant lean methodology
- Overall (STATE)
- 83 Strongly Landlord-Friendly
- State Kentucky
- 83 Strongly Landlord-Friendly · R+16
- County
- — inherits STATE
- City
- — inherits STATE
ZIP-level market 40208
- Home prices YoY
- -23.3%
- Rents YoY
- 6.1%
- Active inventory
- 77
- Price-to-rent
- 8.6×
Monthly cashflow live
- Estimated rent
- $1,111 high interval (Pro) →
- Mortgage (P&I)
- −$603
- Tax from tax record
- −$97 /mo · $1,159/yr
- Insurance
- −$48
- HOA
- −$0
- Lot rent
- −$0
- Vacancy / Maint / Mgmt
- −$233
- Net cashflow
- $130
Break-even live
Sensitivity live
| Price | -10% $195 | -5% $163 | +0% $130 | +5% $98 | +10% $65 |
|---|---|---|---|---|---|
| Rent | -10% $43 | -5% $86 | +0% $130 | +5% $174 | +10% $218 |
| Rate | -1.0pp $188 | -0.5pp $160 | base $130 | +0.5pp $101 | +1.0pp $70 |
UW: 25.0% down · 7.5% · 30yr · 1.5% tax · 5.0% vac · 8.0% maint · 8.0% mgmt
Financing live
Cash to close
- Down payment
- $28,725
- Closing costs
- $3,447
- Reserves months
- —
- Total cash needed
- —
Loan-product check · same deal, 3 products live
Conventional
25% down · 7.5% · 30yr
- Down + closing
- —
- Monthly P&I
- —
- Monthly cashflow
- —
- DSCR
- —
- Eligible?
- —
Personal DTI + credit; lowest rate.
DSCR
20% down · 8.5% · 30yr
- Down + closing
- —
- Monthly P&I
- —
- Monthly cashflow
- —
- DSCR
- —
- Eligible?
- —
No personal income docs; deal must DSCR.
Hard money
10% down · 12.0% · 12mo
- Down + closing
- —
- Monthly P&I
- —
- Monthly cashflow
- —
- DSCR
- —
- Eligible?
- —
Short-term bridge; refi at stabilization.
Rent comps 40 comps
| Address | Beds | Baths | Sqft | Rent | $/sqft | DOM | Units | Dist |
|---|---|---|---|---|---|---|---|---|
| 2826 Taylor Blvd Louisville, KY | 3.0 | 1.0 | 1044 | $1,345 | $1.29 | 26d | 1 | 0.14mi |
| 1120 Weller Ave Louisville, KY | 2.0 | 1.0 | 912 | $1,250 | $1.37 | 0d | 1 | 0.16mi |
| 1055 Euclid Ave Louisville, KY | 2.0 | 1.0 | 914 | $1,325 | $1.45 | 26d | 1 | 0.23mi |
| 1301 Lillian Ave Louisville, KY | 2.0 | 1.0 | 974 | $1,050 | $1.08 | 0d | 1 | 0.24mi |
| 2716 S 6th St Louisville, KY | 1.0 | 1.0 | 881 | $950 | $1.08 | 18d | 1 | 0.26mi |
| 3107 Montana Ave Louisville, KY | 2.0 | 1.0 | 986 | $995 | $1.01 | 26d | 1 | 0.27mi |
| 508 M St Louisville, KY | 2.0 | 1.5 | 1035 | $1,100 | $1.06 | 26d | 1 | 0.34mi |
| 1305 Larchmont Ave Louisville, KY | 2.0 | 1.0 | 1113 | $1,350 | $1.21 | 18d | 1 | 0.39mi |
| 1122 Larchmont Ave Louisville, KY | 2.0 | 1.0 | 864 | $750 | $0.87 | 18d | 1 | 0.42mi |
| 1122 Larchmont Ave Unit B Louisville, KY | 2.0 | 1.0 | 864 | $750 | $0.87 | 26d | 1 | 0.42mi |
| 1122 Larchmont Ave Unit B Louisville, KY | 1.0 | 1.0 | 700 | $750 | $1.07 | 19d | 1 | 0.42mi |
| 2719 S 4th St Unit 4 Louisville, KY | 2.0 | 1.0 | 800 | $925 | $1.16 | 0d | 1 | 0.47mi |
| 2805 S 4th St #1 Louisville, KY | 1.0 | 1.0 | 750 | $725 | $0.97 | 23d | 1 | 0.48mi |
| 2501 S 4th St Louisville, KY | 1.0–3.0 | 1.0–3.0 | 897 | $3,732 | $4.16 | 5d | 1 | 0.53mi |
| 1438 Lillian Ave Louisville, KY | 2.0 | 1.0 | 777 | $1,050 | $1.35 | 19d | 1 | 0.53mi |
| 2501 S 3rd St Louisville, KY | 1.0–2.0 | 1.0–2.0 | 1018 | $1,550 | $1.52 | 0d | 3 | 0.57mi |
| 2913 S 3rd St Louisville, KY | 2.0 | 1.0 | 1026 | $1,200 | $1.17 | 26d | 1 | 0.60mi |
| 1637 Thornberry Ave Louisville, KY | 2.0 | 1.0 | 700 | $1,250 | $1.79 | 5d | 1 | 0.63mi |
| 623 Dresden Ave Louisville, KY | 2.0 | 1.0 | 750 | $975 | $1.30 | 18d | 1 | 0.91mi |
| 615 Dresden Ave Louisville, KY | 3.0 | 1.0 | 884 | $1,450 | $1.64 | 26d | 1 | 0.92mi |
| 3860 Southern Pkwy Louisville, KY | 3.0 | 1.0 | 1064 | $1,250 | $1.17 | 26d | 1 | 0.93mi |
| 1606 Algonquin Pkwy Unit 22 Louisville, KY | 2.0 | 1.0 | 626 | $750 | $1.20 | 26d | 1 | 0.95mi |
| 1501 Bellamy Pl Louisville, KY | 2.0–4.0 | 2.0–4.0 | 1074 | $1,758 | $1.64 | 5d | 1 | 0.98mi |
| 3909 Southern Pkwy Unit 2 Louisville, KY | 3.0 | 1.0 | 1000 | $1,100 | $1.10 | 5d | 1 | 0.99mi |
| 1800 S 2nd St Louisville, KY | 1.0 | 1.0 | 575 | $950 | $1.65 | 18d | 7 | 1.02mi |
| 1111 Dresden Ave Louisville, KY | 2.0 | 1.0 | 680 | $1,100 | $1.62 | 18d | 1 | 1.03mi |
| 4012 Southern Pkwy Unit 8 Louisville, KY | 1.0 | 1.0 | 600 | $795 | $1.32 | 17d | 1 | 1.08mi |
| 4012 Southern Pkwy Unit 5 Louisville, KY | 1.0 | 1.0 | 600 | $795 | $1.32 | 26d | 1 | 1.08mi |
| 1702 S 2nd St Apt 3 Louisville, KY | 1.0 | 1.0 | 625 | $875 | $1.40 | 26d | 1 | 1.10mi |
| 1702 S 2nd St Apt 1 Louisville, KY | 2.0 | 1.0 | 875 | $1,100 | $1.26 | 26d | 1 | 1.10mi |
| 409 W Gaulbert Ave Unit 201 Louisville, KY | 2.0 | 1.0 | 772 | $1,100 | $1.42 | 26d | 1 | 1.12mi |
| 1731 Sonne Ave Louisville, KY | 3.0 | 1.0 | 1010 | $1,300 | $1.29 | 18d | 1 | 1.14mi |
| 1521 S 4th St Unit 7 Louisville, KY | 2.0 | 1.0 | 750 | $1,125 | $1.50 | 26d | 1 | 1.15mi |
| 1521 S 4th St Apt 8 Louisville, KY | 1.0 | 1.0 | 700 | $900 | $1.29 | 26d | 1 | 1.15mi |
| 1521 S 4th St Unit 6 Louisville, KY | 2.0 | 1.0 | 750 | $1,025 | $1.37 | 26d | 1 | 1.15mi |
| 1521 S 4th St Unit 12 Louisville, KY | 1.0 | 1.0 | 700 | $795 | $1.14 | 23d | 1 | 1.15mi |
| 1411 Sale Ave Louisville, KY | 2.0 | 1.0 | 936 | $1,000 | $1.07 | 18d | 1 | 1.19mi |
| 415 Atwood St Louisville, KY | 1.0 | 1.0 | 770 | $995 | $1.29 | 23d | 1 | 1.20mi |
| 1726 Sonne Ave Louisville, KY | 2.0 | 1.0 | 820 | $1,095 | $1.34 | 18d | 1 | 1.22mi |
| 415 Belgravia Ct Unit 3 Louisville, KY | 2.0 | 1.0 | 700 | $800 | $1.14 | 26d | 1 | 1.23mi |
Listing history 9 events
-
2026-06-22days on market $114,900 Active 13 DOM
-
2026-06-21days on market $114,900 Active 12 DOM
-
2026-06-18days on market $114,900 Active 9 DOM
-
2026-06-17days on market $114,900 Active 8 DOM
-
2026-06-16days on market $114,900 Active 7 DOM
-
2026-06-15days on market $114,900 Active 6 DOM
-
2026-06-13days on market $114,900 Active 4 DOM
-
2026-06-10remarks 521-char remark
-
2026-06-10$114,900 Active 1 DOM
ⓘ Source: listings_history table (triggers on properties + properties_extension) + one-shot
backfill from property_details.listing_events for pre-trigger history.
Tax reassessment forecast KY · Resets to sale price
- Current annual tax
- $1,159 · $97/mo
- Projected year-2 tax
- $1,159 · $97/mo
- Expected delta
- $0/yr ($0/mo · 0.0%)
ⓘ Screening estimate from a state-policy table — verify with the county assessor before closing.
Climate risk First Street
- Flood 1/10 Low FEMA zone X (unshaded) · 0% chance over 30 yrs
- Wildfire 1/10 Low
- Heat 5/10 Major 7 d/yr ≥104°F today · 20 d/yr by 30 yrs out
- Wind 2/10 Low 100% chance of damaging wind over 30 yrs
- Air quality 2/10 Low 1 unhealthy d/yr today · 3 by 30 yrs out
Nearby sold comps map
Loading sold comps map…
Walkable amenities ~0.75 mi
Loading nearby amenities…
Taxation est. · year 1
- Rental income
- $13,327
- − Mortgage interest
- −$6,436
- − Property taxes
- −$1,159
- − Insurance
- −$574
- − Repairs & maintenance
- −$1,066
- − Management
- −$1,066
- − Depreciation
- −$3,343
- Taxable loss
- −$318
- Est. tax savings @ 24.0%
- +$76
- After-tax cash flow
- $1,640/yr
For passive investors: Depreciation is non-cash, so a rental often shows a tax loss while cash-flowing — sheltering income. Rental losses are passive: they offset passive income freely, and up to $25,000/yr can offset ordinary (W-2) income if you actively participate and your MAGI is under $100k (phasing out to $0 by $150k); unused losses carry forward. On sale, claimed depreciation is recaptured at up to 25%, and gains may owe capital-gains tax (a 1031 exchange can defer both). Figures are a year-1 estimate at your 24.0% rate — not tax advice; consult a CPA.
Schools (NCES district)
- District
- Jefferson County
- NCES district ID
- 2102990
- Math proficiency
- 19% ▼ -17.00%
- Reading proficiency
- 35% ▼ -11.00%
- Median HH income
- $47,885
- Composite
- 23.45/100
- National rank
- #7884
- State rank
- #121 of 165 in KY
Livability — Louisville
- Score
- 63/100
- State rank
- #333
- US rank
- #15887
Category grades
Schools grade is shown separately in the Schools card above.
Census & demographics
- Census place
- Louisville, KY
- County
- Jefferson County · 790,184 people
- City population
- 769,292
- Metro
- Louisville/Jefferson County, KY-IN
- Population (ZIP)
- 15,605
- Household income
- $39,560
- Rent vs Own
- Severe rent burden
- 1136.0
Population outlook (Jefferson County) Hauer SSP2
- Today (2025)
- 823,112 people
- By 2030
- 849,343 · +3.2%
- By 2040
- 895,696 · +8.8%
- By 2050
- 933,630 · +13.4%
- By 2075
- 1,028,262 · +24.9%
- By 2100
- 1,072,675 · +30.3%
Race, ethnicity, and origin ACS 2023
- Neighborhood character
- Diverse neighborhood (Simpson 0.56)
- Race & ethnicity
- White 62% Black 22% Two or more races 9% Hispanic / Latino 6% Asian 1%
- Hispanic origin (detail)
- Mexican 4%
- Common ancestry
- Italian 3% Lithuanian 2% Slovak 2%
- Foreign-born
- 5% · Canada, China, South Korea
- Languages at home
- 90% English-only · Spanish 3% French/Haitian/Cajun 1%
Political lean MEDSL · Jefferson
- 2024 margin
- D (+16.6) · D 57.4% · R 40.9% · Other 1.7%
- 2008→2024 swing
- +4.5pp toward D · 2008: 12.0pp · 2024: 16.6pp
- All cycles
- 2024: D+16.6 2020: D+20.1 2016: D+13.3 2012: D+11.1 2008: D+12.0
Not yet ingested
- Civics
- —
Market trends
- HPI YoY
- ▼ -72.97%
- Current HPI
- 240.6261
- Rent YoY
- ▲ 6.06%
- Metro
- Louisville/Jefferson County, KY-IN
- State GDP YoY
- ▲ 1.81%
- F500 in state
- 4
Industry mix (Fortune 500 HQ in KY)
| Industry | F500 HQs | Revenue |
|---|---|---|
| Healthcare | 1 | $118B |
|
||
| Food / Beverage | 1 | $7B |
|
||
Price history
+64.4% since first listed25 events — show timeline
- 2026-06-09 Listed $114,900 Metro Search MLS
- 2023-05-23 Pending — Metro Search MLS
- 2023-05-23 Sold (MLS) $92,000 Metro Search MLS
- 2023-05-22 Sold (Public Records) $92,000 Public Records
- 2023-04-10 Contingent — Metro Search MLS
- 2023-03-31 Listed $95,000 Metro Search MLS
- 2023-03-21 Sold (Public Records) $68,426 Public Records
- 2022-12-26 Listing Removed — Metro Search MLS
- 2022-12-16 Relisted — Metro Search MLS
- 2022-10-20 Pending — Metro Search MLS
- 2022-09-29 Contingent — Metro Search MLS
- 2022-09-09 Listed $95,000 Metro Search MLS
- 2018-11-02 Sold (Public Records) $75,000 Public Records
- 2018-10-30 Sold (MLS) $75,000 Metro Search MLS
- 2018-08-27 Pending — Metro Search MLS
- 2018-08-09 Contingent — Metro Search MLS
- 2018-07-27 Listed $83,000 Metro Search MLS
- 2018-07-27 Price Changed $78,000 Metro Search MLS
- 2007-08-31 Sold (Public Records) $52,000 Public Records
- 2007-08-31 Sold (MLS) $52,000 Metro Search MLS
- 2006-10-03 Listed $52,000 Metro Search MLS
- 2006-10-02 Listing Removed — Metro Search MLS
- 2006-04-02 Listed $62,500 Metro Search MLS
- 2005-02-14 Listing Removed — Metro Search MLS
- 2004-08-14 Listed $69,900 Metro Search MLS
Property tax history
+5.8%/yrLatest (2025): $1,159 · -1.9% YoY. Source: county tax records.
Cash-flow waterfall
monthlySold comps — $/sqft
last 12 mo · ≤1 miLoading sold comps…