 🏗️ New Construction
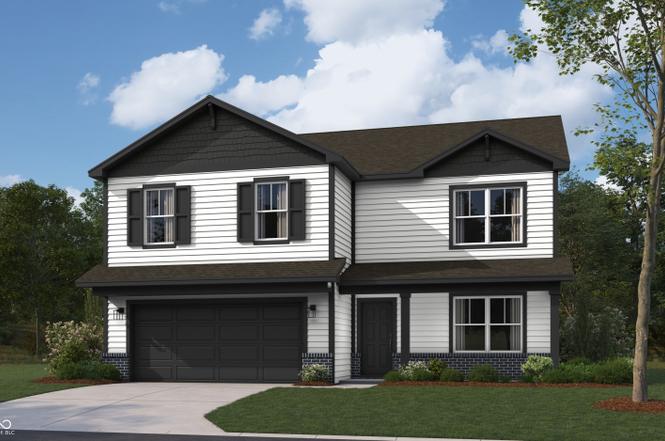
9209 Hemingway Dr · Indianapolis city (balance), IN
Flood risk 5/10 · Moderate
- FEMA flood zone
- X (unshaded)
- Chance of flooding over 30 yrs
- 0.65%
- Est. flood insurance / yr
- $507 – $1,088
Fire risk 1/10 · Minimal
- Est. fire insurance / yr
- $717 – $1,331
Heat risk 3/10 · Minor
- Hot days now (above 101°F)
- 7 days/yr
- Hot days in 30 yrs
- 19 days/yr
Wind risk 2/10 · Minimal
- Chance of severe wind over 30 yrs
- 1.0%
Air-quality risk 2/10 · Minimal
- Unhealthy air days now
- 1 days/yr
- Unhealthy air days in 30 yrs
- 2 days/yr
Risk factors via First Street. Map © Google.
Why this score? — see what drove the D- grade
The composite is a weighted blend of 9 inputs, each scored 0–100. Each bar is that input's sub-score; the figure is the points it added to the 100-point composite (weight × sub-score).
- Cash flow +9.2/30.0
- ARV discount +7.5/15.0
- Rent growth +4.0/5.0
- Schools +4.0/10.0
- 1% rule +3.0/10.0
- DSCR +2.6/10.0
- Livability +2.5/5.0
- Condition / age +2.5/5.0
- Appreciation +0.0/10.0
$359,900
🖨 Deal sheet (PDF) 📄 Offer letter ✓ Due diligence
Listing remarks
D. R. Horton, America's Builder, proudly unveils the captivating Henley plan-a true masterpiece of contemporary living. This elegant two-story home offers five generously proportioned bedrooms and three luxurious full bathrooms, catering perfectly to families who desire both space and style. Upon entering the main level, you'll be welcomed by the seamless flow of solid surface flooring, designed for easy maintenance and a touch of sophistication. The family room gracefully leads to an exquisitely crafted staircase, ensuring both privacy and convenient access to the upper level. Culinary enthusiasts will be enchanted by the kitchen, featuring stunning dark cabinetry, a spacious pantry, and a
Key facts
- Spacious pantry
- Built-in island
- Dedicated study
Tags
Neighborhood map
What this means for you Summary
Snapshot
- This is a 5-bed/3.0-bath land listed at $360k.
Deal economics
- At list price, monthly cash flow is $-271 ($-3k/yr) — negative.
- To cash-flow at today's rent, offer at most $321k (10.9% below list).
- To meet the 1% rule (rent ≥ 1% of price), the offer needs to be $286k (20.5% below list).
- Recommended offer: $286k (20.5% below list) — sets the bar for 1% rule.
- Cap rate 5.4% vs local median 4.4% in Indianapolis city (balance) — meaningfully above typical; check what's discounted (condition, days-on-market, listing class) to confirm the premium yield is real.
Location & tenants
- Location reads: area grade D — affects rentability + tenant quality, not the cash-flow math above.
- Franklin Township Community School Corporation (urban): math 42% / reading 47% proficiency, ranked #87 of 301 in IN (top 29%) — families likely to look elsewhere, expect single-tenant / working-renter base with shorter leases.
- Zoned schools: South Creek Elementary (math 62% / reading 47%, grade C, #197 of 994 statewide, top 22%, 627 students, 46% FRL); Franklin Central Junior High (math 31% / reading 40%, grade F, #162 of 330 statewide, top 49%, 1,711 students, 51% FRL); Franklin Central High School (math 41% / reading 69%, grade C, #77 of 369 statewide, top 21%, 3,319 students, 46% FRL) — zoned schools average 48% FRL vs 29% district-wide (19 pts higher); higher-poverty schools than district average — tighter screening recommended.
- Market conditions: Rents rising fast (+6.1%/yr); 337 active listings in the ZIP; 2 comparable units currently listed for rent nearby; solid renter incomes; 1,906 units permitted in Marion County in 2024 (621 in 5+ unit buildings).
- This rent runs 34% of the median local income ($100k/yr) — at the standard rent-burdened threshold; future hikes will face affordability resistance.
Forward outlook
- Local home prices are declining (-3.0%/yr); year-one equity from $2k of loan paydown is wiped out by about $11k of value loss. Plan a longer hold.
- Marion County population projected at +18% by 2050 — long-run rental-demand tailwind backs the buy-and-hold thesis.
Negotiation context
- It's been on market 31 days — a 3% lower offer ($349k) is reasonable based on typical stale-listing flexibility.
Risks & watch-outs
- Climate carrying-cost: moderate flood risk — expect insurance premiums to compound above CPI over the hold.
Questions for the listing agent
- What do current leases actually rent for vs. the listed asking? Can we see a recent rent roll and the last 12 months of T-12 income?
- It's been on market 31 days. Have you received any prior offers? Is the seller open to a 20% concession, seller financing, or rate buy-down credit?
- What does the HOA fee cover, when was the last increase, and are there any pending special assessments or reserve-fund shortfalls?
- Is there a deadline driving the sale (1031 exchange, divorce, estate, relocation)? That informs how much negotiation room exists.
- The area grade is low — what's the realistic commute time and amenity access for the typical tenant pool here? Any planned neighborhood developments (good or bad) we should know about?
- What's the average days-on-market for RENTAL listings here right now (not sales)? A rising rental-DOM trend means longer vacancies and softer asking-rent achievability than the comps imply.
- What's the recent tenant-quality profile in this submarket — average credit score on applications, eviction rate, late-payment / NSF rate, and stable-employment percentage? A property-management company in the area should have these aggregated.
- How much new for-sale + rental construction is in the pipeline within 1–3 miles? Heavy new supply typically softens prices + rents 12–24 months out; constrained supply supports both.
Investment metrics
- 1% rule
- 0.80% ✗
- Cap rate
- 5.39%
- Cash-on-cash
- -3.22%
- DSCR
- 0.86
- GRM
- 10.5
CMA / ARV
No comps found within radius.
Projected returns pro-forma
-3.0% appreciation · 6.11% rent growth · sell at horizon
- IRR
- -18.2%
- Equity multiple
- 0.34×
- Total profit
- $-66,254
- Equity at exit
- $53,662
- IRR
- -5.3%
- Equity multiple
- 0.61×
- Total profit
- $-39,204
- Equity at exit
- $31,118
Cash invested: $100,772 (down + closing). Projections, not guarantees.
Landlord ↔ Tenant lean methodology
- Overall (STATE)
- 90 Strongly Landlord-Friendly
- State Indiana
- 90 Strongly Landlord-Friendly · R+11
- County
- — inherits STATE
- City
- — inherits STATE
ZIP-level market 46239
- Home prices YoY
- -29.2%
- Rents YoY
- 6.1%
- Active inventory
- 337
- Price-to-rent
- 10.5×
Monthly cashflow live
- Estimated rent
- $2,863 medium interval (Pro) →
- Mortgage (P&I)
- −$1,887
- Tax est. 1.5%
- −$450 /mo · $5,398/yr
- Insurance
- −$150
- HOA
- −$45
- Vacancy / Maint / Mgmt
- −$601
- Net cashflow
- $-271
Break-even live
Sensitivity live
| Price | -10% $-22 | -5% $-146 | +0% $-271 | +5% $-395 | +10% $-519 |
|---|---|---|---|---|---|
| Rent | -10% $-497 | -5% $-384 | +0% $-271 | +5% $-158 | +10% $-45 |
| Rate | -1.0pp $-89 | -0.5pp $-179 | base $-271 | +0.5pp $-364 | +1.0pp $-459 |
UW: 25.0% down · 7.5% · 30yr · 1.5% tax · 5.0% vac · 8.0% maint · 8.0% mgmt
Financing live
Cash to close
- Down payment
- $89,975
- Closing costs
- $10,797
- Reserves months
- —
- Total cash needed
- —
Loan-product check · same deal, 3 products live
Conventional
25% down · 7.5% · 30yr
- Down + closing
- —
- Monthly P&I
- —
- Monthly cashflow
- —
- DSCR
- —
- Eligible?
- —
Personal DTI + credit; lowest rate.
DSCR
20% down · 8.5% · 30yr
- Down + closing
- —
- Monthly P&I
- —
- Monthly cashflow
- —
- DSCR
- —
- Eligible?
- —
No personal income docs; deal must DSCR.
Hard money
10% down · 12.0% · 12mo
- Down + closing
- —
- Monthly P&I
- —
- Monthly cashflow
- —
- DSCR
- —
- Eligible?
- —
Short-term bridge; refi at stabilization.
Rent comps 2 comps
| Address | Beds | Baths | Sqft | Rent | $/sqft | DOM | Units | Dist |
|---|---|---|---|---|---|---|---|---|
| 8709 Rowling Way Indianapolis, IN | 5.0 | 3.5 | 3250 | $2,600 | $0.80 | 25d | 1 | 0.58mi |
| 4526 Wild Turkey Dr Indianapolis, IN | 4.0 | 2.5 | 1880 | $1,950 | $1.04 | 9d | 1 | 1.35mi |
HOA detail
- Monthly dues
- $45 · $540/yr
Listing history 3 events
-
2026-04-03status Pending
-
2026-03-23price $359,900
-
2026-03-03$360,200 Active
ⓘ Source: listings_history table (triggers on properties + properties_extension) + one-shot
backfill from property_details.listing_events for pre-trigger history.
Climate risk First Street
- Flood 5/10 Major FEMA zone X (unshaded) · 65% chance over 30 yrs
- Wildfire 1/10 Low
- Heat 3/10 Moderate 7 d/yr ≥101°F today · 19 d/yr by 30 yrs out
- Wind 2/10 Low 100% chance of damaging wind over 30 yrs
- Air quality 2/10 Low 1 unhealthy d/yr today · 2 by 30 yrs out
Nearby sold comps map
Loading sold comps map…
Walkable amenities ~0.75 mi
Loading nearby amenities…
Taxation est. · year 1
- Rental income
- $34,351
- − Mortgage interest
- −$20,160
- − Property taxes
- −$5,398
- − Insurance
- −$1,800
- − Repairs & maintenance
- −$2,748
- − Management
- −$2,748
- − HOA
- −$540
- − Depreciation
- −$10,470
- Taxable loss
- −$9,513
- Est. tax savings @ 24.0%
- +$2,283
- After-tax cash flow
- $-966/yr
For passive investors: Depreciation is non-cash, so a rental often shows a tax loss while cash-flowing — sheltering income. Rental losses are passive: they offset passive income freely, and up to $25,000/yr can offset ordinary (W-2) income if you actively participate and your MAGI is under $100k (phasing out to $0 by $150k); unused losses carry forward. On sale, claimed depreciation is recaptured at up to 25%, and gains may owe capital-gains tax (a 1031 exchange can defer both). Figures are a year-1 estimate at your 24.0% rate — not tax advice; consult a CPA.
Schools (NCES district)
- District
- Franklin Township Community School Corporation
- NCES district ID
- 1803750
- Math proficiency
- 42% ▼ -12.00%
- Reading proficiency
- 47% ▼ -6.00%
- Median HH income
- $67,825
- Composite
- 39.91/100
- National rank
- #3852
- State rank
- #87 of 301 in IN
Livability — Indianapolis city (balance)
No livability data for this city. (Only ~50 U.S. cities are tracked.)
Census & demographics
- Census place
- Indianapolis city (balance), IN
- County
- Marion County · 998,460 people
- City population
- 881,119
- Metro
- Indianapolis-Carmel-Anderson, IN
- Population (ZIP)
- 33,931
- Household income
- $100,331
- Rent vs Own
- Severe rent burden
- 567.0
Population outlook (Marion County) Hauer SSP2
- Today (2025)
- 1,025,572 people
- By 2030
- 1,065,727 · +3.9%
- By 2040
- 1,141,577 · +11.3%
- By 2050
- 1,208,920 · +17.9%
- By 2075
- 1,367,288 · +33.3%
- By 2100
- 1,438,201 · +40.2%
Race, ethnicity, and origin ACS 2023
- Neighborhood character
- Diverse neighborhood (Simpson 0.61)
- Race & ethnicity
- White 57% Black 24% Hispanic / Latino 9% Two or more races 9% Asian 4%
- Hispanic origin (detail)
- Mexican 6%
- Common ancestry
- Lithuanian 2% Slovak 2% Romanian 1%
- Foreign-born
- 7% · Canada, Philippines, China
- Languages at home
- 89% English-only · Spanish 6% Other Indo-European 2% Chinese 1%
Political lean MEDSL · Marion
- 2024 margin
- Strong D (+27.7) · D 63.0% · R 35.3% · Other 1.7%
- 2008→2024 swing
- -0.7pp no change · 2008: 28.4pp · 2024: 27.7pp
- All cycles
- 2024: D+27.7 2020: D+29.1 2016: D+22.8 2012: D+22.2 2008: D+28.4
Not yet ingested
- Civics
- —
Market trends
- HPI YoY
- ▼ -93.15%
- Current HPI
- 226.1965
- Rent YoY
- ▲ 6.11%
- Metro
- Indianapolis-Carmel-Anderson, IN
- State GDP YoY
- ▲ 2.90%
- F500 in state
- 18
Industry mix (Fortune 500 HQ in IN)
| Industry | F500 HQs | Revenue |
|---|---|---|
| Industrial Machinery | 2 | $37B |
|
||
| Healthcare | 1 | $177B |
|
||
| Pharmaceuticals | 1 | $45B |
|
||
| Metals / Steel | 1 | $18B |
|
||
| Agriculture | 1 | $17B |
|
||
| Packaging | 1 | $12B |
|
||
Price history
-0.1% since first listed3 events — show timeline
- 2026-04-03 Pending — MIBOR as Distributed by MLS Grid
- 2026-03-23 Price Changed $359,900 MIBOR as Distributed by MLS Grid
- 2026-03-03 Listed $360,200 MIBOR as Distributed by MLS Grid
Property tax history
-0.1%/yrLatest (2025): $8 · -0.1% YoY. Source: county tax records.
Cash-flow waterfall
monthlySold comps — $/sqft
last 12 mo · ≤1 miLoading sold comps…