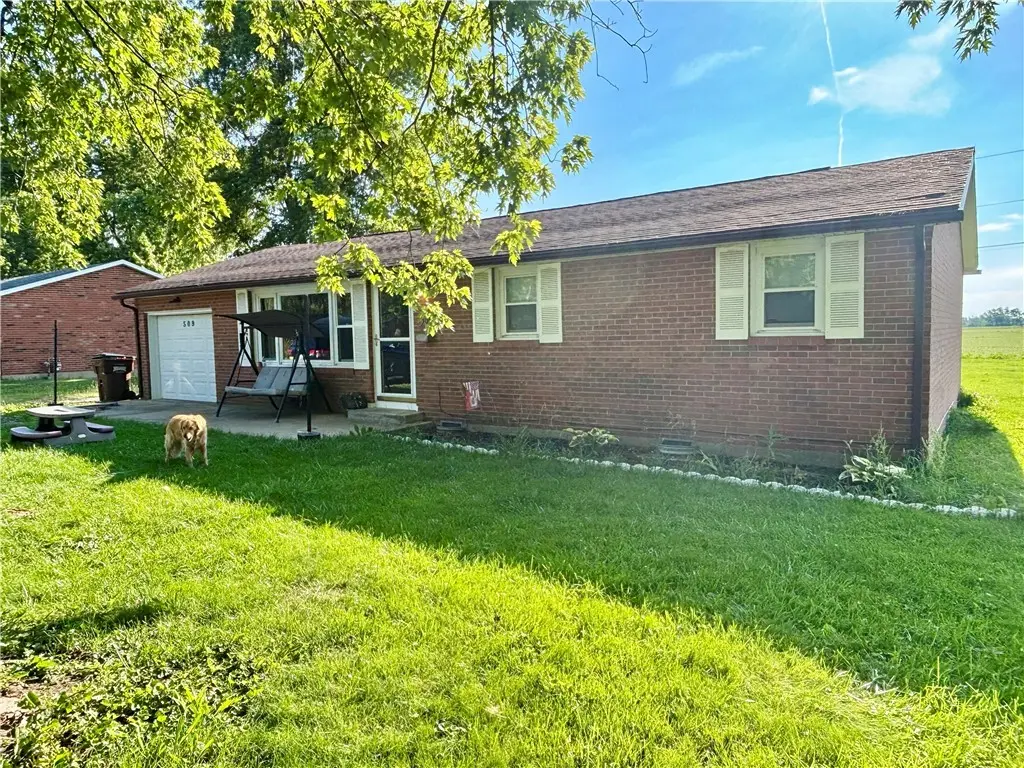
509 Winbigler St · Ansonia, OH
Flood risk 1/10 · Minimal
- FEMA flood zone
- X (unshaded)
- Chance of flooding over 30 yrs
- 0.0%
- Est. flood insurance / yr
- $507 – $1,088
Fire risk 1/10 · Minimal
- Est. fire insurance / yr
- $713 – $1,323
Heat risk 3/10 · Minor
- Hot days now (above 99°F)
- 7 days/yr
- Hot days in 30 yrs
- 18 days/yr
Wind risk 2/10 · Minimal
- Chance of severe wind over 30 yrs
- —
Air-quality risk 3/10 · Minor
- Unhealthy air days now
- 2 days/yr
- Unhealthy air days in 30 yrs
- 3 days/yr
Risk factors via First Street. Map © Google.
Why this score? — see what drove the F grade
The composite is a weighted blend of 9 inputs, each scored 0–100. Each bar is that input's sub-score; the figure is the points it added to the 100-point composite (weight × sub-score).
- Appreciation +9.1/10.0
- Cash flow +7.4/30.0
- Schools +5.8/10.0
- Livability +3.6/5.0
- Rent growth +2.5/5.0
- Condition / age +2.5/5.0
- DSCR +1.5/10.0
- 1% rule +1.4/10.0
- ARV discount +0.0/15.0
$159,900
🖨 Deal sheet 📄 Offer letter ✓ Due diligence
Listing remarks MLS
Discover the charm of tranquil living in this delightful red brick home, perfectly situated on a generous 0.24-acre lot in Ansonia. This well-maintained single-story residence offers a peaceful retreat with all the conveniences for comfortable daily life. Step inside to a welcoming living area, where durable laminate wood-look flooring sets a warm and inviting tone, beautifully illuminated by natural light and featuring a well-proportioned layout. The cheerful eat-in kitchen boasts ample cabinetry, integrated appliances including a range and refrigerator, making meal preparation a breeze. Each of the three comfortable bedrooms provides a relaxing sanctuary, complete with practical ceiling fans for year-round comfort. The functional bathroom features a vanity with a sink and a toilet, illuminated by overhead lighting. Outside, a private patio area awaits, perfect for outdoor relaxation and enjoying the verdant surroundings. The property also includes a quaint storage shed, offering additional utility amidst the rural landscape. With its harmonious blend of indoor comfort and outdoor appeal, this home provides an idyllic setting for a serene lifestyle in Ansonia.
Key facts
- Ample cabinetry
- Ceiling fans
- Eat-in kitchen
Tags
Property features AI
Finance
- Financial info: Offered for sale
Exterior
- Parking: Attached one-car garage with garage door opener
- Security: Smoke detector(s)
- Utilities: Cable available
- Home design: One-story brick home; Residential zoning
- Construction: Brick construction; Crawl space foundation
- Exterior features: Patio; Outdoor storage; Shed(s); Smoke detector(s)
Interior
- Kitchen: Eat-in kitchen (17 x 12)
- Bedrooms: Three bedrooms on the main level (10 x 10, 10 x 12, 12 x 12)
- Bathrooms: One full bathroom on the main level
- Heating & cooling: Heat pump heating; Central air conditioning
- Interior features: Ceiling fan(s); High speed internet; Remodeled
- Laundry & utility: Utility room on the main level (6 x 9); Electric water heater
Neighborhood map
What this means for you Summary
Snapshot
- This is a 3-bed/1.0-bath single-family listed at $160k.
Deal economics
- At list price, monthly cash flow is $-208 ($-2k/yr) — negative.
- To cash-flow at today's rent, offer at most $123k (22.9% below list).
- To meet the 1% rule (rent ≥ 1% of price), the offer needs to be $102k (35.9% below list).
- Recommended offer: $102k (35.9% below list) — sets the bar for 1% rule.
Location & tenants
- Location reads 71/100 on livability (#416 in OH) — a middle-class / working-renter tenant base. Strengths: schools A+, crime A+, cost of living A+; Watch: health & safety C-, employment D, amenities F.
- Ansonia Local (rural): math 69% / reading 69% proficiency, ranked #170 of 656 in OH (top 26%) — acceptable for families but not a draw, mixed tenant base, ~2y average lease.
- Market conditions: 5 active listings in the ZIP; 43 units permitted in Darke County in 2024 (0 in 5+ unit buildings).
Forward outlook
- In year one you build about $14k of equity ($1k loan paydown + $13k appreciation (8.2% local appreciation)).
- Darke County population projected at -20% by 2050 — secular population decline; favor cash flow + early exit over multi-decade hold.
- By year 3, paydown + projected appreciation supports a ~$36k cash-out refi (75% LTV) — recoverable capital for the next deal without selling this one.
Negotiation context
- Only 5 days on market — expect competitive offers; lowballing is unlikely to land.
- 5 sale attempts since 14y ago with the ask held roughly flat each time — persistent listings suggest the price (not the market) is what's stuck; bring a comps-based counter.
- Current owner paid $115k; 39% above their basis — modest negotiation headroom, anchor on the comps not their cost.
Questions for the listing agent
- What do current leases actually rent for vs. the listed asking? Can we see a recent rent roll and the last 12 months of T-12 income?
- Built in 1973 — when were the roof, HVAC, electrical panel, plumbing, and water heater last replaced?
- Is there a deadline driving the sale (1031 exchange, divorce, estate, relocation)? That informs how much negotiation room exists.
- Schools are A-rated — typically a magnet for longer-tenancy family renters. What's the average tenant stay here, and is there a school-zone premium baked into asking?
- The area grade is low — what's the realistic commute time and amenity access for the typical tenant pool here? Any planned neighborhood developments (good or bad) we should know about?
- What's the average days-on-market for RENTAL listings here right now (not sales)? A rising rental-DOM trend means longer vacancies and softer asking-rent achievability than the comps imply.
- What's the recent tenant-quality profile in this submarket — average credit score on applications, eviction rate, late-payment / NSF rate, and stable-employment percentage? A property-management company in the area should have these aggregated.
- How much new for-sale + rental construction is in the pipeline within 1–3 miles? Heavy new supply typically softens prices + rents 12–24 months out; constrained supply supports both.
Investment metrics
- 1% rule
- 0.64% ✗
- Cap rate
- 4.74%
- Cash-on-cash
- -5.56%
- DSCR
- 0.75
- GRM
- 13.0
CMA / ARV
- ARV (on-the-fly)
- $134,275
- Comps found
- 6
Show comp detail 6 sales within ~0.75 mi
| Address | Dist | Beds/Ba | Sqft | Sold | Price | $/sf | Match |
|---|---|---|---|---|---|---|---|
| 500 Smith St | 0.10mi | 3/1.0 | 1,000 (-2%) | 9mo | $127,500 | $128 | 84 |
| 623 Smith St | 0.10mi | 2/1.0 (-1) | 952 (-7%) | 3mo | $135,000 | $142 | 76 |
| 211 N Pearl St | 0.43mi | 3/1.0 | 1,008 (-2%) | 7mo | $135,000 | $134 | 71 |
| 200 E High St | 0.24mi | 2/1.0 (-1) | 936 (-9%) | 4mo | $122,500 | $131 | 66 |
| 400 E Cross | 0.45mi | 2/1.0 (-1) | 1,040 (+2%) | 7mo | $131,700 | $127 | 66 |
| 400 W High St | 0.43mi | 2/1.0 (-1) | 1,104 (+8%) | 24mo | $100,000 | $91 | 42 |
Match score weights: distance 35% · size 25% · config 20% · recency 20%. Top-matched comps best support the ARV.
Projected returns pro-forma
8.25% appreciation · 3.0% rent growth · sell at horizon
- IRR
- 16.4%
- Equity multiple
- 2.23×
- Total profit
- $55,222
- Equity at exit
- $124,256
- IRR
- 15.8%
- Equity multiple
- 4.80×
- Total profit
- $170,101
- Equity at exit
- $249,342
Cash invested: $44,772 (down + closing). Projections, not guarantees.
Landlord ↔ Tenant lean methodology
- Overall (STATE)
- 73 Landlord-Friendly
- State Ohio
- 73 Landlord-Friendly · R+6
- County
- — inherits STATE
- City
- — inherits STATE
ZIP-level market 45303
- Home prices YoY
- 3.6%
- Active inventory
- 5
- Price-to-rent
- 13.0×
Monthly cashflow live
- Estimated rent
- $1,024 medium interval (Pro) →
- Mortgage (P&I)
- −$839
- Tax from tax record
- −$112 /mo · $1,340/yr
- Insurance
- −$67
- HOA
- −$0
- Vacancy / Maint / Mgmt
- −$215
- Net cashflow
- $-208
Break-even live
UW: 25.0% down · 7.5% · 30yr · 1.5% tax · 5.0% vac · 8.0% maint · 8.0% mgmt
Financing live
Cash to close
- Down payment
- $39,975
- Closing costs
- $4,797
- Reserves months
- —
- Total cash needed
- —
Loan-product check · same deal, 3 products live
Conventional
25% down · 7.5% · 30yr
- Down + closing
- —
- Monthly P&I
- —
- Monthly cashflow
- —
- DSCR
- —
- Eligible?
- —
Personal DTI + credit; lowest rate.
DSCR
20% down · 8.5% · 30yr
- Down + closing
- —
- Monthly P&I
- —
- Monthly cashflow
- —
- DSCR
- —
- Eligible?
- —
No personal income docs; deal must DSCR.
Hard money
10% down · 12.0% · 12mo
- Down + closing
- —
- Monthly P&I
- —
- Monthly cashflow
- —
- DSCR
- —
- Eligible?
- —
Short-term bridge; refi at stabilization.
Listing history 5 events
-
2026-06-12statusdays on market $159,900 Pending 5 DOM
-
2026-06-09days on market $159,900 Active 4 DOM
-
2026-06-08days on market $159,900 Active 3 DOM
-
2026-06-07remarks 699-char remark
-
2026-06-07$159,900 Active 2 DOM
ⓘ Source: listings_history table (triggers on properties + properties_extension) + one-shot
backfill from property_details.listing_events for pre-trigger history.
Tax reassessment forecast OH · Partial reset (capped growth)
- Current annual tax
- $1,340 · $112/mo
- Projected year-2 tax
- $1,917 · $160/mo
- Expected delta
- +$577/yr (+$48/mo · 43.0%)
ⓘ Screening estimate from a state-policy table — verify with the county assessor before closing.
Climate risk First Street
- Flood 1/10 Low FEMA zone X (unshaded) · 0% chance over 30 yrs
- Wildfire 1/10 Low
- Heat 3/10 Moderate 7 d/yr ≥99°F today · 18 d/yr by 30 yrs out
- Wind 2/10 Low
- Air quality 3/10 Moderate 2 unhealthy d/yr today · 3 by 30 yrs out
Nearby sold comps map
Loading sold comps map…
Walkable amenities ~0.75 mi
Loading nearby amenities…
Taxation est. · year 1
- Rental income
- $12,294
- − Mortgage interest
- −$8,957
- − Property taxes
- −$1,340
- − Insurance
- −$800
- − Repairs & maintenance
- −$983
- − Management
- −$983
- − Depreciation
- −$4,652
- Taxable loss
- −$5,422
- Est. tax savings @ 24.0%
- +$1,301
- After-tax cash flow
- $-1,189/yr
For passive investors: Depreciation is non-cash, so a rental often shows a tax loss while cash-flowing — sheltering income. Rental losses are passive: they offset passive income freely, and up to $25,000/yr can offset ordinary (W-2) income if you actively participate and your MAGI is under $100k (phasing out to $0 by $150k); unused losses carry forward. On sale, claimed depreciation is recaptured at up to 25%, and gains may owe capital-gains tax (a 1031 exchange can defer both). Figures are a year-1 estimate at your 24.0% rate — not tax advice; consult a CPA.
Schools (NCES district)
- District
- Ansonia Local
- NCES district ID
- 3904662
- Math proficiency
- 69% ▼ -15.00%
- Reading proficiency
- 69% ▼ -8.00%
- Median HH income
- $44,736
- Composite
- 58.04/100
- National rank
- #1034
- State rank
- #170 of 656 in OH
Livability — Ansonia
- Score
- 71/100
- State rank
- #416
- US rank
- #6854
Category grades
Schools grade is shown separately in the Schools card above.
Census & demographics
- Census place
- Ansonia, OH
- County
- Darke · 50,606 people
- Population (ZIP)
- 2,169
- Household income
- $54,669
- Rent vs Own
Population outlook (Darke County) Hauer SSP2
- Today (2025)
- 49,377 people
- By 2030
- 47,494 · -3.8%
- By 2040
- 43,553 · -11.8%
- By 2050
- 39,320 · -20.4%
- By 2075
- 30,091 · -39.1%
- By 2100
- 21,110 · -57.2%
Race, ethnicity, and origin ACS 2023
- Neighborhood character
- Predominantly White (96%)
- Race & ethnicity
- White 96% Black 1% Two or more races 1% Hispanic / Latino 1%
- Common ancestry
- Slovak 1% Serbian 1% Iranian 1%
- Foreign-born
- 0%
Political lean MEDSL · Darke
- 2024 margin
- Solid R (+65.4) · D 17.0% · R 82.3%
- 2008→2024 swing
- -29.2pp toward R · 2008: -36.1pp · 2024: -65.4pp
- All cycles
- 2024: R+65.4 2020: R+63.6 2016: R+61.2 2012: R+44.9 2008: R+36.1
Not yet ingested
- Civics
- —
Market trends
- HPI YoY
- ▲ 8.25%
- Current HPI
- 236.5453
- Rent YoY
- —
- Metro
- —
- State GDP YoY
- ▲ 1.98%
- F500 in state
- 48
Industry mix (Fortune 500 HQ in OH)
| Industry | F500 HQs | Revenue |
|---|---|---|
| Insurance | 3 | $145B |
|
||
| Industrial Machinery | 3 | $49B |
|
||
| Financial Services | 3 | $24B |
|
||
| Consumer Goods | 2 | $93B |
|
||
| Aerospace / Defense | 2 | $47B |
|
||
| Utilities | 2 | $33B |
|
||
Price history
+515.0% since first listed15 events — show timeline
- 2026-06-04 Listed $159,900 WRIST
- 2026-06-04 Listed $159,900 Dayton MLS
- 2021-02-26 Sold (MLS) $115,000 Dayton MLS
- 2021-02-26 Sold (MLS) $115,000 Dayton MLS
- 2021-01-21 Listed $109,900 Dayton MLS
- 2013-08-20 Sold (Public Records) $75,000 Public Records
- 2013-02-27 Sold (MLS) $35,900 Dayton MLS
- 2013-02-27 Sold (MLS) $35,900 Dayton MLS
- 2013-02-27 Sold (MLS) $35,900 WRIST
- 2012-11-13 Listed $42,900 Dayton MLS
- 2012-11-13 Listed $42,900 WRIST
- 1994-11-23 Sold (Public Records) $45,000 Public Records
- 1992-01-07 Sold (Public Records) $38,500 Public Records
- 1987-12-01 Sold (Public Records) $34,500 Public Records
- 1987-10-27 Sold (Public Records) $26,000 Public Records
Property tax history
+3.9%/yrLatest (2025): $1,340 · -0.1% YoY. Source: county tax records.
Cash-flow waterfall
monthlySold comps — $/sqft
last 12 mo · ≤1 miLoading sold comps…