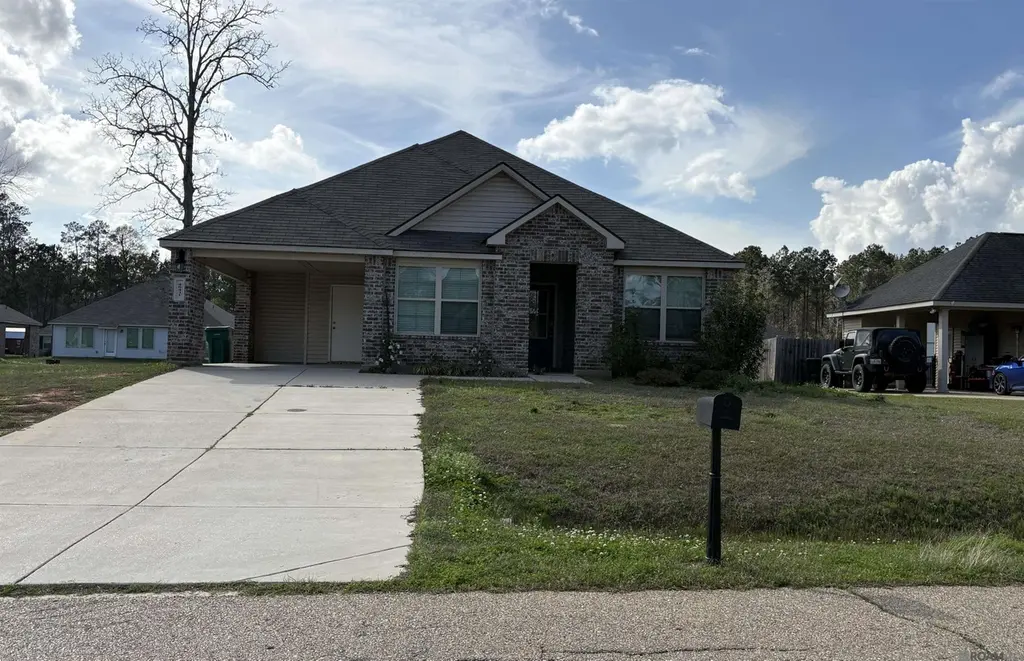
48431 Fox Hollow Blvd · Hammond, LA
Flood risk 1/10 · Minimal
- FEMA flood zone
- A
- Chance of flooding over 30 yrs
- 0.0%
- Est. flood insurance / yr
- $1,009 – $1,996
Fire risk 6/10 · Moderate
- Est. fire insurance / yr
- $1,269 – $2,357
Heat risk 9/10 · Severe
- Hot days now (above 109°F)
- 7 days/yr
- Hot days in 30 yrs
- 22 days/yr
Wind risk 9/10 · Severe
- Chance of severe wind over 30 yrs
- 99.0%
Air-quality risk 2/10 · Minimal
- Unhealthy air days now
- 0 days/yr
- Unhealthy air days in 30 yrs
- 1 days/yr
Risk factors via First Street. Map © Google.
Why this score? — see what drove the C- grade
The composite is a weighted blend of 9 inputs, each scored 0–100. Each bar is that input's sub-score; the figure is the points it added to the 100-point composite (weight × sub-score).
- Cash flow +17.0/30.0
- ARV discount +15.0/15.0
- DSCR +5.3/10.0
- 1% rule +4.1/10.0
- Livability +3.5/5.0
- Rent growth +2.5/5.0
- Condition / age +2.5/5.0
- Schools +2.0/10.0
- Appreciation +0.0/10.0
$184,900
🖨 Deal sheet 📄 Offer letter ✓ Due diligence
Listing remarks
3-bedroom, 2-bath home with approximately 1,455 living sq ft, located in an established neighborhood in Hammond. This property offers a functional layout with comfortable living space and a spacious yard. Conveniently situated near local shopping, dining, and major roadways for easy access to everyday essentials.
Key facts
- 9,583 sq ft lot
- Built 2022
- Listed 74 days
Neighborhood map
What this means for you Summary
Snapshot
- This is a 3-bed/2.0-bath single-family listed at $185k.
Deal economics
- At list price, monthly cash flow is $0 ($-2/yr) — negative.
- To cash-flow at today's rent, offer at most $185k (0.0% below list).
- To meet the 1% rule (rent ≥ 1% of price), the offer needs to be $168k (9.2% below list).
- Recommended offer: $168k (9.2% below list) — sets the bar for 1% rule.
- Cap rate 7.1% vs local median 5.0% in Hammond — top-decile yield for the area; either an underpriced asset or a hidden risk that comps aren't pricing in. Stress-test before assuming the spread holds.
Location & tenants
- Location reads 69/100 on livability (#77 in LA) — a middle-class / working-renter tenant base. Strengths: cost of living A+, health & safety A+; Watch: amenities C-, commute D+, schools D.
- Tangipahoa Parish (rural): math 18% / reading 29% proficiency, ranked #63 of 98 in LA (top 64%) — low school quality limits family demand, transient renter base, plan for 1-2y turnover; 73% free/reduced lunch — lower-income household profile, screen leases tightly.
- Market conditions: Rents flat; 220 active listings in the ZIP; 1 comparable units currently listed for rent nearby; 1,085 units permitted in Tangipahoa Parish in 2024 (378 in 5+ unit buildings).
- This rent runs 40% of the median local income ($51k/yr) — at the standard rent-burdened threshold; future hikes will face affordability resistance.
Forward outlook
- Local home prices are declining (-3.0%/yr); year-one equity from $1k of loan paydown is wiped out by about $6k of value loss. Plan a longer hold.
- Tangipahoa County population projected at +22% by 2050 — long-run rental-demand tailwind backs the buy-and-hold thesis.
Negotiation context
- It's been on market 75 days — a 6% lower offer ($174k) is reasonable based on typical stale-listing flexibility.
- 6 sale attempts since 4y ago; this cycle's ask has dropped $25k (12%) from the opening price — seller is motivated, your offer sets the floor, not the list.
Risks & watch-outs
- Watch-outs: flood insurance adds $125/mo.
- Climate carrying-cost: in FEMA flood zone A (mandatory federal flood insurance); severe wind risk, 99% chance of damaging wind over 30y; major wildfire risk; extreme-heat days projected 7→22/yr by 2055 (HVAC capex compounding) — expect insurance premiums to compound above CPI over the hold.
Questions for the listing agent
- What do current leases actually rent for vs. the listed asking? Can we see a recent rent roll and the last 12 months of T-12 income?
- It's been on market 75 days. Have you received any prior offers? Is the seller open to a 9% concession, seller financing, or rate buy-down credit?
- What's the actual annual flood-insurance premium (NFIP or private), and is the property in a SFHA with mandatory coverage?
- What does the HOA fee cover, when was the last increase, and are there any pending special assessments or reserve-fund shortfalls?
- Why hasn't it sold? Are there any deal-killer items the seller is aware of (foundation, flood, title, zoning, code violations)?
- Is there a deadline driving the sale (1031 exchange, divorce, estate, relocation)? That informs how much negotiation room exists.
- Schools are D-rated, which usually means shorter tenancies and higher turnover. Who's the typical renter profile here, and what's been the actual vacancy rate?
- Crime grade is F in this area — have there been break-ins, vandalism, or insurance claims at this property in the last 3 years? What carrier currently insures it and at what premium?
- What's the average days-on-market for RENTAL listings here right now (not sales)? A rising rental-DOM trend means longer vacancies and softer asking-rent achievability than the comps imply.
- What's the recent tenant-quality profile in this submarket — average credit score on applications, eviction rate, late-payment / NSF rate, and stable-employment percentage? A property-management company in the area should have these aggregated.
- How much new for-sale + rental construction is in the pipeline within 1–3 miles? Heavy new supply typically softens prices + rents 12–24 months out; constrained supply supports both.
Investment metrics
- 1% rule
- 0.91% ✗
- Cap rate
- 7.10%
- Cash-on-cash
- 2.90%
- DSCR
- 1.13
- GRM
- 9.2
CMA / ARV
- ARV (median comp)
- $239,284
- List price
- $184,900
- Delta
- -22.73%
- Verdict
- UNDERPRICED
- Comps
- 20 within 1.0 mi
Show comp detail 12 sales within ~0.75 mi
| Address | Dist | Beds/Ba | Sqft | Sold | Price | $/sf | Match |
|---|---|---|---|---|---|---|---|
| 18092 Fox Hollow Loop | 0.06mi | 3/2.0 | 1,535 (+3%) | 4mo | $215,000 | $140 | 90 |
| 48432 Fox Hollow Blvd | 0.03mi | 3/2.0 | 1,524 (+2%) | 12mo | $221,000 | $145 | 86 |
| 48471 Fox Hollow Blvd | 0.07mi | 3/2.0 | 1,527 (+2%) | 15mo | $220,000 | $144 | 81 |
| 18381 Fox Hollow Loop | 0.17mi | 3/2.0 | 1,522 (+2%) | 14mo | $233,000 | $153 | 78 |
| 18335 Fox Hollow Loop | 0.21mi | 3/2.0 | 1,540 (+3%) | 11mo | $208,000 | $135 | 76 |
| 48447 Fox Hollow Blvd | 0.03mi | 3/2.0 | 1,300 (-13%) | 6mo | $210,000 | $162 | 71 |
| 18289 Fox Hollow Loop | 0.22mi | 3/2.0 | 1,455 (-3%) | 18mo | $210,000 | $144 | 70 |
| 18349 Fox Hollow Loop | 0.20mi | 3/2.0 | 1,300 (-13%) | 2mo | $191,000 | $147 | 68 |
| 18259 Fox Hollow Loop | 0.20mi | 3/2.0 | 1,675 (+12%) | 4mo | $199,000 | $119 | 67 |
| 18155 Briarwood Dr | 0.34mi | 3/2.0 | 1,653 (+10%) | 1mo | $155,000 | $94 | 66 |
| 48342 Fox Hollow Blvd | 0.15mi | 3/2.0 | 1,300 (-13%) | 14mo | $218,000 | $168 | 59 |
| 18195 Fox Hollow Loop | 0.17mi | 4/2.0 (+1) | 1,711 (+14%) | 16mo | $235,000 | $137 | 50 |
Match score weights: distance 35% · size 25% · config 20% · recency 20%. Top-matched comps best support the ARV.
Projected returns pro-forma
-3.0% appreciation · 0.06% rent growth · sell at horizon
- IRR
- -19.8%
- Equity multiple
- 0.33×
- Total profit
- $-34,743
- Equity at exit
- $27,569
- IRR
- -21.0%
- Equity multiple
- 0.06×
- Total profit
- $-48,713
- Equity at exit
- $15,987
Cash invested: $51,772 (down + closing). Projections, not guarantees.
Landlord ↔ Tenant lean methodology
- Overall (STATE)
- 90 Strongly Landlord-Friendly
- State Louisiana
- 90 Strongly Landlord-Friendly · R+12
- County
- — inherits STATE
- City
- — inherits STATE
ZIP-level market 70401
- Rents YoY
- 0.1%
- Active inventory
- 220
- Price-to-rent
- 9.2×
Monthly cashflow live
- Estimated rent
- $1,679 medium interval (Pro) →
- Mortgage (P&I)
- −$970
- Tax from tax record
- −$130 /mo · $1,556/yr
- Insurance
- −$77
- Flood insurance flood zone
- −$125 /mo · $1,502/yr
- HOA
- −$25
- Vacancy / Maint / Mgmt
- −$353
- Net cashflow
- $-0
Break-even live
UW: 25.0% down · 7.5% · 30yr · 1.5% tax · 5.0% vac · 8.0% maint · 8.0% mgmt
Financing live
Cash to close
- Down payment
- $46,225
- Closing costs
- $5,547
- Reserves months
- —
- Total cash needed
- —
Loan-product check · same deal, 3 products live
Conventional
25% down · 7.5% · 30yr
- Down + closing
- —
- Monthly P&I
- —
- Monthly cashflow
- —
- DSCR
- —
- Eligible?
- —
Personal DTI + credit; lowest rate.
DSCR
20% down · 8.5% · 30yr
- Down + closing
- —
- Monthly P&I
- —
- Monthly cashflow
- —
- DSCR
- —
- Eligible?
- —
No personal income docs; deal must DSCR.
Hard money
10% down · 12.0% · 12mo
- Down + closing
- —
- Monthly P&I
- —
- Monthly cashflow
- —
- DSCR
- —
- Eligible?
- —
Short-term bridge; refi at stabilization.
Rent comps 1 comps
| Address | Beds | Baths | Sqft | Rent | $/sqft | DOM | Units | Dist |
|---|---|---|---|---|---|---|---|---|
| 18301-0 Fox Hollow Loop Hammond, LA | 4.0 | 3.0 | 1847 | $2,500 | $1.35 | 44d | 1 | 0.22mi |
HOA detail
- Monthly dues
- $25 · $300/yr
Listing history 38 events
-
2026-06-19days on market $184,900 Active 75 DOM
-
2026-06-18days on market $184,900 Active 74 DOM
-
2026-06-17days on market $184,900 Active 73 DOM
-
2026-06-16days on market $184,900 Active 72 DOM
-
2026-06-15days on market $184,900 Active 71 DOM
-
2026-06-14days on market $184,900 Active 69 DOM
-
2026-06-13days on market $184,900 Active 68 DOM
-
2026-06-10days on market $184,900 Active 66 DOM
-
2026-06-09days on market $184,900 Active 65 DOM
-
2026-06-08days on market $184,900 Active 64 DOM
-
2026-06-07pricedays on market $184,900 Active 63 DOM
-
2026-06-05days on market $199,900 Active 60 DOM
-
2026-06-03days on market $199,900 Active 59 DOM
-
2026-06-02days on market $199,900 Active 58 DOM
-
2026-06-01days on market $199,900 Active 57 DOM
-
2026-05-31days on market $199,900 Active 56 DOM
-
2026-05-30days on market $199,900 Active 55 DOM
-
2026-05-05price $199,900
-
2026-05-05price $199,900
-
2026-04-05$209,900 Active
-
2026-04-05$209,900 Active
-
2025-04-06historical $1,600
-
2025-04-03price $1,600
-
2025-03-27$1,800
-
2024-08-29soldstatus $213,000
-
2024-08-26soldstatus $213,000 Closed
-
2024-08-10status Pending
-
2024-06-26price $215,000
-
2024-06-06price $220,000
-
2024-03-13$215,000
-
2024-03-13$225,000 Active
-
2022-12-14historical
-
2022-08-29price $210,000
-
2022-08-15price $220,000
-
2022-08-01price $230,000
-
2022-07-22price $235,000
-
2022-07-13$210,000
-
2020-12-11soldstatus $1,920,346
ⓘ Source: listings_history table (triggers on properties + properties_extension) + one-shot
backfill from property_details.listing_events for pre-trigger history.
Tax reassessment forecast LA · Resets to sale price
- Current annual tax
- $1,556 · $130/mo
- Projected year-2 tax
- $1,556 · $130/mo
- Expected delta
- $0/yr ($0/mo · 0.0%)
ⓘ Screening estimate from a state-policy table — verify with the county assessor before closing.
Climate risk First Street
- Flood 1/10 Low FEMA zone A · 0% chance over 30 yrs
- Wildfire 6/10 Major
- Heat 9/10 Extreme 7 d/yr ≥109°F today · 22 d/yr by 30 yrs out
- Wind 9/10 Extreme 99% chance of damaging wind over 30 yrs
- Air quality 2/10 Low 0 unhealthy d/yr today · 1 by 30 yrs out
Nearby sold comps map
Loading sold comps map…
Walkable amenities ~0.75 mi
Loading nearby amenities…
Taxation est. · year 1
- Rental income
- $20,148
- − Mortgage interest
- −$10,357
- − Property taxes
- −$1,556
- − Insurance
- −$2,427
- − Repairs & maintenance
- −$1,612
- − Management
- −$1,612
- − HOA
- −$300
- − Depreciation
- −$5,379
- Taxable loss
- −$3,095
- Est. tax savings @ 24.0%
- +$743
- After-tax cash flow
- $741/yr
For passive investors: Depreciation is non-cash, so a rental often shows a tax loss while cash-flowing — sheltering income. Rental losses are passive: they offset passive income freely, and up to $25,000/yr can offset ordinary (W-2) income if you actively participate and your MAGI is under $100k (phasing out to $0 by $150k); unused losses carry forward. On sale, claimed depreciation is recaptured at up to 25%, and gains may owe capital-gains tax (a 1031 exchange can defer both). Figures are a year-1 estimate at your 24.0% rate — not tax advice; consult a CPA.
Schools (NCES district)
- District
- Tangipahoa Parish
- NCES district ID
- 2201680
- Math proficiency
- 18% ▼ -32.00%
- Reading proficiency
- 29% ▼ -31.00%
- Median HH income
- $41,283
- Composite
- 19.94/100
- National rank
- #8676
- State rank
- #63 of 98 in LA
Livability — Hammond
- Score
- 69/100
- State rank
- #77
- US rank
- #8868
Category grades
Schools grade is shown separately in the Schools card above.
Census & demographics
- County
- Tangipahoa Parish · 85,958 people
- City population
- 51,394
- Metro
- Hammond, LA
- Population (ZIP)
- 21,221
- Household income
- $50,653
- Rent vs Own
- Severe rent burden
- 1255.0
Population outlook (Tangipahoa County) Hauer SSP2
- Today (2025)
- 144,204 people
- By 2030
- 151,413 · +5.0%
- By 2040
- 164,374 · +14.0%
- By 2050
- 175,427 · +21.7%
- By 2075
- 195,165 · +35.3%
- By 2100
- 201,641 · +39.8%
Race, ethnicity, and origin ACS 2023
- Neighborhood character
- Diverse neighborhood (Simpson 0.57)
- Race & ethnicity
- White 54% Black 36% Two or more races 6% Hispanic / Latino 4%
- Common ancestry
- Lithuanian 6% Slovak 2% Iranian 1%
- Foreign-born
- 2% · Canada
- Languages at home
- 97% English-only · Spanish 2%
Political lean MEDSL · Tangipahoa
- 2024 margin
- Solid R (+37.4) · D 30.6% · R 68.0% · Other 1.3%
- 2008→2024 swing
- -6.5pp toward R · 2008: -30.9pp · 2024: -37.4pp
- All cycles
- 2024: R+37.4 2020: R+32.8 2016: R+32.6 2012: R+27.7 2008: R+30.9
Not yet ingested
- Civics
- —
Market trends
- HPI YoY
- ▼ -77.61%
- Current HPI
- 136.1629
- Rent YoY
- ▲ 0.06%
- Metro
- Hammond, LA
- State GDP YoY
- ▲ 3.29%
- F500 in state
- 10
Industry mix (Fortune 500 HQ in LA)
| Industry | F500 HQs | Revenue |
|---|---|---|
| Telecommunications | 2 | $23B |
|
||
| Utilities | 1 | $12B |
|
||
| Wholesale / Distribution | 1 | $5B |
|
||
| Advertising | 1 | $2B |
|
||
Price history
-89.6% since first listed21 events — show timeline
- 2026-05-05 Price Changed $199,900 AcadianaMLS
- 2026-05-05 Price Changed $199,900 GBRMLS
- 2026-04-05 Listed $209,900 GBRMLS
- 2026-04-05 Listed $209,900 AcadianaMLS
- 2025-04-06 Rental Removed $1,600 GBRMLS
- 2025-04-03 Price Changed $1,600 GBRMLS
- 2025-03-27 Listed for Rent $1,800 GBRMLS
- 2024-08-29 Sold (Public Records) $213,000 Public Records
- 2024-08-26 Sold (MLS) $213,000 GSREIN
- 2024-08-10 Pending — GSREIN
- 2024-06-26 Price Changed $215,000 GSREIN
- 2024-06-06 Price Changed $220,000 GSREIN
- 2024-03-13 Listed $225,000 GSREIN
- 2024-03-13 Listed $215,000 AcadianaMLS
- 2022-12-14 Rental Removed — GSREIN
- 2022-08-29 Price Changed $210,000 GSREIN
- 2022-08-15 Price Changed $220,000 GSREIN
- 2022-08-01 Price Changed $230,000 GSREIN
- 2022-07-22 Price Changed $235,000 GSREIN
- 2022-07-13 Listed $210,000 AcadianaMLS
- 2020-12-11 Sold (Public Records) $1,920,346 Public Records
Property tax history
+34.4%/yrLatest (2025): $1,556 · +0.5% YoY. Source: county tax records.
Cash-flow waterfall
monthlySold comps — $/sqft
last 12 mo · ≤1 miLoading sold comps…