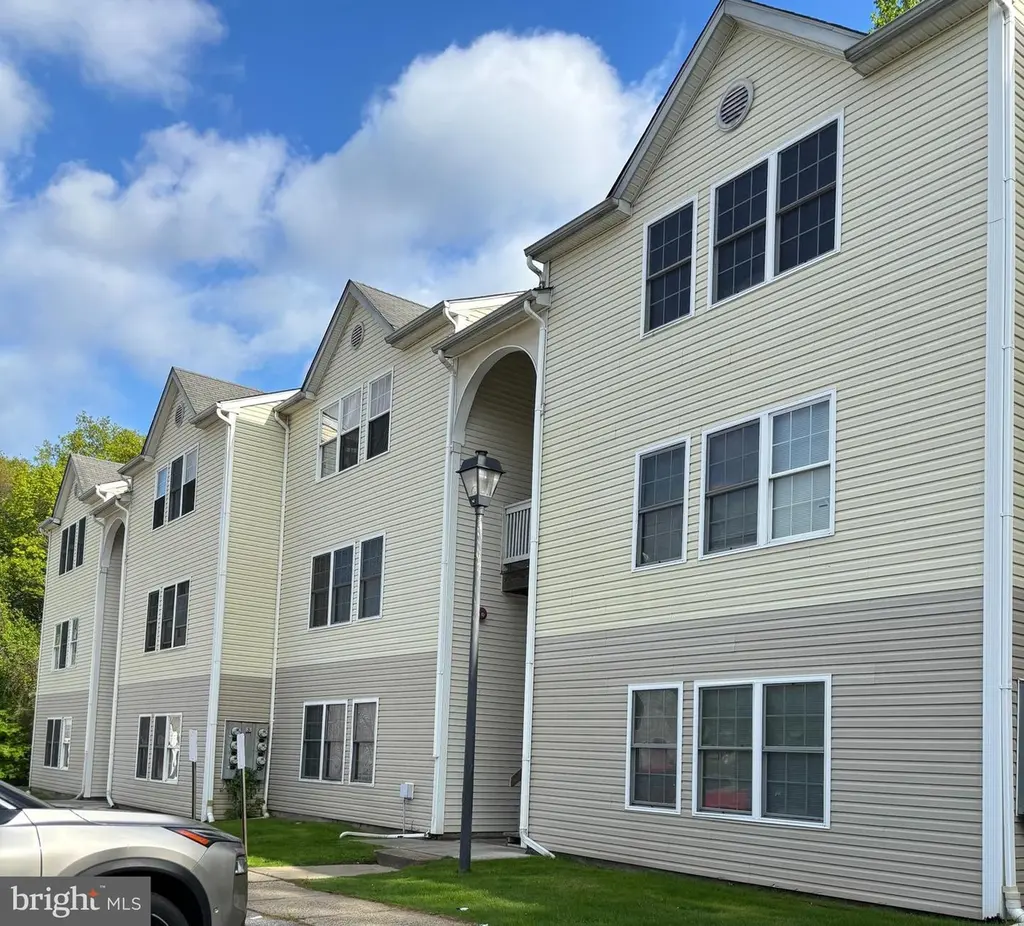
216-B Highland Blvd #76 · New Castle, DE
Flood risk 1/10 · Minimal
- FEMA flood zone
- X (unshaded)
- Chance of flooding over 30 yrs
- 0.0%
- Est. flood insurance / yr
- $473 – $860
Fire risk 1/10 · Minimal
- Est. fire insurance / yr
- $476 – $884
Heat risk 8/10 · Major
- Hot days now (above 103°F)
- 7 days/yr
- Hot days in 30 yrs
- 15 days/yr
Wind risk 6/10 · Moderate
- Chance of severe wind over 30 yrs
- 27.0%
Air-quality risk 3/10 · Minor
- Unhealthy air days now
- 3 days/yr
- Unhealthy air days in 30 yrs
- 4 days/yr
Risk factors via First Street. Map © Google.
Why this score? — see what drove the D grade
The composite is a weighted blend of 9 inputs, each scored 0–100. Each bar is that input's sub-score; the figure is the points it added to the 100-point composite (weight × sub-score).
- ARV discount +14.1/15.0
- Cash flow +10.1/30.0
- 1% rule +4.8/10.0
- Condition / age +4.0/5.0
- Livability +3.6/5.0
- DSCR +2.9/10.0
- Rent growth +2.5/5.0
- Schools +2.1/10.0
- Appreciation +0.0/10.0
$185,000
🖨 Deal sheet (PDF) 📄 Offer letter ✓ Due diligence
Listing remarks
Beautifully updated 2-bedroom, 2-bathroom condo offering a warm, inviting, and quiet living experience. This home has been freshly painted throughout and features new flooring and new doors, giving it a clean, modern feel. The fully renovated kitchen includes a stylish backsplash, self-cleaning oven, large refrigerator, and a sleek touchless faucet—perfect for both everyday living and entertaining. Both bathrooms have been updated and include new ventilation fans for added comfort. Enjoy the convenience of a brand-new washer and dryer, along with generously sized bedrooms that offer plenty of space to relax and unwind. Step outside onto your private balcony, where mature trees create
Key facts
- New ventilation fans
- New doors
- Private balcony
Tags
Property features AI
Finance
- HOA & community: Monthly HOA fee of $260; HOA covers water, lawn care (front), and snow removal; Common grounds
Exterior
- Parking: Parking lot
- Utilities: Public water; Public sewer
- Home design: Condominium ownership; End of row townhouse; Entry level: 2
- Construction: Vinyl and aluminum siding; Brick/mortar foundation; Estimated year built
- Exterior features: Above-grade and below-grade structures noted; No tidal water
Interior
- Kitchen: Built-in range; Gas oven/range
- Bedrooms: 2 bedrooms on the main level
- Bathrooms: 2 full bathrooms on the main level; 2 full bathrooms total
- Heating & cooling: Central heating (natural gas); Central air conditioning (natural gas); Natural gas hot water
- Interior features: No basement; Estimated living area
- Laundry & utility: Front-loading washer; Dryer
Neighborhood map
What this means for you Summary
Snapshot
- This is a 2-bed/2.0-bath townhouse listed at $185k. Condition is rated good.
Deal economics
- At list price, monthly cash flow is $-109 ($-1k/yr) — negative.
- To cash-flow at today's rent, offer at most $169k (8.5% below list).
- To meet the 1% rule (rent ≥ 1% of price), the offer needs to be $181k (2.2% below list).
- Recommended offer: $169k (8.5% below list) — sets the bar for cash-flow.
Location & tenants
- Location reads 72/100 on livability (#13 in DE) — a middle-class / working-renter tenant base. Strengths: employment A+, housing A+, cost of living A; Watch: crime F, commute F.
- Colonial School District (suburban): math 15% / reading 30% proficiency, ranked #23 of 26 in DE (top 88%) — low school quality limits family demand, transient renter base, plan for 1-2y turnover.
- Zoned schools: New Castle Elementary School (math 12% / reading 22%, grade F, #86 of 105 statewide, top 86%, 407 students, 0% FRL); Read (George) Middle School (math 11% / reading 32%, grade F, #27 of 36 statewide, top 77%, 694 students, 0% FRL); Penn (William) High School (math 16% / reading 30%, grade F, #29 of 40 statewide, top 72%, 2,239 students, 0% FRL) — zoned schools average 0% FRL vs 53% district-wide (53 pts lower); this property's tenant base skews higher-income than the district average.
- Market conditions: 144 active listings in the ZIP; 11 comparable units currently listed for rent nearby; rentals at typical pace (median 21d on market — plan ~3-4 weeks tenant-placement turnaround); solid renter incomes; 1,367 units permitted in New Castle County in 2024 (201 in 5+ unit buildings).
Forward outlook
- Local home prices are declining (-3.0%/yr); year-one equity from $1k of loan paydown is wiped out by about $6k of value loss. Plan a longer hold.
- New Castle County population projected at +9% by 2050 — modest demand growth; plan on rents tracking national, not racing it.
Negotiation context
- It's been on market 31 days — a 3% lower offer ($179k) is reasonable based on typical stale-listing flexibility.
- 3 sale attempts with the ask held roughly flat each time — persistent listings suggest the price (not the market) is what's stuck; bring a comps-based counter.
Risks & watch-outs
- Climate carrying-cost: major wind risk, 27% chance of damaging wind over 30y; extreme-heat days projected 7→15/yr by 2055 (HVAC capex compounding) — expect insurance premiums to compound above CPI over the hold.
Questions for the listing agent
- What do current leases actually rent for vs. the listed asking? Can we see a recent rent roll and the last 12 months of T-12 income?
- It's been on market 31 days. Have you received any prior offers? Is the seller open to a 9% concession, seller financing, or rate buy-down credit?
- What does the HOA fee cover, when was the last increase, and are there any pending special assessments or reserve-fund shortfalls?
- Is there a deadline driving the sale (1031 exchange, divorce, estate, relocation)? That informs how much negotiation room exists.
- Schools are D-rated, which usually means shorter tenancies and higher turnover. Who's the typical renter profile here, and what's been the actual vacancy rate?
- Crime grade is F in this area — have there been break-ins, vandalism, or insurance claims at this property in the last 3 years? What carrier currently insures it and at what premium?
- The area grade is low — what's the realistic commute time and amenity access for the typical tenant pool here? Any planned neighborhood developments (good or bad) we should know about?
- What's the average days-on-market for RENTAL listings here right now (not sales)? A rising rental-DOM trend means longer vacancies and softer asking-rent achievability than the comps imply.
- What's the recent tenant-quality profile in this submarket — average credit score on applications, eviction rate, late-payment / NSF rate, and stable-employment percentage? A property-management company in the area should have these aggregated.
- How much new for-sale + rental construction is in the pipeline within 1–3 miles? Heavy new supply typically softens prices + rents 12–24 months out; constrained supply supports both.
Investment metrics
- 1% rule
- 0.98% ✗
- Cap rate
- 5.58%
- Cash-on-cash
- -2.53%
- DSCR
- 0.89
- GRM
- 8.5
CMA / ARV
- ARV (median comp)
- $216,818
- List price
- $185,000
- Delta
- -14.67%
- Verdict
- UNDERPRICED
- Comps
- 20 within 1.0 mi
Show comp detail 12 sales within ~0.75 mi
| Address | Dist | Beds/Ba | Sqft | Sold | Price | $/sf | Match |
|---|---|---|---|---|---|---|---|
| 28 Lanford | 0.14mi | 3/1.5 (+1) | 1,325 (+2%) | 5mo | $286,000 | $216 | 80 |
| 17 Lanford Rd | 0.16mi | 3/1.5 (+1) | 1,375 (+6%) | 6mo | $278,000 | $202 | 71 |
| 30 Freedom Trl | 0.34mi | 3/1.5 (+1) | 1,250 (-4%) | 8mo | $260,000 | $208 | 64 |
| 1020 Old Forge Rd | 0.60mi | 2/1.5 | 1,325 (+2%) | 5mo | $245,000 | $185 | 63 |
| 427 Stonebridge Blvd | 0.27mi | 3/2.5 (+1) | 1,150 (-12%) | 1mo | $284,000 | $247 | 61 |
| 24 Ashley | 0.41mi | 3/1.5 (+1) | 1,225 (-6%) | 6mo | $270,000 | $220 | 59 |
| 10 Candlewick Ct | 0.27mi | 3/1.5 (+1) | 1,150 (-12%) | 3mo | $230,000 | $200 | 59 |
| 9 Brian Ct | 0.39mi | 3/1.5 (+1) | 1,225 (-6%) | 8mo | $269,900 | $220 | 58 |
| 1098 Old Forge Rd | 0.74mi | 2/1.5 | 1,325 (+2%) | 5mo | $233,000 | $176 | 56 |
| 2 Evlon Ct | 0.47mi | 3/2.5 (+1) | 1,400 (+8%) | 6mo | $230,000 | $164 | 53 |
| 318 Stonebridge Blvd | 0.31mi | 3/2.5 (+1) | 1,150 (-12%) | 8mo | $270,000 | $235 | 52 |
| 1022 Old Forge Rd | 0.60mi | 3/2.5 (+1) | 1,400 (+8%) | 4mo | $270,500 | $193 | 48 |
Match score weights: distance 35% · size 25% · config 20% · recency 20%. Top-matched comps best support the ARV.
Projected returns pro-forma
-3.0% appreciation · 3.0% rent growth · sell at horizon
- IRR
- -20.4%
- Equity multiple
- 0.29×
- Total profit
- $-36,748
- Equity at exit
- $27,584
- IRR
- -13.2%
- Equity multiple
- 0.22×
- Total profit
- $-40,199
- Equity at exit
- $15,995
Cash invested: $51,800 (down + closing). Projections, not guarantees.
Landlord ↔ Tenant lean methodology
- Overall (STATE)
- 70 Landlord-Friendly
- State Delaware
- 70 Landlord-Friendly · D+7
- County
- — inherits STATE
- City
- — inherits STATE
ZIP-level market 19720
- Active inventory
- 144
- Price-to-rent
- 8.5×
Monthly cashflow live
- Estimated rent
- $1,809 high interval (Pro) →
- Mortgage (P&I)
- −$970
- Tax est. 1.5%
- −$231 /mo · $2,775/yr
- Insurance
- −$77
- HOA
- −$260
- Lot rent
- −$0
- Vacancy / Maint / Mgmt
- −$380
- Net cashflow
- $-109
Break-even live
Sensitivity live
| Price | -10% $19 | -5% $-45 | +0% $-109 | +5% $-173 | +10% $-237 |
|---|---|---|---|---|---|
| Rent | -10% $-252 | -5% $-181 | +0% $-109 | +5% $-38 | +10% $34 |
| Rate | -1.0pp $-16 | -0.5pp $-62 | base $-109 | +0.5pp $-157 | +1.0pp $-206 |
UW: 25.0% down · 7.5% · 30yr · 1.5% tax · 5.0% vac · 8.0% maint · 8.0% mgmt
Financing live
Cash to close
- Down payment
- $46,250
- Closing costs
- $5,550
- Reserves months
- —
- Total cash needed
- —
Loan-product check · same deal, 3 products live
Conventional
25% down · 7.5% · 30yr
- Down + closing
- —
- Monthly P&I
- —
- Monthly cashflow
- —
- DSCR
- —
- Eligible?
- —
Personal DTI + credit; lowest rate.
DSCR
20% down · 8.5% · 30yr
- Down + closing
- —
- Monthly P&I
- —
- Monthly cashflow
- —
- DSCR
- —
- Eligible?
- —
No personal income docs; deal must DSCR.
Hard money
10% down · 12.0% · 12mo
- Down + closing
- —
- Monthly P&I
- —
- Monthly cashflow
- —
- DSCR
- —
- Eligible?
- —
Short-term bridge; refi at stabilization.
Rent comps 11 comps
| Address | Beds | Baths | Sqft | Rent | $/sqft | DOM | Units | Dist |
|---|---|---|---|---|---|---|---|---|
| 9 Clinton Ct New Castle, DE | 2.0 | 1.0 | 950 | $1,750 | $1.84 | 21d | 1 | 0.10mi |
| 401 Bedford Ln New Castle, DE | 1.0–2.0 | 1.0–2.0 | 865 | $1,895 | $2.19 | 5d | 9 | 0.14mi |
| 7 Laird Ln New Castle, DE | 2.0 | 1.5 | 1600 | $1,800 | $1.12 | 46d | 1 | 0.19mi |
| 102 Stone Hurst Ct New Castle, DE | 2.0 | 2.0 | 1043 | $1,800 | $1.73 | 26d | 1 | 0.25mi |
| 101 Paisley Ln New Castle, DE | 1.0–2.0 | 1.0–1.5 | 1150 | $1,795 | $1.56 | 20d | 1 | 0.26mi |
| 22 Candlewick Ct New Castle, DE | 3.0 | 1.5 | 1200 | $1,850 | $1.54 | 26d | 1 | 0.28mi |
| 125 Stonebridge Blvd New Castle, DE | 3.0 | 2.5 | 1700 | $2,250 | $1.32 | 46d | 1 | 0.34mi |
| 243 Stonebridge Blvd New Castle, DE | 3.0 | 2.5 | 1650 | $2,100 | $1.27 | 21d | 1 | 0.36mi |
| 2801 Stonebridge Blvd New Castle, DE | 1.0–2.0 | 1.0–2.0 | 843 | $1,717 | $2.04 | 0d | 10 | 0.39mi |
| 16 Elks Trl New Castle, DE | 1.0 | 1.5 | 1800 | $1,500 | $0.83 | 15d | 1 | 0.44mi |
| 9 Richeson Dr New Castle, DE | 2.0 | 2.5 | 1250 | $1,900 | $1.52 | 46d | 1 | 0.48mi |
HOA detail
- Monthly dues
- $260 · $3,120/yr
Listing history 13 events
-
2026-06-13days on market $185,000 Active 31 DOM
-
2026-06-09days on market $185,000 Active 27 DOM
-
2026-06-08days on market $185,000 Active 26 DOM
-
2026-06-07days on market $185,000 Active 25 DOM
-
2026-06-04days on market $185,000 Active 22 DOM
-
2026-06-03days on market $185,000 Active 21 DOM
-
2026-06-02days on market $185,000 Active 20 DOM
-
2026-06-01days on market $185,000 Active 19 DOM
-
2026-05-31days on market $185,000 Active 18 DOM
-
2026-05-13$190,000 Active 891-char remark
-
2026-05-11historical
-
2026-04-28$1,580
-
2026-04-27$190,000 Active
ⓘ Source: listings_history table (triggers on properties + properties_extension) + one-shot
backfill from property_details.listing_events for pre-trigger history.
Climate risk First Street
- Flood 1/10 Low FEMA zone X (unshaded) · 0% chance over 30 yrs
- Wildfire 1/10 Low
- Heat 8/10 Severe 7 d/yr ≥103°F today · 15 d/yr by 30 yrs out
- Wind 6/10 Major 27% chance of damaging wind over 30 yrs
- Air quality 3/10 Moderate 3 unhealthy d/yr today · 4 by 30 yrs out
Nearby sold comps map
Loading sold comps map…
Walkable amenities ~0.75 mi
Loading nearby amenities…
Taxation est. · year 1
- Rental income
- $21,710
- − Mortgage interest
- −$10,363
- − Property taxes
- −$2,775
- − Insurance
- −$925
- − Repairs & maintenance
- −$1,737
- − Management
- −$1,737
- − HOA
- −$3,120
- − Depreciation
- −$5,382
- Taxable loss
- −$4,328
- Est. tax savings @ 24.0%
- +$1,039
- After-tax cash flow
- $-272/yr
For passive investors: Depreciation is non-cash, so a rental often shows a tax loss while cash-flowing — sheltering income. Rental losses are passive: they offset passive income freely, and up to $25,000/yr can offset ordinary (W-2) income if you actively participate and your MAGI is under $100k (phasing out to $0 by $150k); unused losses carry forward. On sale, claimed depreciation is recaptured at up to 25%, and gains may owe capital-gains tax (a 1031 exchange can defer both). Figures are a year-1 estimate at your 24.0% rate — not tax advice; consult a CPA.
Condition & rehab AI · 12 photos
This well-maintained and recently updated condo offers a clean, modern feel with fresh paint, new flooring, and updated appliances. It is ready for move-in and would benefit from minor exterior and interior enhancements to further increase its value.
Value-add opportunities
- Both Painting exterior and interior walls — Enhances curb appeal and interior aesthetics.
- Both Landscaping improvements — Enhances curb appeal and adds value.
- Both New window treatments — Improves energy efficiency and aesthetics.
- Both New flooring in bathrooms — Enhances functionality and aesthetics.
Renovation cost estimate screening
Value-add ROI direction
- Both Painting exterior and interior walls — Enhances curb appeal and interior aesthetics. ↑
- Both Landscaping improvements — Enhances curb appeal and adds value. ↑
- Both New window treatments — Improves energy efficiency and aesthetics. ↑
- Both New flooring in bathrooms — Enhances functionality and aesthetics. ↑
ⓘ Cost ranges are severity-bucket heuristics (US national rule-of-thumb). Get contractor quotes + a written scope before underwriting a rehab budget.
Schools (NCES district)
- District
- Colonial School District
- NCES district ID
- 1000230
- Math proficiency
- 15% ▼ -10.00%
- Reading proficiency
- 30% ▼ -9.00%
- Median HH income
- $58,622
- Composite
- 20.75/100
- National rank
- #8517
- State rank
- #23 of 26 in DE
Livability — New Castle
- Score
- 72/100
- State rank
- #13
- US rank
- #5905
Category grades
Schools grade is shown separately in the Schools card above.
Census & demographics
- County
- New Castle County · 483,412 people
- City population
- 62,392
- Metro
- Philadelphia-Camden-Wilmington, PA-NJ-DE-MD
- Population (ZIP)
- 62,392
- Household income
- $75,403
- Rent vs Own
- Severe rent burden
- 1852.0
Population outlook (New Castle County) Hauer SSP2
- Today (2025)
- 594,686 people
- By 2030
- 609,164 · +2.4%
- By 2040
- 632,154 · +6.3%
- By 2050
- 649,068 · +9.1%
- By 2075
- 687,771 · +15.7%
- By 2100
- 694,961 · +16.9%
Race, ethnicity, and origin ACS 2023
- Neighborhood character
- Diverse neighborhood (Simpson 0.67)
- Race & ethnicity
- Black 42% White 35% Hispanic / Latino 17% Two or more races 7% Asian 2%
- Hispanic origin (detail)
- Mexican 9% Puerto Rican 6% Dominican 2%
- Common ancestry
- Romanian 4% Lithuanian 1% Swedish 1%
- Foreign-born
- 12% · Canada
- Languages at home
- 82% English-only · Spanish 13% French/Haitian/Cajun 1% Other Indo-European 1%
Political lean MEDSL · New Castle
- 2024 margin
- Solid D (+32.6) · D 65.5% · R 32.9% · Other 1.6%
- 2008→2024 swing
- -8.1pp toward R · 2008: 40.6pp · 2024: 32.6pp
- All cycles
- 2024: D+32.6 2020: D+37.1 2016: D+29.6 2012: D+34.1 2008: D+40.6
Not yet ingested
- Civics
- —
Market trends
- HPI YoY
- ▼ -261.00%
- Current HPI
- 255.0404
- Rent YoY
- —
- Metro
- Philadelphia-Camden-Wilmington, PA-NJ-DE-MD
- State GDP YoY
- —
- F500 in state
- 0
Price history
-99.2% since first listed8 events — show timeline
- 2026-06-15 Rental Removed $1,560 BRIGHTMLS
- 2026-06-14 Listing Removed — BRIGHT MLS
- 2026-05-30 Price Changed $1,560 BRIGHTMLS
- 2026-05-29 Price Changed $185,000 BRIGHT MLS
- 2026-05-13 Listed $190,000 BRIGHT MLS
- 2026-05-11 Listing Removed — BRIGHT MLS
- 2026-04-28 Listed for Rent $1,580 BRIGHTMLS
- 2026-04-27 Listed $190,000 BRIGHT MLS
Cash-flow waterfall
monthlySold comps — $/sqft
last 12 mo · ≤1 miLoading sold comps…