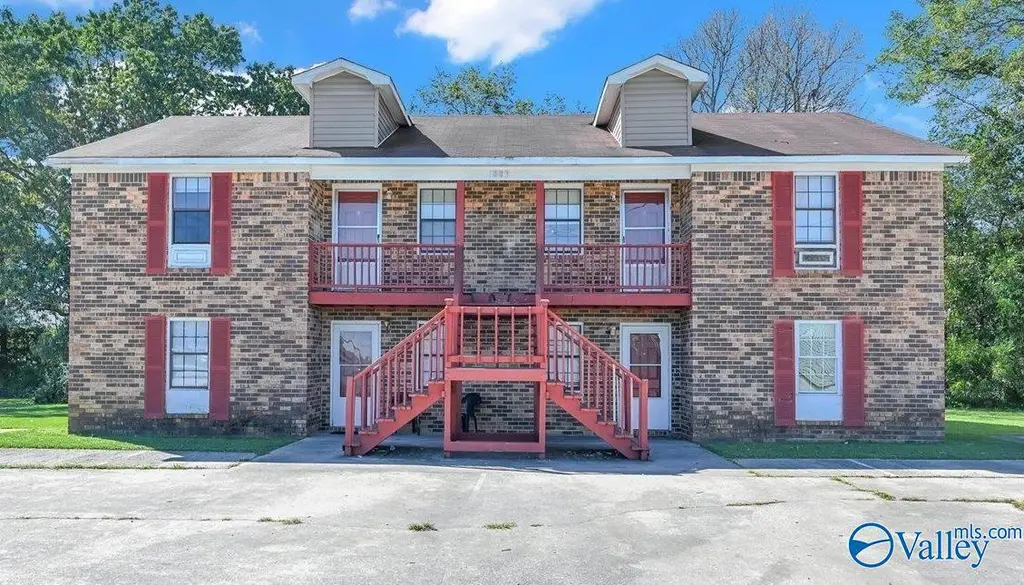
 Fourplex
1809 Graymont Ln · Decatur, AL
Flood risk 1/10 · Minimal
- FEMA flood zone
- X (unshaded)
- Chance of flooding over 30 yrs
- 0.0%
- Est. flood insurance / yr
- $507 – $1,088
Fire risk 4/10 · Minor
- Est. fire insurance / yr
- $916 – $1,700
Heat risk 6/10 · Moderate
- Hot days now (above 107°F)
- 7 days/yr
- Hot days in 30 yrs
- 19 days/yr
Wind risk 4/10 · Minor
- Chance of severe wind over 30 yrs
- 21.0%
Air-quality risk 2/10 · Minimal
- Unhealthy air days now
- 1 days/yr
- Unhealthy air days in 30 yrs
- 1 days/yr
Risk factors via First Street. Map © Google.
Why this score? — see what drove the D+ grade
The composite is a weighted blend of 9 inputs, each scored 0–100. Each bar is that input's sub-score; the figure is the points it added to the 100-point composite (weight × sub-score).
- Cash flow +20.7/30.0
- DSCR +6.6/10.0
- 1% rule +4.4/10.0
- Livability +3.6/5.0
- ARV discount +2.7/15.0
- Schools +2.6/10.0
- Rent growth +2.5/5.0
- Condition / age +2.5/5.0
- Appreciation +0.0/10.0
$409,000
🖨 Deal sheet (PDF) 📄 Offer letter ✓ Due diligence
Multi-family units
County records classify this as Multi-Family (5+ Unit). Listing-text estimate: 4 units. estimate disagrees with records
5+ unit building — per-unit beds/baths from public records are typically unavailable; the breakdown below (if shown) is an estimate from the listing text.
Listing remarks MLS
***PRICE ADJUSTMENT*** ***Investor alert*** Income-producing fourplex in a convenient Decatur SW location, offering four identical 2-bedroom, 1-bath units with solid occupancy and investor-friendly fundamentals. Each unit features an efficient layout that appeals to long-term renters. Great Opportunity. Located in the Glenmier area of Decatur with quick access to shopping and dining.
Key facts
- Efficient layout
- 0.29 acre lot
- 8 parking spots
Tags
Neighborhood map
What this means for you Summary
Snapshot
- This is a 4 × 2-bed/1-bath units multifamily listed at $409k.
Deal economics
- At list price, monthly cash flow is $556 ($7k/yr) — positive. Per door: $139/mo.
- The deal already cash-flows at list — no discount required.
- To meet the 1% rule (rent ≥ 1% of price), the offer needs to be $386k (5.5% below list).
- Recommended offer: $360k (12.0% below list) — sets the bar for market timing.
- Cap rate 7.9% vs local median 4.0% in Decatur — top-decile yield for the area; either an underpriced asset or a hidden risk that comps aren't pricing in. Stress-test before assuming the spread holds.
Location & tenants
- Location reads 72/100 on livability (#28 in AL) — a middle-class / working-renter tenant base. Strengths: cost of living A+, housing A+, health & safety A+; Watch: employment D+, crime F, amenities F.
- Decatur City (urban): math 22% / reading 40% proficiency, ranked #66 of 129 in AL (top 51%) — families likely to look elsewhere, expect single-tenant / working-renter base with shorter leases.
- Zoned schools: Austinville Elementary School (math 12% / reading 27%, grade F, #467 of 627 statewide, top 76%, 416 students, 88% FRL); Austin Middle School (math 18% / reading 39%, grade F, #138 of 257 statewide, top 54%, 714 students, 77% FRL); Austin High School (math 20% / reading 24%, grade F, #142 of 305 statewide, top 51%, 1,025 students, 66% FRL) — zoned schools average 77% FRL vs 57% district-wide (20 pts higher); higher-poverty schools than district average — tighter screening recommended.
- Market conditions: 404 active listings in the ZIP; 7 comparable units currently listed for rent nearby; rentals lingering (median 46d on market — plan ~5-8 weeks vacancy on turnover, expect pricing pressure); 71% of comp listings sitting > 30 days — soft ceiling on asking rent; solid renter incomes; 231 units permitted in Morgan County in 2024 (0 in 5+ unit buildings).
- At $3,865/mo this rent would consume 57% of the median local household income ($81k/yr) (locally 467% of renters already pay >50% of income on rent) — very limited rent-growth headroom before tenants either downsize or default.
Forward outlook
- Local home prices are declining (-3.0%/yr); year-one equity from $3k of loan paydown is wiped out by about $12k of value loss. Plan a longer hold.
- Morgan County population projected at -11% by 2050 — secular population decline; favor cash flow + early exit over multi-decade hold.
Negotiation context
- It's been on market 182 days — a 12% lower offer ($360k) is reasonable based on typical stale-listing flexibility.
- 4 sale attempts since 3y ago with the ask held roughly flat each time — persistent listings suggest the price (not the market) is what's stuck; bring a comps-based counter.
Risks & watch-outs
- Climate carrying-cost: extreme-heat days projected 7→19/yr by 2055 (HVAC capex compounding) — expect insurance premiums to compound above CPI over the hold.
Questions for the listing agent
- It's been on market 182 days. Have you received any prior offers? Is the seller open to a 12% concession, seller financing, or rate buy-down credit?
- Can we see the unit-by-unit rent roll, current vacancy, and any below-market leases? What's the average tenancy length?
- What capital expenditures (roof, boiler, parking lot, exteriors) have been made in the last 5 years, and what's planned in the next 2?
- Why hasn't it sold? Are there any deal-killer items the seller is aware of (foundation, flood, title, zoning, code violations)?
- Is there a deadline driving the sale (1031 exchange, divorce, estate, relocation)? That informs how much negotiation room exists.
- Crime grade is F in this area — have there been break-ins, vandalism, or insurance claims at this property in the last 3 years? What carrier currently insures it and at what premium?
- The area grade is low — what's the realistic commute time and amenity access for the typical tenant pool here? Any planned neighborhood developments (good or bad) we should know about?
- What's the average days-on-market for RENTAL listings here right now (not sales)? A rising rental-DOM trend means longer vacancies and softer asking-rent achievability than the comps imply.
- What's the recent tenant-quality profile in this submarket — average credit score on applications, eviction rate, late-payment / NSF rate, and stable-employment percentage? A property-management company in the area should have these aggregated.
- How much new apartment / multifamily construction is in the pipeline within 1–3 miles? Heavy new supply (>2% of stock underway) typically softens rents 12–24 months out; light construction supports rent growth.
Investment metrics
- 1% rule
- 0.94% ✗
- Cap rate
- 7.93%
- Cash-on-cash
- 5.83%
- DSCR
- 1.26
- GRM
- 8.8
CMA / ARV
- ARV (median comp)
- $369,562
- List price
- $409,000
- Delta
- 10.67%
- Verdict
- OVERPRICED
- Comps
- 10 within 1.0 mi
Projected returns pro-forma
-3.0% appreciation · 3.0% rent growth · sell at horizon
- IRR
- -7.3%
- Equity multiple
- 0.73×
- Total profit
- $-30,980
- Equity at exit
- $60,983
- IRR
- 2.2%
- Equity multiple
- 1.16×
- Total profit
- $18,072
- Equity at exit
- $35,363
Cash invested: $114,520 (down + closing). Projections, not guarantees.
Landlord ↔ Tenant lean methodology
- Overall (STATE)
- 90 Strongly Landlord-Friendly
- State Alabama
- 90 Strongly Landlord-Friendly · R+15
- County
- — inherits STATE
- City
- — inherits STATE
ZIP-level market 35603
- Active inventory
- 404
- Price-to-rent
- 35.3×
Monthly cashflow live
- Estimated rent
- $3,865 medium interval (Pro) →
- Mortgage (P&I)
- −$2,145
- Tax from tax record
- −$182 /mo · $2,180/yr
- Insurance
- −$170
- HOA
- −$0
- Vacancy / Maint / Mgmt
- −$812
- Net cashflow
- $556
Break-even live
Sensitivity live
| Price | -10% $788 | -5% $672 | +0% $556 | +5% $441 | +10% $325 |
|---|---|---|---|---|---|
| Rent | -10% $251 | -5% $404 | +0% $556 | +5% $709 | +10% $862 |
| Rate | -1.0pp $762 | -0.5pp $660 | base $556 | +0.5pp $450 | +1.0pp $343 |
4-unit breakdown (identical units grouped — click to expand)
| Units | Beds | Baths | Est. rent |
|---|---|---|---|
| 4× units | 2 | 1 | $3,864 |
| #1 | 2 | 1 | $966 |
| #2 | 2 | 1 | $966 |
| #3 | 2 | 1 | $966 |
| #4 | 2 | 1 | $966 |
| Total (4 units) | $3,865 | ||
UW: 25.0% down · 7.5% · 30yr · 1.5% tax · 5.0% vac · 8.0% maint · 8.0% mgmt
Financing live
Cash to close
- Down payment
- $102,250
- Closing costs
- $12,270
- Reserves months
- —
- Total cash needed
- —
Loan-product check · same deal, 3 products live
Conventional
25% down · 7.5% · 30yr
- Down + closing
- —
- Monthly P&I
- —
- Monthly cashflow
- —
- DSCR
- —
- Eligible?
- —
Personal DTI + credit; lowest rate.
DSCR
20% down · 8.5% · 30yr
- Down + closing
- —
- Monthly P&I
- —
- Monthly cashflow
- —
- DSCR
- —
- Eligible?
- —
No personal income docs; deal must DSCR.
Hard money
10% down · 12.0% · 12mo
- Down + closing
- —
- Monthly P&I
- —
- Monthly cashflow
- —
- DSCR
- —
- Eligible?
- —
Short-term bridge; refi at stabilization.
Rent comps 7 comps
| Address | Beds | Baths | Sqft | Rent | $/sqft | DOM | Units | Dist |
|---|---|---|---|---|---|---|---|---|
| 2025 Danville Park Dr SW Decatur, AL | 1.0–2.0 | 1.0–2.0 | 938 | $1,325 | $1.41 | 25d | 8 | 0.23mi |
| 1242 Beltline Rd SW Decatur, AL | 1.0–3.0 | 1.0–2.0 | 1118 | $922 | $0.83 | 45d | 5 | 0.48mi |
| 2151 Westmead Dr SW Unit na Decatur, AL | 2.0 | 1.5 | 1300 | $1,445 | $1.11 | 46d | 1 | 1.00mi |
| 2151 Westmead Dr SW Decatur, AL | 2.0 | 2.5 | 1300 | $1,445 | $1.11 | 45d | 1 | 1.00mi |
| 1518 15th Ave SW Decatur, AL | 3.0 | 2.0 | 1440 | $1,600 | $1.11 | 45d | 1 | 1.27mi |
| 1805 8th Ave SW Decatur, AL | 3.0 | 2.0 | 1725 | $1,750 | $1.01 | 45d | 1 | 1.30mi |
| 1812 Kathy Lane Ct SW Decatur, AL | 3.0 | 2.0 | 1366 | $1,700 | $1.24 | 25d | 1 | 1.45mi |
Listing history 32 events
-
2026-06-22days on market $409,000 Active 182 DOM
-
2026-06-21days on market $409,000 Active 181 DOM
-
2026-06-19days on market $409,000 Active 179 DOM
-
2026-06-18days on market $409,000 Active 178 DOM
-
2026-06-17days on market $409,000 Active 177 DOM
-
2026-06-16days on market $409,000 Active 176 DOM
-
2026-06-15days on market $409,000 Active 175 DOM
-
2026-06-14days on market $409,000 Active 173 DOM
-
2026-06-13days on market $409,000 Active 172 DOM
-
2026-06-10days on market $409,000 Active 170 DOM
-
2026-06-09days on market $409,000 Active 169 DOM
-
2026-06-08days on market $409,000 Active 168 DOM
-
2026-06-07days on market $409,000 Active 167 DOM
-
2026-06-05days on market $409,000 Active 164 DOM
-
2026-06-03days on market $409,000 Active 163 DOM
-
2026-06-02days on market $409,000 Active 162 DOM
-
2026-06-01days on market $409,000 Active 161 DOM
-
2026-05-31days on market $409,000 Active 160 DOM
-
2026-05-30days on market $409,000 Active 159 DOM
-
2026-03-08price $409,000 387-char remark
Show marketing remark (387 chars)
***PRICE ADJUSTMENT*** ***Investor alert*** Income-producing fourplex in a convenient Decatur SW location, offering four identical 2-bedroom, 1-bath units with solid occupancy and investor-friendly fundamentals. Each unit features an efficient layout that appeals to long-term renters. Great Opportunity. Located in the Glenmier area of Decatur with quick access to shopping and dining.
-
2025-12-22$415,000 Active 387-char remark
Show marketing remark (387 chars)
***PRICE ADJUSTMENT*** ***Investor alert*** Income-producing fourplex in a convenient Decatur SW location, offering four identical 2-bedroom, 1-bath units with solid occupancy and investor-friendly fundamentals. Each unit features an efficient layout that appeals to long-term renters. Great Opportunity. Located in the Glenmier area of Decatur with quick access to shopping and dining.
-
2024-12-23soldstatus $370,000
-
2024-12-20soldstatus $370,000 Sold 192-char remark
Show marketing remark (192 chars)
Recently updated fourplex available with 2 units occupied. Do NOT disturb the tenants. All units are 2 bedroom and 1 bath. Fresh paint and new flooring in each unit. Tenants pay all utilities.
-
2024-11-18status Pending 192-char remark
Show marketing remark (192 chars)
Recently updated fourplex available with 2 units occupied. Do NOT disturb the tenants. All units are 2 bedroom and 1 bath. Fresh paint and new flooring in each unit. Tenants pay all utilities.
-
2024-10-04$399,000 Active 192-char remark
Show marketing remark (192 chars)
Recently updated fourplex available with 2 units occupied. Do NOT disturb the tenants. All units are 2 bedroom and 1 bath. Fresh paint and new flooring in each unit. Tenants pay all utilities.
-
2024-03-14historical $820
-
2024-01-31$820
-
2024-01-26historical $820
-
2023-10-27$820
-
2019-07-01soldstatus $145,000
-
2006-01-24soldstatus $139,000
-
2002-09-30soldstatus $100,000
ⓘ Source: listings_history table (triggers on properties + properties_extension) + one-shot
backfill from property_details.listing_events for pre-trigger history.
Tax reassessment forecast AL · Resets to sale price
- Current annual tax
- $2,180 · $182/mo
- Projected year-2 tax
- $2,180 · $182/mo
- Expected delta
- $0/yr ($0/mo · 0.0%)
ⓘ Screening estimate from a state-policy table — verify with the county assessor before closing.
Climate risk First Street
- Flood 1/10 Low FEMA zone X (unshaded) · 0% chance over 30 yrs
- Wildfire 4/10 Moderate
- Heat 6/10 Major 7 d/yr ≥107°F today · 19 d/yr by 30 yrs out
- Wind 4/10 Moderate 21% chance of damaging wind over 30 yrs
- Air quality 2/10 Low 1 unhealthy d/yr today · 1 by 30 yrs out
Nearby sold comps map
Loading sold comps map…
Walkable amenities ~0.75 mi
Loading nearby amenities…
Taxation est. · year 1
- Rental income
- $46,380
- − Mortgage interest
- −$22,910
- − Property taxes
- −$2,180
- − Insurance
- −$2,045
- − Repairs & maintenance
- −$3,710
- − Management
- −$3,710
- − Depreciation
- −$11,898
- Taxable loss
- −$74
- Est. tax savings @ 24.0%
- +$18
- After-tax cash flow
- $6,695/yr
For passive investors: Depreciation is non-cash, so a rental often shows a tax loss while cash-flowing — sheltering income. Rental losses are passive: they offset passive income freely, and up to $25,000/yr can offset ordinary (W-2) income if you actively participate and your MAGI is under $100k (phasing out to $0 by $150k); unused losses carry forward. On sale, claimed depreciation is recaptured at up to 25%, and gains may owe capital-gains tax (a 1031 exchange can defer both). Figures are a year-1 estimate at your 24.0% rate — not tax advice; consult a CPA.
Schools (NCES district)
- District
- Decatur City
- NCES district ID
- 0101170
- Math proficiency
- 22% ▼ -27.00%
- Reading proficiency
- 40% ▼ -1.00%
- Median HH income
- $42,170
- Composite
- 26.21/100
- National rank
- #7261
- State rank
- #66 of 129 in AL
Livability — Decatur
- Score
- 72/100
- State rank
- #28
- US rank
- #5989
Category grades
Schools grade is shown separately in the Schools card above.
Census & demographics
- Census place
- Decatur, AL
- County
- Morgan County · 67,628 people
- City population
- 67,628
- Metro
- Decatur, AL
- Population (ZIP)
- 32,179
- Household income
- $81,490
- Rent vs Own
- Severe rent burden
- 467.0
Population outlook (Morgan County) Hauer SSP2
- Today (2025)
- 118,775 people
- By 2030
- 116,979 · -1.5%
- By 2040
- 111,800 · -5.9%
- By 2050
- 105,181 · -11.4%
- By 2075
- 87,736 · -26.1%
- By 2100
- 67,624 · -43.1%
Race, ethnicity, and origin ACS 2023
- Neighborhood character
- Predominantly White (74%)
- Race & ethnicity
- White 74% Black 15% Hispanic / Latino 6% Two or more races 5%
- Hispanic origin (detail)
- Mexican 3%
- Common ancestry
- Italian 2% Slovak 2% Serbian 1%
- Foreign-born
- 5% · Canada, Vietnam
- Languages at home
- 92% English-only · Spanish 5% Arabic 2%
Political lean MEDSL · Morgan
- 2024 margin
- Solid R (+52.6) · D 23.2% · R 75.8%
- 2008→2024 swing
- -8.8pp toward R · 2008: -43.8pp · 2024: -52.6pp
- All cycles
- 2024: R+52.6 2020: R+49.2 2016: R+52.4 2012: R+44.5 2008: R+43.8
Not yet ingested
- Civics
- —
Market trends
- HPI YoY
- ▼ -141.07%
- Current HPI
- 243.157
- Rent YoY
- —
- Metro
- Decatur, AL
- State GDP YoY
- ▲ 2.94%
- F500 in state
- 4
Industry mix (Fortune 500 HQ in AL)
| Industry | F500 HQs | Revenue |
|---|---|---|
| Financial Services | 1 | $8B |
|
||
| Healthcare | 1 | $5B |
|
||
Price history
+309.0% since first listed13 events — show timeline
- 2026-03-08 Price Changed $409,000 VMLS
- 2025-12-22 Listed $415,000 VMLS
- 2024-12-23 Sold (Public Records) $370,000 Public Records
- 2024-12-20 Sold (MLS) $370,000 VMLS
- 2024-11-18 Pending — VMLS
- 2024-10-04 Listed $399,000 VMLS
- 2024-03-14 Rental Removed $820 APPFOLIO
- 2024-01-31 Listed for Rent $820 APPFOLIO
- 2024-01-26 Rental Removed $820 APPFOLIO
- 2023-10-27 Listed for Rent $820 APPFOLIO
- 2019-07-01 Sold (Public Records) $145,000 Public Records
- 2006-01-24 Sold (Public Records) $139,000 Public Records
- 2002-09-30 Sold (Public Records) $100,000 Public Records
Property tax history
+5.0%/yrLatest (2025): $2,180 · +0.0% YoY. Source: county tax records.
Cash-flow waterfall
monthlySold comps — $/sqft
last 12 mo · ≤1 miLoading sold comps…