7024 Taylor Creek Loop · Centerville, TN
Flood risk 1/10 · Minimal
- FEMA flood zone
- X (unshaded)
- Chance of flooding over 30 yrs
- 0.0%
- Est. flood insurance / yr
- $507 – $1,088
Fire risk 4/10 · Minor
- Est. fire insurance / yr
- $949 – $1,763
Heat risk 4/10 · Minor
- Hot days now (above 108°F)
- 7 days/yr
- Hot days in 30 yrs
- 20 days/yr
Wind risk 4/10 · Minor
- Chance of severe wind over 30 yrs
- 9.0%
Air-quality risk 1/10 · Minimal
- Unhealthy air days now
- 0 days/yr
- Unhealthy air days in 30 yrs
- 0 days/yr
Risk factors via First Street. Map © Google.
Why this score? — see what drove the B+ grade
The composite is a weighted blend of 9 inputs, each scored 0–100. Each bar is that input's sub-score; the figure is the points it added to the 100-point composite (weight × sub-score).
- Cash flow +27.4/30.0
- ARV discount +15.0/15.0
- Appreciation +10.0/10.0
- DSCR +9.6/10.0
- 1% rule +7.5/10.0
- Livability +3.5/5.0
- Rent growth +2.5/5.0
- Condition / age +2.5/5.0
- Schools +1.8/10.0
$84,900
🖨 Deal sheet 📄 Offer letter ✓ Due diligence
Listing remarks MLS
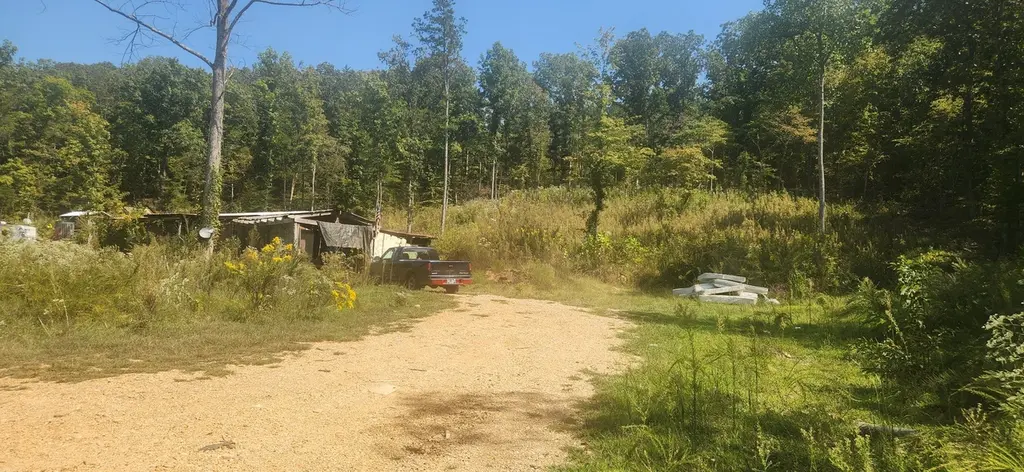
1232' mobile home with 3 beds/2 baths on 5 acres and less than $85,000. Inside of home seems to be sound and in better shape than exterior pictures may suggest. Home and property will need mowing, cleaning, painting and minor repairs. Property was originally 6.82 acres but a small lot was surveyed out of the middle of property and sold to a family member (property map in the pictures section shows what was sold). Land around the home is close to 2 acres and is mostly level with hill on backside. Remaining 3+ acres on other side is mostly hillside timber with some level up front. Selling "as is". Buyer is welcome to make an inspection but seller will make no repairs or replacements. Cash or conventional financing. Acreage is based on the 6.82 tax record acreage minus the 1.54 acres that was surveyed out and sold. Seller bought property without title on mobile home and is selling the same way.
Key facts
- 5.28 acre lot
- 2 garage spots
- Built 1980
Neighborhood map
What this means for you Summary
Snapshot
- This is a 3-bed/2.0-bath other listed at $85k.
Deal economics
- At list price, monthly cash flow is $249 ($3k/yr) — positive.
- The deal already cash-flows at list — no discount required.
- Meets the 1% rule at list price ($1k rent vs $85k).
- Recommended offer: $75k (12.0% below list) — sets the bar for market timing.
- Cap rate 9.8% vs local median 1.9% in Centerville — top-decile yield for the area; either an underpriced asset or a hidden risk that comps aren't pricing in. Stress-test before assuming the spread holds.
Location & tenants
- Location reads 69/100 on livability (#62 in TN) — a middle-class / working-renter tenant base. Strengths: crime A+, cost of living A+, health & safety A+; Watch: schools F, amenities F, commute F.
- Hickman County (rural): math 20% / reading 23% proficiency, ranked #107 of 139 in TN (top 77%) — low school quality limits family demand, transient renter base, plan for 1-2y turnover.
- Market conditions: 64 active listings in the ZIP; 121 units permitted in Hickman County in 2024 (0 in 5+ unit buildings).
Forward outlook
- In year one you build about $9k of equity ($587 loan paydown + $8k appreciation (10.0% local appreciation)).
- Hickman County population projected at -14% by 2050 — secular population decline; favor cash flow + early exit over multi-decade hold.
- At projected returns (10.0% appreciation + 3.0% rent growth), your $24k cash investment doubles in ~2 years — after that, you're playing with house money.
- By year 4, paydown + projected appreciation supports a ~$32k cash-out refi (75% LTV) — recoverable capital for the next deal without selling this one.
Negotiation context
- It's been on market 247 days — a 12% lower offer ($75k) is reasonable based on typical stale-listing flexibility.
- 2 sale attempts since 4y ago with the ask held roughly flat each time — persistent listings suggest the price (not the market) is what's stuck; bring a comps-based counter.
- Current owner paid $65k; 31% above their basis — modest negotiation headroom, anchor on the comps not their cost.
Questions for the listing agent
- It's been on market 247 days. Have you received any prior offers? Is the seller open to a 12% concession, seller financing, or rate buy-down credit?
- Why hasn't it sold? Are there any deal-killer items the seller is aware of (foundation, flood, title, zoning, code violations)?
- Is there a deadline driving the sale (1031 exchange, divorce, estate, relocation)? That informs how much negotiation room exists.
- Schools are F-rated, which usually means shorter tenancies and higher turnover. Who's the typical renter profile here, and what's been the actual vacancy rate?
- What's the average days-on-market for RENTAL listings here right now (not sales)? A rising rental-DOM trend means longer vacancies and softer asking-rent achievability than the comps imply.
- What's the recent tenant-quality profile in this submarket — average credit score on applications, eviction rate, late-payment / NSF rate, and stable-employment percentage? A property-management company in the area should have these aggregated.
- How much new for-sale + rental construction is in the pipeline within 1–3 miles? Heavy new supply typically softens prices + rents 12–24 months out; constrained supply supports both.
Investment metrics
- 1% rule
- 1.25% ✓
- Cap rate
- 9.81%
- Cash-on-cash
- 12.55%
- DSCR
- 1.56
- GRM
- 6.7
CMA / ARV
- ARV (median comp)
- $135,039
- List price
- $84,900
- Delta
- -37.13%
- Verdict
- UNDERPRICED
- Comps
- 2 within 1.0 mi
Projected returns pro-forma
10.0% appreciation · 3.0% rent growth · sell at horizon
- IRR
- 33.5%
- Equity multiple
- 3.61×
- Total profit
- $62,090
- Equity at exit
- $76,485
- IRR
- 28.9%
- Equity multiple
- 8.17×
- Total profit
- $170,423
- Equity at exit
- $164,942
Cash invested: $23,772 (down + closing). Projections, not guarantees.
Landlord ↔ Tenant lean methodology
- Overall (STATE)
- 87 Strongly Landlord-Friendly
- State Tennessee
- 87 Strongly Landlord-Friendly · R+13
- County
- — inherits STATE
- City
- — inherits STATE
ZIP-level market 37137
- Home prices YoY
- 13.4%
- Active inventory
- 64
- Price-to-rent
- 6.7×
Monthly cashflow live
- Estimated rent
- $1,057 medium interval (Pro) →
- Mortgage (P&I)
- −$445
- Tax est. 1.5%
- −$106 /mo · $1,274/yr
- Insurance
- −$35
- HOA
- −$0
- Vacancy / Maint / Mgmt
- −$222
- Net cashflow
- $249
Break-even live
UW: 25.0% down · 7.5% · 30yr · 1.5% tax · 5.0% vac · 8.0% maint · 8.0% mgmt
Financing live
Cash to close
- Down payment
- $21,225
- Closing costs
- $2,547
- Reserves months
- —
- Total cash needed
- —
Loan-product check · same deal, 3 products live
Conventional
25% down · 7.5% · 30yr
- Down + closing
- —
- Monthly P&I
- —
- Monthly cashflow
- —
- DSCR
- —
- Eligible?
- —
Personal DTI + credit; lowest rate.
DSCR
20% down · 8.5% · 30yr
- Down + closing
- —
- Monthly P&I
- —
- Monthly cashflow
- —
- DSCR
- —
- Eligible?
- —
No personal income docs; deal must DSCR.
Hard money
10% down · 12.0% · 12mo
- Down + closing
- —
- Monthly P&I
- —
- Monthly cashflow
- —
- DSCR
- —
- Eligible?
- —
Short-term bridge; refi at stabilization.
Listing history 6 events
-
2025-09-19$84,900 Active 914-char remark
Show marketing remark (914 chars)
1232' mobile home with 3 beds/2 baths on 5 acres and less than $85,000. Inside of home seems to be sound and in better shape than exterior pictures may suggest. Home and property will need mowing, cleaning, painting and minor repairs. Property was originally 6.82 acres but a small lot was surveyed out of the middle of property and sold to a family member (property map in the pictures section shows what was sold). Land around the home is close to 2 acres and is mostly level with hill on backside. Remaining 3+ acres on other side is mostly hillside timber with some level up front. Selling "as is". Buyer is welcome to make an inspection but seller will make no repairs or replacements. Cash or conventional financing. Acreage is based on the 6.82 tax record acreage minus the 1.54 acres that was surveyed out and sold. Seller bought property without title on mobile home and is selling the same way.
-
2022-10-24soldstatus $65,000
-
2022-10-18soldstatus $65,000 Closed 316-char remark
Show marketing remark (316 chars)
Come build you dream home on 6.82 acres out in the country! Electric, water and septic already in place. Over 900 ft of road frontage. Older mobile home in need of work plus 2 storage sheds. Remodel if you're handy or completely clear off and start new. Please contact Listing Broker before entering the mobile home.
-
2022-09-08historical Active Under Contract 316-char remark
Show marketing remark (316 chars)
Come build you dream home on 6.82 acres out in the country! Electric, water and septic already in place. Over 900 ft of road frontage. Older mobile home in need of work plus 2 storage sheds. Remodel if you're handy or completely clear off and start new. Please contact Listing Broker before entering the mobile home.
-
2022-08-24$60,000 Active 316-char remark
Show marketing remark (316 chars)
Come build you dream home on 6.82 acres out in the country! Electric, water and septic already in place. Over 900 ft of road frontage. Older mobile home in need of work plus 2 storage sheds. Remodel if you're handy or completely clear off and start new. Please contact Listing Broker before entering the mobile home.
-
2009-05-19soldstatus $120,488
ⓘ Source: listings_history table (triggers on properties + properties_extension) + one-shot
backfill from property_details.listing_events for pre-trigger history.
Climate risk First Street
- Flood 1/10 Low FEMA zone X (unshaded) · 0% chance over 30 yrs
- Wildfire 4/10 Moderate
- Heat 4/10 Moderate 7 d/yr ≥108°F today · 20 d/yr by 30 yrs out
- Wind 4/10 Moderate 9% chance of damaging wind over 30 yrs
- Air quality 1/10 Low 0 unhealthy d/yr today · 0 by 30 yrs out
Nearby sold comps map
Loading sold comps map…
Walkable amenities ~0.75 mi
Loading nearby amenities…
Taxation est. · year 1
- Rental income
- $12,689
- − Mortgage interest
- −$4,756
- − Property taxes
- −$1,274
- − Insurance
- −$424
- − Repairs & maintenance
- −$1,015
- − Management
- −$1,015
- − Depreciation
- −$2,470
- Taxable income
- $1,735
- Est. tax owed @ 24.0%
- −$416
- After-tax cash flow
- $2,567/yr
For passive investors: Depreciation is non-cash, so a rental often shows a tax loss while cash-flowing — sheltering income. Rental losses are passive: they offset passive income freely, and up to $25,000/yr can offset ordinary (W-2) income if you actively participate and your MAGI is under $100k (phasing out to $0 by $150k); unused losses carry forward. On sale, claimed depreciation is recaptured at up to 25%, and gains may owe capital-gains tax (a 1031 exchange can defer both). Figures are a year-1 estimate at your 24.0% rate — not tax advice; consult a CPA.
Schools (NCES district)
- District
- Hickman County
- NCES district ID
- 4701860
- Math proficiency
- 20% ▼ -9.00%
- Reading proficiency
- 23% ▼ -6.00%
- Median HH income
- $39,457
- Composite
- 18.14/100
- National rank
- #8966
- State rank
- #107 of 139 in TN
Livability — Centerville
- Score
- 69/100
- State rank
- #62
- US rank
- #8292
Category grades
Schools grade is shown separately in the Schools card above.
Census & demographics
- Population (ZIP)
- 1,999
Population outlook (Hickman County) Hauer SSP2
- Today (2025)
- 23,337 people
- By 2030
- 22,650 · -2.9%
- By 2040
- 21,310 · -8.7%
- By 2050
- 19,972 · -14.4%
- By 2075
- 17,073 · -26.8%
- By 2100
- 14,630 · -37.3%
Race, ethnicity, and origin ACS 2023
- Neighborhood character
- Predominantly White (95%)
- Race & ethnicity
- White 95% Hispanic / Latino 4% Two or more races 2%
- Common ancestry
- Italian 7% Slovak 4% Romanian 2%
- Foreign-born
- 2%
- Languages at home
- 96% English-only · Tagalog/Filipino 2% French/Haitian/Cajun 1% Spanish 1%
Political lean MEDSL · Hickman
- 2024 margin
- Solid R (+61.1) · D 19.1% · R 80.2%
- 2008→2024 swing
- -46.7pp toward R · 2008: -14.4pp · 2024: -61.1pp
- All cycles
- 2024: R+61.1 2020: R+55.4 2016: R+49.8 2012: R+27.2 2008: R+14.4
Not yet ingested
- Civics
- —
Market trends
- HPI YoY
- ▲ 12.56%
- Current HPI
- 106.4702
- Rent YoY
- —
- Metro
- —
- State GDP YoY
- ▲ 2.78%
- F500 in state
- 22
Industry mix (Fortune 500 HQ in TN)
| Industry | F500 HQs | Revenue |
|---|---|---|
| Healthcare | 3 | $91B |
|
||
| Retail | 3 | $72B |
|
||
| Transportation / Logistics | 1 | $88B |
|
||
| Paper / Packaging | 1 | $19B |
|
||
| Insurance | 1 | $13B |
|
||
| Energy | 1 | $12B |
|
||
Price history
-29.5% since first listed6 events — show timeline
- 2025-09-19 Listed $84,900 REALTRACS as Distributed by MLS Grid
- 2022-10-24 Sold (Public Records) $65,000 Public Records
- 2022-10-18 Sold (MLS) $65,000 REALTRACS as Distributed by MLS Grid
- 2022-09-08 Contingent — REALTRACS as Distributed by MLS Grid
- 2022-08-24 Listed $60,000 REALTRACS as Distributed by MLS Grid
- 2009-05-19 Sold (Public Records) $120,488 Public Records
Property tax history
-2.9%/yrLatest (2025): $135 · -28.6% YoY. Source: county tax records.
Cash-flow waterfall
monthlySold comps — $/sqft
last 12 mo · ≤1 miLoading sold comps…