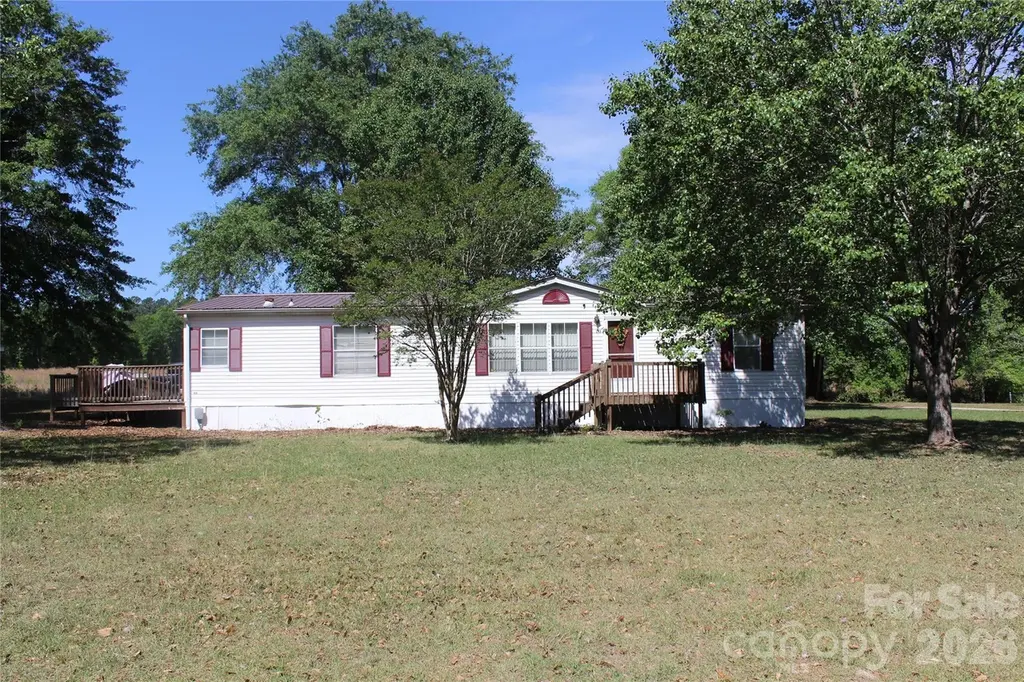
249 J L Green Ln · Pageland, SC
Flood risk 1/10 · Minimal
- FEMA flood zone
- X (unshaded)
- Chance of flooding over 30 yrs
- 0.0%
- Est. flood insurance / yr
- $507 – $1,088
Fire risk 5/10 · Moderate
- Est. fire insurance / yr
- $783 – $1,453
Heat risk 6/10 · Moderate
- Hot days now (above 107°F)
- 7 days/yr
- Hot days in 30 yrs
- 16 days/yr
Wind risk 6/10 · Moderate
- Chance of severe wind over 30 yrs
- 58.0%
Air-quality risk 2/10 · Minimal
- Unhealthy air days now
- 1 days/yr
- Unhealthy air days in 30 yrs
- 1 days/yr
Risk factors via First Street. Map © Google.
Why this score? — see what drove the C- grade
The composite is a weighted blend of 9 inputs, each scored 0–100. Each bar is that input's sub-score; the figure is the points it added to the 100-point composite (weight × sub-score).
- Cash flow +15.8/30.0
- Appreciation +10.0/10.0
- ARV discount +7.5/15.0
- DSCR +4.9/10.0
- 1% rule +3.2/10.0
- Livability +2.6/5.0
- Rent growth +2.5/5.0
- Schools +2.5/10.0
- Condition / age +2.5/5.0
$199,999
🖨 Deal sheet 📄 Offer letter ✓ Due diligence
Listing remarks
Discover comfort, privacy, and value with this well-maintained 3-bedroom, 2-bathroom mobile home situated on 0.63 peaceful acres. Perfect for first-time homebuyers or investors, this property offers the advantage of a mobile home permanently attached to the land, making financing and long-term ownership more accessible. With no HOA, you’ll enjoy the freedom to use your property your way. Home is being sold as-is, including washer, dryer, refrigerator, offering a great opportunity to make it your own. Take in the beautiful pasture view from the side deck—an ideal spot for morning coffee or evening unwinding. The home includes a convenient access ramp and a huge garage with a dedi
Key facts
- Pasture view
- Huge garage
- Dedicated workspace
Tags
Property features AI
Finance
- HOA & community: No HOA
Exterior
- Parking: Detached garage (1-car); Additional 3 open parking spaces
- Utilities: City water; Private sewer; Cable connected; Electricity connected; Wired internet available
- Home design: Single family residence — manufactured doublewide; One level; Facing information not provided
- Construction: Manufactured construction; Vinyl exterior; Metal roof; Built on a permanent foundation; One-story
- Exterior features: Deck; Front porch; Cleared, wooded lot with views; Publicly maintained road; Gravel and paved road surfaces; Ramp(s) to main level (accessibility)
Interior
- Kitchen: Electric oven; Refrigerator
- Bedrooms: 3 bedrooms (all on the main level)
- Flooring: Carpet; Linoleum
- Bathrooms: 2 full bathrooms (both on the main level)
- Heating & cooling: Forced air heating; Central air conditioning
- Interior features: 11 total rooms; Ceiling fan(s); Storage; Walk-in closet(s); Permanent foundation
- Laundry & utility: Washer/Dryer included; Utility room
Neighborhood map
What this means for you Summary
Snapshot
- This is a 3-bed/2.0-bath other listed at $200k.
Deal economics
- At list price, monthly cash flow is $91 ($1k/yr) — positive.
- The deal already cash-flows at list — no discount required.
- To meet the 1% rule (rent ≥ 1% of price), the offer needs to be $163k (18.4% below list).
- Recommended offer: $163k (18.4% below list) — sets the bar for 1% rule.
- Cap rate 6.8% vs local median 4.0% in Pageland — top-decile yield for the area; either an underpriced asset or a hidden risk that comps aren't pricing in. Stress-test before assuming the spread holds.
Location & tenants
- Location reads 52/100 on livability (#352 in SC) — a working-class tenant base; expect higher turnover. Strengths: cost of living A+, housing A+; Watch: crime F, amenities F, commute F.
- Chesterfield 01 (rural): math 25% / reading 36% proficiency, ranked #55 of 80 in SC (top 69%) — families likely to look elsewhere, expect single-tenant / working-renter base with shorter leases; 63% free/reduced lunch — lower-income household profile, screen leases tightly.
- Zoned schools: Petersburg Primary (434 students, 100% FRL); Central High (math 27% / reading 72%, grade D, #151 of 196 statewide, top 79%, 644 students, 100% FRL) — zoned schools average 100% FRL vs 63% district-wide (37 pts higher); higher-poverty schools than district average — tighter screening recommended.
- Zoned-school proficiency averages 50% at this address vs 30% district-wide (+19 pts) — the actual schools serving this property are materially stronger than the Chesterfield 01 average implies; a family-tenant draw the district grade alone would hide.
- Market conditions: 118 active listings in the ZIP; 145 units permitted in Chesterfield County in 2024 (10 in 5+ unit buildings).
Forward outlook
- In year one you build about $21k of equity ($1k loan paydown + $20k appreciation (10.0% local appreciation)).
- Chesterfield County population projected at -17% by 2050 — secular population decline; favor cash flow + early exit over multi-decade hold.
- At projected returns (10.0% appreciation + 3.0% rent growth), your $56k cash investment doubles in ~3 years — after that, you're playing with house money.
- By year 2, paydown + projected appreciation supports a ~$34k cash-out refi (75% LTV) — recoverable capital for the next deal without selling this one.
Negotiation context
- It's been on market 56 days — a 3% lower offer ($194k) is reasonable based on typical stale-listing flexibility.
- Current owner paid $130k; list at $200k implies a 54% gain — meaningful room to come down on a strong offer.
Risks & watch-outs
- Climate carrying-cost: major wind risk, 58% chance of damaging wind over 30y; moderate wildfire risk; extreme-heat days projected 7→16/yr by 2055 (HVAC capex compounding) — expect insurance premiums to compound above CPI over the hold.
Questions for the listing agent
- It's been on market 56 days. Have you received any prior offers? Is the seller open to a 18% concession, seller financing, or rate buy-down credit?
- Is there a deadline driving the sale (1031 exchange, divorce, estate, relocation)? That informs how much negotiation room exists.
- Schools are F-rated, which usually means shorter tenancies and higher turnover. Who's the typical renter profile here, and what's been the actual vacancy rate?
- Crime grade is F in this area — have there been break-ins, vandalism, or insurance claims at this property in the last 3 years? What carrier currently insures it and at what premium?
- What's the average days-on-market for RENTAL listings here right now (not sales)? A rising rental-DOM trend means longer vacancies and softer asking-rent achievability than the comps imply.
- What's the recent tenant-quality profile in this submarket — average credit score on applications, eviction rate, late-payment / NSF rate, and stable-employment percentage? A property-management company in the area should have these aggregated.
- How much new for-sale + rental construction is in the pipeline within 1–3 miles? Heavy new supply typically softens prices + rents 12–24 months out; constrained supply supports both.
Investment metrics
- 1% rule
- 0.82% ✗
- Cap rate
- 6.84%
- Cash-on-cash
- 1.95%
- DSCR
- 1.09
- GRM
- 10.2
CMA / ARV
No comps found within radius.
Projected returns pro-forma
10.0% appreciation · 3.0% rent growth · sell at horizon
- IRR
- 25.7%
- Equity multiple
- 3.05×
- Total profit
- $114,626
- Equity at exit
- $180,175
- IRR
- 22.6%
- Equity multiple
- 6.94×
- Total profit
- $332,825
- Equity at exit
- $388,554
Cash invested: $56,000 (down + closing). Projections, not guarantees.
Landlord ↔ Tenant lean methodology
- Overall (STATE)
- 90 Strongly Landlord-Friendly
- State South Carolina
- 90 Strongly Landlord-Friendly · R+6
- County
- — inherits STATE
- City
- — inherits STATE
ZIP-level market 29728
- Home prices YoY
- 19.9%
- Active inventory
- 118
- Price-to-rent
- 10.2×
Monthly cashflow live
- Estimated rent
- $1,631 medium interval (Pro) →
- Mortgage (P&I)
- −$1,049
- Tax from tax record
- −$66 /mo · $788/yr
- Insurance
- −$83
- HOA
- −$0
- Vacancy / Maint / Mgmt
- −$343
- Net cashflow
- $91
Break-even live
UW: 25.0% down · 7.5% · 30yr · 1.5% tax · 5.0% vac · 8.0% maint · 8.0% mgmt
Financing live
Cash to close
- Down payment
- $50,000
- Closing costs
- $6,000
- Reserves months
- —
- Total cash needed
- —
Loan-product check · same deal, 3 products live
Conventional
25% down · 7.5% · 30yr
- Down + closing
- —
- Monthly P&I
- —
- Monthly cashflow
- —
- DSCR
- —
- Eligible?
- —
Personal DTI + credit; lowest rate.
DSCR
20% down · 8.5% · 30yr
- Down + closing
- —
- Monthly P&I
- —
- Monthly cashflow
- —
- DSCR
- —
- Eligible?
- —
No personal income docs; deal must DSCR.
Hard money
10% down · 12.0% · 12mo
- Down + closing
- —
- Monthly P&I
- —
- Monthly cashflow
- —
- DSCR
- —
- Eligible?
- —
Short-term bridge; refi at stabilization.
Listing history 15 events
-
2026-06-18days on market $199,999 Active 56 DOM
-
2026-06-17days on market $199,999 Active 55 DOM
-
2026-06-16days on market $199,999 Active 54 DOM
-
2026-06-15days on market $199,999 Active 53 DOM
-
2026-06-13days on market $199,999 Active 51 DOM
-
2026-06-09days on market $199,999 Active 47 DOM
-
2026-06-08days on market $199,999 Active 46 DOM
-
2026-06-07days on market $199,999 Active 45 DOM
-
2026-06-04days on market $199,999 Active 42 DOM
-
2026-06-03days on market $199,999 Active 41 DOM
-
2026-06-02days on market $199,999 Active 40 DOM
-
2026-06-01days on market $199,999 Active 39 DOM
-
2026-05-31days on market $199,999 Active 38 DOM
-
2026-04-23$199,999 Active
-
2023-10-17soldstatus $130,000
ⓘ Source: listings_history table (triggers on properties + properties_extension) + one-shot
backfill from property_details.listing_events for pre-trigger history.
Tax reassessment forecast SC · Resets to sale price
- Current annual tax
- $788 · $66/mo
- Projected year-2 tax
- $1,140 · $95/mo
- Expected delta
- +$352/yr (+$29/mo · 44.7%)
ⓘ Screening estimate from a state-policy table — verify with the county assessor before closing.
Climate risk First Street
- Flood 1/10 Low FEMA zone X (unshaded) · 0% chance over 30 yrs
- Wildfire 5/10 Major
- Heat 6/10 Major 7 d/yr ≥107°F today · 16 d/yr by 30 yrs out
- Wind 6/10 Major 58% chance of damaging wind over 30 yrs
- Air quality 2/10 Low 1 unhealthy d/yr today · 1 by 30 yrs out
Nearby sold comps map
Loading sold comps map…
Walkable amenities ~0.75 mi
Loading nearby amenities…
Taxation est. · year 1
- Rental income
- $19,575
- − Mortgage interest
- −$11,203
- − Property taxes
- −$788
- − Insurance
- −$1,000
- − Repairs & maintenance
- −$1,566
- − Management
- −$1,566
- − Depreciation
- −$5,818
- Taxable loss
- −$2,366
- Est. tax savings @ 24.0%
- +$568
- After-tax cash flow
- $1,659/yr
For passive investors: Depreciation is non-cash, so a rental often shows a tax loss while cash-flowing — sheltering income. Rental losses are passive: they offset passive income freely, and up to $25,000/yr can offset ordinary (W-2) income if you actively participate and your MAGI is under $100k (phasing out to $0 by $150k); unused losses carry forward. On sale, claimed depreciation is recaptured at up to 25%, and gains may owe capital-gains tax (a 1031 exchange can defer both). Figures are a year-1 estimate at your 24.0% rate — not tax advice; consult a CPA.
Schools (NCES district)
- District
- Chesterfield 01
- NCES district ID
- 4501560
- Math proficiency
- 25% ▼ -11.00%
- Reading proficiency
- 36% ▬ 0.00%
- Median HH income
- $33,946
- Composite
- 25.04/100
- National rank
- #7547
- State rank
- #55 of 80 in SC
Livability — Pageland
- Score
- 52/100
- State rank
- #352
- US rank
- #24948
Category grades
Schools grade is shown separately in the Schools card above.
Census & demographics
- City population
- 9,470
- Population (ZIP)
- 9,470
Population outlook (Chesterfield County) Hauer SSP2
- Today (2025)
- 44,632 people
- By 2030
- 43,331 · -2.9%
- By 2040
- 40,218 · -9.9%
- By 2050
- 36,847 · -17.4%
- By 2075
- 29,636 · -33.6%
- By 2100
- 23,536 · -47.3%
Race, ethnicity, and origin ACS 2023
- Neighborhood character
- Diverse neighborhood (Simpson 0.62)
- Race & ethnicity
- White 48% Black 38% Two or more races 10% Hispanic / Latino 7%
- Hispanic origin (detail)
- Mexican 6%
- Common ancestry
- Serbian 1% Lithuanian 1% Romanian 1%
- Foreign-born
- 4% · Canada
- Languages at home
- 96% English-only · Spanish 4%
Political lean MEDSL · Chesterfield
- 2024 margin
- Strong R (+28.1) · D 35.5% · R 63.5% · Other 1.0%
- 2008→2024 swing
- -25.1pp toward R · 2008: -3.0pp · 2024: -28.1pp
- All cycles
- 2024: R+28.1 2020: R+20.5 2016: R+14.3 2012: R+3.3 2008: R+3.0
Not yet ingested
- Civics
- —
Market trends
- HPI YoY
- ▲ 49.76%
- Current HPI
- 299.8227
- Rent YoY
- —
- Metro
- —
- State GDP YoY
- ▲ 4.51%
- F500 in state
- 2
Industry mix (Fortune 500 HQ in SC)
| Industry | F500 HQs | Revenue |
|---|---|---|
| Packaging | 1 | $7B |
|
||
Price history
+53.8% since first listed2 events — show timeline
- 2026-04-23 Listed $199,999 CANOPYMLS as Distributed by MLS Grid
- 2023-10-17 Sold (Public Records) $130,000 Public Records
Property tax history
+31.0%/yrLatest (2025): $788 · +20.6% YoY. Source: county tax records.
Cash-flow waterfall
monthlySold comps — $/sqft
last 12 mo · ≤1 miLoading sold comps…