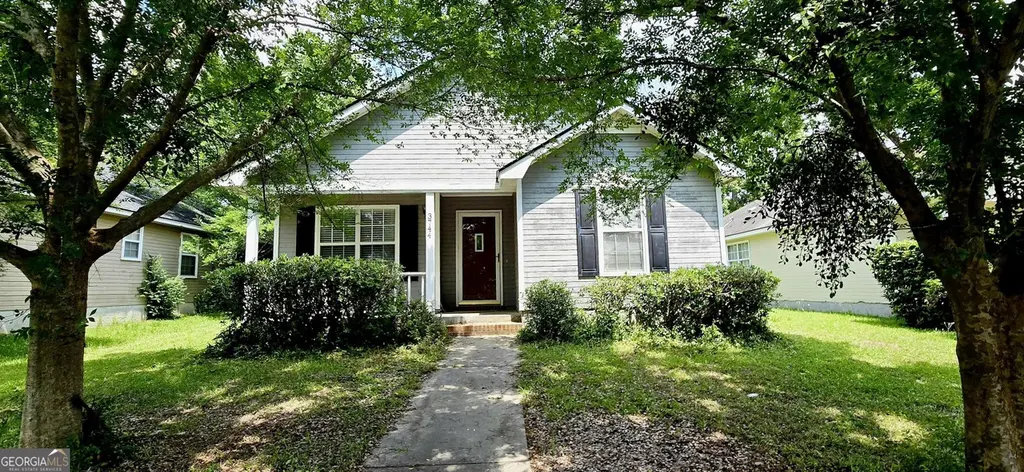
3744 Mulligan Rd · Bemiss, GA
Flood risk 1/10 · Minimal
- FEMA flood zone
- X (unshaded)
- Chance of flooding over 30 yrs
- 0.0%
- Est. flood insurance / yr
- $507 – $1,088
Fire risk 4/10 · Minor
- Est. fire insurance / yr
- $963 – $1,789
Heat risk 8/10 · Major
- Hot days now (above 108°F)
- 7 days/yr
- Hot days in 30 yrs
- 19 days/yr
Wind risk 8/10 · Major
- Chance of severe wind over 30 yrs
- 99.0%
Air-quality risk 6/10 · Moderate
- Unhealthy air days now
- 10 days/yr
- Unhealthy air days in 30 yrs
- 11 days/yr
Risk factors via First Street. Map © Google.
Why this score? — see what drove the C grade
The composite is a weighted blend of 9 inputs, each scored 0–100. Each bar is that input's sub-score; the figure is the points it added to the 100-point composite (weight × sub-score).
- Cash flow +19.0/30.0
- ARV discount +14.6/15.0
- DSCR +6.0/10.0
- Schools +4.7/10.0
- 1% rule +4.2/10.0
- Rent growth +3.8/5.0
- Livability +2.5/5.0
- Condition / age +2.5/5.0
- Appreciation +0.0/10.0
$174,900
🖨 Deal sheet 📄 Offer letter ✓ Due diligence
Listing remarks
Move-in ready home in a convenient Lowndes County location just minutes from Moody AFB, Walmart, Publix, and Freedom Park. This well-kept property provides a comfortable layout with a practical design suited for everyday living. A major update includes a new roof installed in 2026. Inside, the spacious living room has laminate wood flooring that creates a warm and open feel. The kitchen provides generous counter space, a pantry, and comes fully equipped with a refrigerator, stove, and dishwasher. The home includes easy-to-maintain finishes throughout and delivers a comfortable living space in a convenient location. A solid property with an important structural upgrade already completed. Tru
Key facts
- New roof
- 5,227 sq ft lot
- 2 parking spots
Tags
Property features AI
Finance
- Other: Listing accepts Cash, Conventional, FHA, VA loans, and other terms
- HOA & community: No homeowners association; Community park and playground; Street lights; Close to shopping
Exterior
- Parking: Two parking spaces; No special parking features
- Utilities: Public water available; Septic tank; Electricity available; High-speed internet available; Water available
- Home design: Single-family house; One story; Resale property
- Construction: Built in 1997; Composition roof; Other construction materials
- Exterior features: Level lot; Other exterior features
Interior
- Kitchen: Dishwasher; Microwave; Refrigerator; Electric water heater; Other kitchen features
- Bedrooms: Three bedrooms on the main level
- Flooring: Carpet; Laminate; Tile
- Bathrooms: Two full bathrooms (main level)
- Heating & cooling: Central heating; Central air conditioning
- Interior features: Tray ceilings; Walk-in closets; Other interior features
- Laundry & utility: Laundry area in kitchen; Washer/Dryer hookup (dryer included)
Neighborhood map
What this means for you Summary
Snapshot
- This is a 3-bed/2.0-bath single-family listed at $175k.
Deal economics
- At list price, monthly cash flow is $181 ($2k/yr) — positive.
- The deal already cash-flows at list — no discount required.
- To meet the 1% rule (rent ≥ 1% of price), the offer needs to be $162k (7.6% below list).
- Recommended offer: $162k (7.6% below list) — sets the bar for 1% rule.
- Cap rate 7.5% vs local median 4.7% in Bemiss — top-decile yield for the area; either an underpriced asset or a hidden risk that comps aren't pricing in. Stress-test before assuming the spread holds.
Location & tenants
- Location reads: area grade C — affects rentability + tenant quality, not the cash-flow math above.
- Lowndes County (rural): math 59% / reading 52% proficiency, ranked #8 of 174 in GA (top 5%) — acceptable for families but not a draw, mixed tenant base, ~2y average lease.
- Zoned schools: Dewar Elementary (math 61% / reading 47%, grade C, #204 of 1,228 statewide, top 17%, 859 students, 50% FRL); Pine Grove Middle School (math 56% / reading 57%, grade B, #48 of 470 statewide, top 10%, 742 students, 50% FRL); Lowndes High School (math 69% / reading 51%, grade C+, #14 of 424 statewide, top 3%, 3,201 students, 39% FRL) — zoned schools at 46% FRL track the district average.
- Market conditions: Rents rising fast (+5.1%/yr); 228 active listings in the ZIP; 21 comparable units currently listed for rent nearby; rentals at typical pace (median 21d on market — plan ~3-4 weeks tenant-placement turnaround); solid renter incomes; 896 units permitted in Lowndes County in 2024 (0 in 5+ unit buildings).
Forward outlook
- Local home prices are declining (-3.0%/yr); year-one equity from $1k of loan paydown is wiped out by about $5k of value loss. Plan a longer hold.
- Lowndes County population projected at +10% by 2050 — modest demand growth; plan on rents tracking national, not racing it.
Negotiation context
- It's been on market 32 days — a 3% lower offer ($170k) is reasonable based on typical stale-listing flexibility.
- 2 sale attempts since 9y ago with the ask held roughly flat each time — persistent listings suggest the price (not the market) is what's stuck; bring a comps-based counter.
- Current owner paid $78k; list at $175k implies a 126% gain — meaningful room to come down on a strong offer.
Risks & watch-outs
- Climate carrying-cost: severe wind risk, 99% chance of damaging wind over 30y; extreme-heat days projected 7→19/yr by 2055 (HVAC capex compounding) — expect insurance premiums to compound above CPI over the hold.
Questions for the listing agent
- It's been on market 32 days. Have you received any prior offers? Is the seller open to a 8% concession, seller financing, or rate buy-down credit?
- Is there a deadline driving the sale (1031 exchange, divorce, estate, relocation)? That informs how much negotiation room exists.
- What's the average days-on-market for RENTAL listings here right now (not sales)? A rising rental-DOM trend means longer vacancies and softer asking-rent achievability than the comps imply.
- What's the recent tenant-quality profile in this submarket — average credit score on applications, eviction rate, late-payment / NSF rate, and stable-employment percentage? A property-management company in the area should have these aggregated.
- How much new for-sale + rental construction is in the pipeline within 1–3 miles? Heavy new supply typically softens prices + rents 12–24 months out; constrained supply supports both.
Investment metrics
- 1% rule
- 0.92% ✗
- Cap rate
- 7.54%
- Cash-on-cash
- 4.45%
- DSCR
- 1.20
- GRM
- 9.0
CMA / ARV
- ARV (on-the-fly)
- $207,928
- Comps found
- 12
Show comp detail 12 sales within ~0.75 mi
| Address | Dist | Beds/Ba | Sqft | Sold | Price | $/sf | Match |
|---|---|---|---|---|---|---|---|
| 3901 Lillian Guest Cir | 0.09mi | 3/2.0 | 1,371 (+4%) | 1mo | $215,000 | $157 | 88 |
| 3713 Mulligan Rd | 0.13mi | 3/2.0 | 1,212 (-8%) | 6mo | $168,000 | $139 | 76 |
| 3772 Robin Ln | 0.30mi | 3/2.0 | 1,426 (+8%) | 2mo | $225,000 | $158 | 71 |
| 3324 Summit Chase Dr | 0.52mi | 3/2.0 | 1,353 (+3%) | 5mo | $198,900 | $147 | 67 |
| 3747 Robin Ln | 0.34mi | 3/2.0 | 1,436 (+9%) | 3mo | $211,000 | $147 | 66 |
| 3789 Heatherwoods Dr | 0.48mi | 3/2.0 | 1,377 (+5%) | 6mo | $213,000 | $155 | 65 |
| 6154 Bemiss Springs Dr | 0.53mi | 3/2.5 | 1,470 (+12%) | 0mo | $243,900 | $166 | 54 |
| 6206 Bemiss Springs Dr | 0.58mi | 3/2.5 | 1,459 (+11%) | 0mo | $235,900 | $162 | 53 |
| 6202 Bemiss Springs Dr | 0.57mi | 3/2.5 | 1,459 (+11%) | 3mo | $237,000 | $162 | 51 |
| 6186 Bemiss Springs Dr | 0.56mi | 3/2.5 | 1,470 (+12%) | 3mo | $245,000 | $167 | 50 |
| 6189 Bemiss Springs Dr | 0.57mi | 3/2.5 | 1,470 (+12%) | 4mo | $245,900 | $167 | 48 |
| 6420 Abney Ct | 0.60mi | 3/2.5 | 1,459 (+11%) | 6mo | $230,900 | $158 | 47 |
Match score weights: distance 35% · size 25% · config 20% · recency 20%. Top-matched comps best support the ARV.
Projected returns pro-forma
-3.0% appreciation · 5.07% rent growth · sell at horizon
- IRR
- -7.3%
- Equity multiple
- 0.73×
- Total profit
- $-13,394
- Equity at exit
- $26,078
- IRR
- 4.6%
- Equity multiple
- 1.36×
- Total profit
- $17,745
- Equity at exit
- $15,122
Cash invested: $48,972 (down + closing). Projections, not guarantees.
Landlord ↔ Tenant lean methodology
- Overall (STATE)
- 90 Strongly Landlord-Friendly
- State Georgia
- 90 Strongly Landlord-Friendly · R+3
- County
- — inherits STATE
- City
- — inherits STATE
ZIP-level market 31605
- Home prices YoY
- -11.5%
- Rents YoY
- 5.1%
- Active inventory
- 228
- Price-to-rent
- 9.0×
Monthly cashflow live
- Estimated rent
- $1,617 high interval (Pro) →
- Mortgage (P&I)
- −$917
- Tax from tax record
- −$106 /mo · $1,267/yr
- Insurance
- −$73
- HOA
- −$0
- Vacancy / Maint / Mgmt
- −$339
- Net cashflow
- $181
Break-even live
UW: 25.0% down · 7.5% · 30yr · 1.5% tax · 5.0% vac · 8.0% maint · 8.0% mgmt
Financing live
Cash to close
- Down payment
- $43,725
- Closing costs
- $5,247
- Reserves months
- —
- Total cash needed
- —
Loan-product check · same deal, 3 products live
Conventional
25% down · 7.5% · 30yr
- Down + closing
- —
- Monthly P&I
- —
- Monthly cashflow
- —
- DSCR
- —
- Eligible?
- —
Personal DTI + credit; lowest rate.
DSCR
20% down · 8.5% · 30yr
- Down + closing
- —
- Monthly P&I
- —
- Monthly cashflow
- —
- DSCR
- —
- Eligible?
- —
No personal income docs; deal must DSCR.
Hard money
10% down · 12.0% · 12mo
- Down + closing
- —
- Monthly P&I
- —
- Monthly cashflow
- —
- DSCR
- —
- Eligible?
- —
Short-term bridge; refi at stabilization.
Rent comps 21 comps
| Address | Beds | Baths | Sqft | Rent | $/sqft | DOM | Units | Dist |
|---|---|---|---|---|---|---|---|---|
| 4184 Hamilton Cir Valdosta, GA | 3.0 | 2.0 | 1213 | $1,300 | $1.07 | 21d | 1 | 0.05mi |
| 3905 Heatherwoods Dr Valdosta, GA | 3.0 | 2.0 | 1250 | $1,350 | $1.08 | 21d | 1 | 0.23mi |
| 3491 Studstill Rd Unit A Valdosta, GA | 2.0 | 2.0 | 1007 | $1,200 | $1.19 | 43d | 1 | 0.28mi |
| 3553 Studstill Rd Valdosta, GA | 2.0 | 2.0 | 1040 | $1,000 | $0.96 | 21d | 1 | 0.31mi |
| 3905 Greenridge Rd Valdosta, GA | 3.0 | 2.0 | 1398 | $1,400 | $1.00 | 43d | 1 | 0.41mi |
| 3911 Nicole Ln Valdosta, GA | 3.0 | 2.0 | 1294 | $1,700 | $1.31 | 21d | 1 | 0.41mi |
| 6043 Bemiss Towns Dr Bemiss, GA | 3.0 | 2.5 | 1498 | $1,675 | $1.12 | 21d | 1 | 0.50mi |
| 6412 Abney Ct Valdosta, GA | 3.0 | 2.5 | 1459 | $1,500 | $1.03 | 21d | 1 | 0.58mi |
| 6416 Abney Ct Valdosta, GA | 3.0 | 2.5 | 1459 | $1,500 | $1.03 | 43d | 1 | 0.59mi |
| 3844 Coventry Dr Valdosta, GA | 4.0 | 2.0 | 1765 | $1,950 | $1.10 | 21d | 1 | 0.72mi |
| 3925 Glen Laurel Dr S Valdosta, GA | 3.0 | 2.0 | 1510 | $1,850 | $1.23 | 21d | 1 | 0.95mi |
| 5275 Branch Point Dr Valdosta, GA | 3.0 | 2.0 | 1307 | $2,000 | $1.53 | 21d | 1 | 0.97mi |
| 3822 Edinburg Cir Valdosta, GA | 4.0 | 2.0 | 1635 | $2,100 | $1.28 | 43d | 1 | 1.04mi |
| 3824 Brookfield Dr Valdosta, GA | 3.0 | 2.0 | 1517 | $2,000 | $1.32 | 21d | 1 | 1.05mi |
| 4032 Case Pt Valdosta, GA | 4.0 | 2.0 | 1664 | $2,050 | $1.23 | 21d | 1 | 1.08mi |
| 5121 Branch Point Dr Valdosta, GA | 3.0 | 2.0 | 1208 | $1,600 | $1.32 | 21d | 1 | 1.08mi |
| 4125 Barrington Dr Valdosta, GA | 3.0 | 2.0 | 1212 | $1,500 | $1.24 | 43d | 1 | 1.12mi |
| 4051 Gramercy Dr Valdosta, GA | 4.0 | 2.5 | 1771 | $2,300 | $1.30 | 21d | 1 | 1.17mi |
| 5073 Branch Point Dr Valdosta, GA | 3.0 | 2.0 | 1321 | $1,950 | $1.48 | 21d | 1 | 1.21mi |
| 5070 Branch Point Dr Valdosta, GA | 4.0–5.0 | 2.0–3.0 | 2190 | $2,188 | $1.00 | 21d | 2 | 1.23mi |
| 4001 Conway Cir Valdosta, GA | 3.0 | 2.0 | 1797 | $2,000 | $1.11 | 21d | 1 | 1.44mi |
Listing history 26 events
-
2026-06-19days on market $174,900 Active 32 DOM
-
2026-06-18days on market $174,900 Active 31 DOM
-
2026-06-17days on market $174,900 Active 30 DOM
-
2026-06-16days on market $174,900 Active 29 DOM
-
2026-06-15days on market $174,900 Active 28 DOM
-
2026-06-14days on market $174,900 Active 26 DOM
-
2026-06-13days on market $174,900 Active 25 DOM
-
2026-06-10days on market $174,900 Active 23 DOM
-
2026-06-09days on market $174,900 Active 22 DOM
-
2026-06-08days on market $174,900 Active 21 DOM
-
2026-06-07days on market $174,900 Active 20 DOM
-
2026-06-05days on market $174,900 Active 17 DOM
-
2026-06-03days on market $174,900 Active 16 DOM
-
2026-06-02days on market $174,900 Active 15 DOM
-
2026-06-01statusdays on market $174,900 Active 14 DOM
-
2026-05-31days on market $174,900 New 13 DOM
-
2026-05-30days on market $174,900 New 12 DOM
-
2026-05-18$174,900 New
-
2019-03-19soldstatus $77,500
-
2017-09-26soldstatus $80,000
-
2017-09-14soldstatus $80,000
-
2017-07-14$84,900
-
2007-11-06soldstatus $80,000
-
1999-02-10soldstatus $79,000
-
1997-10-03soldstatus $65,900
-
1996-09-16soldstatus $11,500
ⓘ Source: listings_history table (triggers on properties + properties_extension) + one-shot
backfill from property_details.listing_events for pre-trigger history.
Tax reassessment forecast GA · Resets to sale price
- Current annual tax
- $1,267 · $106/mo
- Projected year-2 tax
- $1,609 · $134/mo
- Expected delta
- +$342/yr (+$29/mo · 27.0%)
ⓘ Screening estimate from a state-policy table — verify with the county assessor before closing.
Climate risk First Street
- Flood 1/10 Low FEMA zone X (unshaded) · 0% chance over 30 yrs
- Wildfire 4/10 Moderate
- Heat 8/10 Severe 7 d/yr ≥108°F today · 19 d/yr by 30 yrs out
- Wind 8/10 Severe 99% chance of damaging wind over 30 yrs
- Air quality 6/10 Major 10 unhealthy d/yr today · 11 by 30 yrs out
Nearby sold comps map
Loading sold comps map…
Walkable amenities ~0.75 mi
Loading nearby amenities…
Taxation est. · year 1
- Rental income
- $19,399
- − Mortgage interest
- −$9,797
- − Property taxes
- −$1,267
- − Insurance
- −$874
- − Repairs & maintenance
- −$1,552
- − Management
- −$1,552
- − Depreciation
- −$5,088
- Taxable loss
- −$732
- Est. tax savings @ 24.0%
- +$176
- After-tax cash flow
- $2,353/yr
For passive investors: Depreciation is non-cash, so a rental often shows a tax loss while cash-flowing — sheltering income. Rental losses are passive: they offset passive income freely, and up to $25,000/yr can offset ordinary (W-2) income if you actively participate and your MAGI is under $100k (phasing out to $0 by $150k); unused losses carry forward. On sale, claimed depreciation is recaptured at up to 25%, and gains may owe capital-gains tax (a 1031 exchange can defer both). Figures are a year-1 estimate at your 24.0% rate — not tax advice; consult a CPA.
Schools (NCES district)
- District
- Lowndes County
- NCES district ID
- 1303390
- Math proficiency
- 59% ▼ -1.00%
- Reading proficiency
- 52% ▼ -2.00%
- Median HH income
- $48,221
- Composite
- 47.21/100
- National rank
- #2317
- State rank
- #8 of 174 in GA
Livability — Bemiss
No livability data for this city. (Only ~50 U.S. cities are tracked.)
Census & demographics
- Census place
- Bemiss, GA
- County
- Lowndes County · 107,801 people
- City population
- 24,280
- Metro
- Valdosta, GA
- Population (ZIP)
- 24,829
- Household income
- $79,156
- Rent vs Own
- Severe rent burden
- 642.0
Population outlook (Lowndes County) Hauer SSP2
- Today (2025)
- 120,348 people
- By 2030
- 123,469 · +2.6%
- By 2040
- 128,482 · +6.8%
- By 2050
- 131,907 · +9.6%
- By 2075
- 139,080 · +15.6%
- By 2100
- 133,649 · +11.1%
Race, ethnicity, and origin ACS 2023
- Neighborhood character
- Diverse neighborhood (Simpson 0.58)
- Race & ethnicity
- White 58% Black 27% Two or more races 7% Hispanic / Latino 7% Asian 2%
- Hispanic origin (detail)
- Mexican 3% Puerto Rican 3%
- Common ancestry
- Italian 2% Slovak 2% Lithuanian 2%
- Foreign-born
- 4% · Canada, South Korea, Vietnam
- Languages at home
- 93% English-only · Spanish 3% German/W. Germanic 1%
Political lean MEDSL · Lowndes
- 2024 margin
- R (+18.0) · D 40.8% · R 58.8%
- 2008→2024 swing
- -8.6pp toward R · 2008: -9.4pp · 2024: -18.0pp
- All cycles
- 2024: R+18.0 2020: R+12.0 2016: R+18.2 2012: R+10.5 2008: R+9.4
Not yet ingested
- Civics
- —
Market trends
- HPI YoY
- ▼ -24.74%
- Current HPI
- 189.8471
- Rent YoY
- ▲ 5.07%
- Metro
- Valdosta, GA
- State GDP YoY
- ▲ 2.66%
- F500 in state
- 28
Industry mix (Fortune 500 HQ in GA)
| Industry | F500 HQs | Revenue |
|---|---|---|
| Paper / Packaging | 2 | $29B |
|
||
| Retail | 1 | $160B |
|
||
| Transportation / Logistics | 1 | $91B |
|
||
| Airlines | 1 | $62B |
|
||
| Consumer Goods | 1 | $47B |
|
||
| Utilities | 1 | $25B |
|
||
Price history
+1420.9% since first listed9 events — show timeline
- 2026-05-18 Listed $174,900 GAMLS
- 2019-03-19 Sold (Public Records) $77,500 Public Records
- 2017-09-26 Sold (Public Records) $80,000 Public Records
- 2017-09-14 Sold (MLS) $80,000 SGMLS
- 2017-07-14 Listed $84,900 SGMLS
- 2007-11-06 Sold (Public Records) $80,000 Public Records
- 1999-02-10 Sold (Public Records) $79,000 Public Records
- 1997-10-03 Sold (Public Records) $65,900 Public Records
- 1996-09-16 Sold (Public Records) $11,500 Public Records
Property tax history
+4.0%/yrLatest (2025): $1,267 · +4.8% YoY. Source: county tax records.
Cash-flow waterfall
monthlySold comps — $/sqft
last 12 mo · ≤1 miLoading sold comps…