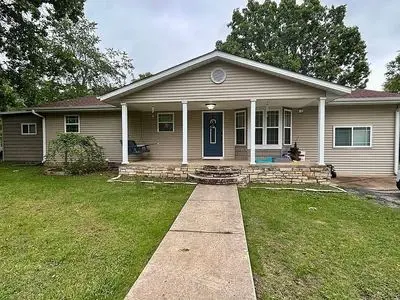
34 Alma Dr · Highland, AR
Flood risk 1/10 · Minimal
- FEMA flood zone
- X (unshaded)
- Chance of flooding over 30 yrs
- 0.0%
- Est. flood insurance / yr
- $507 – $1,088
Fire risk 5/10 · Moderate
- Est. fire insurance / yr
- $1,499 – $2,785
Heat risk 4/10 · Minor
- Hot days now (above 108°F)
- 7 days/yr
- Hot days in 30 yrs
- 20 days/yr
Wind risk 2/10 · Minimal
- Chance of severe wind over 30 yrs
- 4.0%
Air-quality risk 1/10 · Minimal
- Unhealthy air days now
- 0 days/yr
- Unhealthy air days in 30 yrs
- 0 days/yr
Risk factors via First Street. Map © Google.
Why this score? — see what drove the C grade
The composite is a weighted blend of 9 inputs, each scored 0–100. Each bar is that input's sub-score; the figure is the points it added to the 100-point composite (weight × sub-score).
- Cash flow +19.5/30.0
- Appreciation +10.0/10.0
- DSCR +6.1/10.0
- 1% rule +4.2/10.0
- ARV discount +3.8/15.0
- Schools +3.4/10.0
- Livability +3.2/5.0
- Rent growth +2.5/5.0
- Condition / age +2.5/5.0
$185,500
🖨 Deal sheet 📄 Offer letter ✓ Due diligence
Listing remarks
Beautiful 4 bedroom, 2 bathroom home in Highland, AR offering 1,850 square feet of comfortable living space. KEY FEATURES: Upstairs office 2 outdoor sheds Jack & amp; Jill bathroom HUGE walk in closet off master bedroom Gas log fire place Corner lot Circle drive Concrete circle pad in the back yard, perfect for pool 3 different electric outlets in back yard 1 electric outlet on front porch Beautiful bay window in living room AND SO MUCH MORE Inside you will discover a bright and open floor plan featuring generous living areas, ideal for family gatherings or quiet evenings at home. The well-appointed kitchen provides ample cabinet and counter space, making meal preparation both c
Key facts
- Upstairs office
- Walk in closet
- Outdoor sheds
Tags
Neighborhood map
What this means for you Summary
Snapshot
- This is a 4-bed/2.0-bath single-family listed at $186k.
Deal economics
- At list price, monthly cash flow is $209 ($3k/yr) — positive.
- The deal already cash-flows at list — no discount required.
- To meet the 1% rule (rent ≥ 1% of price), the offer needs to be $170k (8.3% below list).
- Recommended offer: $170k (8.3% below list) — sets the bar for 1% rule.
Location & tenants
- Location reads 64/100 on livability (#169 in AR) — a middle-class / working-renter tenant base. Strengths: crime A+, cost of living A+, housing A; Watch: schools F, amenities F, commute F.
- Highland School District (town): math 43% / reading 39% proficiency, ranked #66 of 238 in AR (top 28%) — families likely to look elsewhere, expect single-tenant / working-renter base with shorter leases.
- Market conditions: 131 active listings in the ZIP; 4 units permitted in Sharp County in 2024 (0 in 5+ unit buildings).
Forward outlook
- In year one you build about $20k of equity ($1k loan paydown + $19k appreciation (10.0% local appreciation)).
- Sharp County population projected at -11% by 2050 — secular population decline; favor cash flow + early exit over multi-decade hold.
- At projected returns (10.0% appreciation + 3.0% rent growth), your $52k cash investment doubles in ~3 years — after that, you're playing with house money.
- By year 2, paydown + projected appreciation supports a ~$32k cash-out refi (75% LTV) — recoverable capital for the next deal without selling this one.
Negotiation context
- It's been on market 26 days — a 2% lower offer ($183k) is reasonable based on typical stale-listing flexibility.
- 5 sale attempts since 4y ago with the ask held roughly flat each time — persistent listings suggest the price (not the market) is what's stuck; bring a comps-based counter.
Risks & watch-outs
- Climate carrying-cost: moderate wildfire risk — expect insurance premiums to compound above CPI over the hold.
Questions for the listing agent
- Is there a deadline driving the sale (1031 exchange, divorce, estate, relocation)? That informs how much negotiation room exists.
- Schools are F-rated, which usually means shorter tenancies and higher turnover. Who's the typical renter profile here, and what's been the actual vacancy rate?
- What's the average days-on-market for RENTAL listings here right now (not sales)? A rising rental-DOM trend means longer vacancies and softer asking-rent achievability than the comps imply.
- What's the recent tenant-quality profile in this submarket — average credit score on applications, eviction rate, late-payment / NSF rate, and stable-employment percentage? A property-management company in the area should have these aggregated.
- How much new for-sale + rental construction is in the pipeline within 1–3 miles? Heavy new supply typically softens prices + rents 12–24 months out; constrained supply supports both.
Investment metrics
- 1% rule
- 0.92% ✗
- Cap rate
- 7.64%
- Cash-on-cash
- 4.83%
- DSCR
- 1.21
- GRM
- 9.1
CMA / ARV
- ARV (on-the-fly)
- $171,350
- Comps found
- 7
Show comp detail 7 sales within ~0.75 mi
| Address | Dist | Beds/Ba | Sqft | Sold | Price | $/sf | Match |
|---|---|---|---|---|---|---|---|
| 36 Alma Ln Ln | 0.16mi | 3/2.0 (-1) | 1,566 (+5%) | 7mo | $180,000 | $115 | 73 |
| 108 Dusty Trl | 0.05mi | 3/2.0 (-1) | 1,280 (-14%) | 9mo | $204,900 | $160 | 62 |
| 14 Mixtec Cir | 0.58mi | 3/2.0 (-1) | 1,413 (-5%) | 10mo | $115,000 | $81 | 51 |
| 4 Miccosukee Dr | 0.69mi | 3/2.0 (-1) | 1,520 (+2%) | 14mo | $174,900 | $115 | 48 |
| 104 Dusty Trl | 0.43mi | 3/2.0 (-1) | 1,280 (-14%) | 14mo | $225,000 | $176 | 40 |
| 1 Paracas Trce | 0.54mi | 3/1.5 (-1) | 1,696 (+14%) | 6mo | $160,000 | $94 | 39 |
| 32 Opalochee Dr | 0.52mi | 4/2.0 | 1,315 (-12%) | 21mo | $148,000 | $113 | 39 |
Match score weights: distance 35% · size 25% · config 20% · recency 20%. Top-matched comps best support the ARV.
Projected returns pro-forma
10.0% appreciation · 3.0% rent growth · sell at horizon
- IRR
- 27.8%
- Equity multiple
- 3.20×
- Total profit
- $114,271
- Equity at exit
- $167,113
- IRR
- 24.2%
- Equity multiple
- 7.27×
- Total profit
- $325,916
- Equity at exit
- $360,386
Cash invested: $51,940 (down + closing). Projections, not guarantees.
Landlord ↔ Tenant lean methodology
- Overall (STATE)
- 92 Strongly Landlord-Friendly
- State Arkansas
- 92 Strongly Landlord-Friendly · R+14
- County
- — inherits STATE
- City
- — inherits STATE
ZIP-level market 72542
- Home prices YoY
- 26.5%
- Active inventory
- 131
- Price-to-rent
- 9.1×
Monthly cashflow live
- Estimated rent
- $1,702 medium interval (Pro) →
- Mortgage (P&I)
- −$973
- Tax from tax record
- −$85 /mo · $1,024/yr
- Insurance
- −$77
- HOA
- −$0
- Vacancy / Maint / Mgmt
- −$357
- Net cashflow
- $209
Break-even live
UW: 25.0% down · 7.5% · 30yr · 1.5% tax · 5.0% vac · 8.0% maint · 8.0% mgmt
Financing live
Cash to close
- Down payment
- $46,375
- Closing costs
- $5,565
- Reserves months
- —
- Total cash needed
- —
Loan-product check · same deal, 3 products live
Conventional
25% down · 7.5% · 30yr
- Down + closing
- —
- Monthly P&I
- —
- Monthly cashflow
- —
- DSCR
- —
- Eligible?
- —
Personal DTI + credit; lowest rate.
DSCR
20% down · 8.5% · 30yr
- Down + closing
- —
- Monthly P&I
- —
- Monthly cashflow
- —
- DSCR
- —
- Eligible?
- —
No personal income docs; deal must DSCR.
Hard money
10% down · 12.0% · 12mo
- Down + closing
- —
- Monthly P&I
- —
- Monthly cashflow
- —
- DSCR
- —
- Eligible?
- —
Short-term bridge; refi at stabilization.
Listing history 35 events
-
2026-06-19days on market $185,500 Active 26 DOM
-
2026-06-18days on market $185,500 Active 25 DOM
-
2026-06-17days on market $185,500 Active 24 DOM
-
2026-06-16pricedays on market $185,500 Active 23 DOM
-
2026-06-15days on market $189,900 Active 22 DOM
-
2026-06-14days on market $189,900 Active 20 DOM
-
2026-06-12days on market $189,900 Active 19 DOM
-
2026-06-09days on market $189,900 Active 16 DOM
-
2026-06-08days on market $189,900 Active 15 DOM
-
2026-06-07days on market $189,900 Active 14 DOM
-
2026-06-04days on market $189,900 Active 10 DOM
-
2026-06-02days on market $189,900 Active 9 DOM
-
2026-06-01days on market $189,900 Active 8 DOM
-
2026-05-31days on market $189,900 Active 7 DOM
-
2026-05-31days on market $189,900 Active 6 DOM
-
2026-05-25$189,900 Active
-
2026-04-23historical
-
2026-04-16price $197,000
-
2026-02-26$197,500 New Listing
-
2026-02-26historical
-
2026-01-27price $197,500
-
2025-11-15price $200,000
-
2025-10-25price $205,500
-
2025-10-07price $214,500
-
2025-09-20price $217,000
-
2025-09-13price $220,000
-
2025-08-29$225,000 New Listing
-
2023-04-14soldstatus $180,300 Sold
-
2023-02-26status Under Contract
-
2023-02-26status Back on Market
-
2022-12-15historical
-
2022-07-22soldstatus $150,000
-
2022-06-14$189,900 New Listing
-
2006-11-14soldstatus $60,000
-
1997-12-10soldstatus $55,000
ⓘ Source: listings_history table (triggers on properties + properties_extension) + one-shot
backfill from property_details.listing_events for pre-trigger history.
Tax reassessment forecast AR · Resets to sale price
- Current annual tax
- $1,024 · $85/mo
- Projected year-2 tax
- $1,187 · $99/mo
- Expected delta
- +$163/yr (+$14/mo · 16.0%)
ⓘ Screening estimate from a state-policy table — verify with the county assessor before closing.
Climate risk First Street
- Flood 1/10 Low FEMA zone X (unshaded) · 0% chance over 30 yrs
- Wildfire 5/10 Major
- Heat 4/10 Moderate 7 d/yr ≥108°F today · 20 d/yr by 30 yrs out
- Wind 2/10 Low 4% chance of damaging wind over 30 yrs
- Air quality 1/10 Low 0 unhealthy d/yr today · 0 by 30 yrs out
Nearby sold comps map
Loading sold comps map…
Walkable amenities ~0.75 mi
Loading nearby amenities…
Taxation est. · year 1
- Rental income
- $20,420
- − Mortgage interest
- −$10,391
- − Property taxes
- −$1,024
- − Insurance
- −$928
- − Repairs & maintenance
- −$1,634
- − Management
- −$1,634
- − Depreciation
- −$5,396
- Taxable loss
- −$586
- Est. tax savings @ 24.0%
- +$141
- After-tax cash flow
- $2,648/yr
For passive investors: Depreciation is non-cash, so a rental often shows a tax loss while cash-flowing — sheltering income. Rental losses are passive: they offset passive income freely, and up to $25,000/yr can offset ordinary (W-2) income if you actively participate and your MAGI is under $100k (phasing out to $0 by $150k); unused losses carry forward. On sale, claimed depreciation is recaptured at up to 25%, and gains may owe capital-gains tax (a 1031 exchange can defer both). Figures are a year-1 estimate at your 24.0% rate — not tax advice; consult a CPA.
Schools (NCES district)
- District
- Highland School District
- NCES district ID
- 0507770
- Math proficiency
- 43% ▼ -7.00%
- Reading proficiency
- 39% ▼ -9.00%
- Median HH income
- $32,066
- Composite
- 33.63/100
- National rank
- #5400
- State rank
- #66 of 238 in AR
Livability — Highland
- Score
- 64/100
- State rank
- #169
- US rank
- #14238
Category grades
Schools grade is shown separately in the Schools card above.
Census & demographics
- Census place
- Highland, AR
- Population (ZIP)
- 3,829
Population outlook (Sharp County) Hauer SSP2
- Today (2025)
- 16,170 people
- By 2030
- 15,711 · -2.8%
- By 2040
- 14,974 · -7.4%
- By 2050
- 14,420 · -10.8%
- By 2075
- 13,235 · -18.2%
- By 2100
- 11,492 · -28.9%
Race, ethnicity, and origin ACS 2023
- Neighborhood character
- Predominantly White (88%)
- Race & ethnicity
- White 88% Two or more races 9% Asian 1%
- Common ancestry
- Lithuanian 9% Slovak 3% Italian 2%
- Foreign-born
- 1%
- Languages at home
- 99% English-only · Other Indo-European 1%
Political lean MEDSL · Sharp
- 2024 margin
- Solid R (+62.7) · D 17.7% · R 80.4% · Other 1.9%
- 2008→2024 swing
- -33.7pp toward R · 2008: -28.9pp · 2024: -62.7pp
- All cycles
- 2024: R+62.7 2020: R+60.0 2016: R+54.7 2012: R+38.8 2008: R+28.9
Not yet ingested
- Civics
- —
Market trends
- HPI YoY
- ▲ 40.05%
- Current HPI
- 191.38
- Rent YoY
- —
- Metro
- —
- State GDP YoY
- ▲ 3.80%
- F500 in state
- 10
Industry mix (Fortune 500 HQ in AR)
| Industry | F500 HQs | Revenue |
|---|---|---|
| Retail | 1 | $681B |
|
||
| Food / Agriculture | 1 | $53B |
|
||
| Retail / Energy | 1 | $22B |
|
||
| Transportation / Logistics | 1 | $12B |
|
||
| Energy | 1 | $4B |
|
||
Price history
+245.3% since first listed20 events — show timeline
- 2026-05-25 Listed $189,900 FSBO.com
- 2026-04-23 Listing Removed — CARMLS
- 2026-04-16 Price Changed $197,000 CARMLS
- 2026-02-26 Listed $197,500 CARMLS
- 2026-02-26 Listing Removed — CARMLS
- 2026-01-27 Price Changed $197,500 CARMLS
- 2025-11-15 Price Changed $200,000 CARMLS
- 2025-10-25 Price Changed $205,500 CARMLS
- 2025-10-07 Price Changed $214,500 CARMLS
- 2025-09-20 Price Changed $217,000 CARMLS
- 2025-09-13 Price Changed $220,000 CARMLS
- 2025-08-29 Listed $225,000 CARMLS
- 2023-04-14 Sold (MLS) $180,300 CARMLS
- 2023-02-26 Pending — CARMLS
- 2023-02-26 Relisted — CARMLS
- 2022-12-15 Listing Removed — CARMLS
- 2022-07-22 Sold (Public Records) $150,000 Public Records
- 2022-06-14 Listed $189,900 CARMLS
- 2006-11-14 Sold (Public Records) $60,000 Public Records
- 1997-12-10 Sold (Public Records) $55,000 Public Records
Property tax history
+16.7%/yrLatest (2025): $1,024 · +0.0% YoY. Source: county tax records.
Cash-flow waterfall
monthlySold comps — $/sqft
last 12 mo · ≤1 miLoading sold comps…